Will GOLD continue to hold back the bulls?XAUUSD - 24h expiry
Although the bulls are in control, the stalling positive momentum indicates a turnaround is possible.
We are trading at overbought extremes.
A higher correction is expected.
Preferred trade is to sell into rallies.
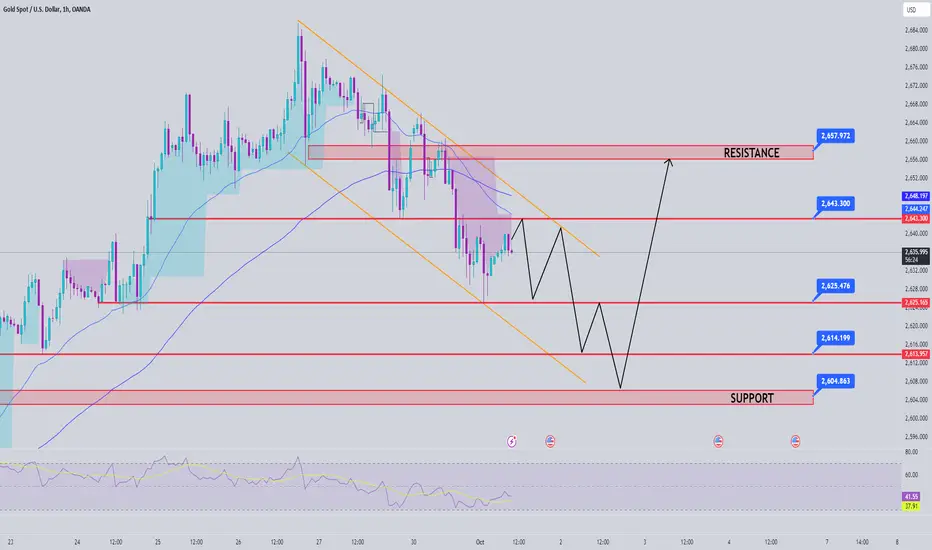
Bespoke resistance is located at 2660.
We look to Sell at 2662.2 (stop at 2678.2)
Our profit targets will be 2622.2 and 2612.2
Resistance: 2654.0 / 2670.2 / 2685.6
Support: 2632.0 / 2624.7 / 2600.0
Risk Disclaimer
The trade ideas beyond this page are for informational purposes only and do not constitute investment advice or a solicitation to trade. This information is provided by Signal Centre, a third-party unaffiliated with OANDA, and is intended for general circulation only. OANDA does not guarantee the accuracy of this information and assumes no responsibilities for the information provided by the third party. The information does not take into account the specific investment objectives, financial situation, or particular needs of any particular person. You should take into account your specific investment objectives, financial situation, and particular needs before making a commitment to trade, including seeking advice from an independent financial adviser regarding the suitability of the investment, under a separate engagement, as you deem fit.
You accept that you assume all risks in independently viewing the contents and selecting a chosen strategy.
Where the research is distributed in Singapore to a person who is not an Accredited Investor, Expert Investor or an Institutional Investor, Oanda Asia Pacific Pte Ltd (“OAP“) accepts legal responsibility for the contents of the report to such persons only to the extent required by law. Singapore customers should contact OAP at 6579 8289 for matters arising from, or in connection with, the information/research distributed.
Goldidea

Gold Price Analysis July 10Fundamental Analysis
Gold (XAU/USD) traded negative for the fourth consecutive day on Monday, despite no follow-through selling, remaining confined within a familiar range that has held for the past week or so amid mixed fundamental signals. Friday’s upbeat US jobs report dashed market expectations for more aggressive easing by the Federal Reserve, helping the US Dollar (USD) rise to near seven-week highs and weighing on the non-yielding yellow metal.
In addition, the underlying bullish tone across global equity markets further undermined safe-haven Gold. However, any meaningful corrective pullback remains elusive amid persistent geopolitical risks stemming from ongoing conflicts in the Middle East, which tend to favor the precious metal. Traders may also want to wait for the FOMC meeting minutes to be released this Wednesday and the US consumer inflation data on Thursday.
Technical analysis
Gold has bounced strongly from the session support zone of 2640. At the moment, the trading range of gold is relatively wide and the NF has not been able to help gold form a new specific trend. In the h4 or h2 time frame, the trading range is clearly seen at 2635 and 2670. When this range is broken, the price will form a new trend. Besides, we pay attention to the areas that are prone to fake 2625 and 2685.

XAUUSD: getting support!Gold prices continued to fall slightly this morning, and I couldn't help but notice the impact of the tension in the Middle East. Gold has always been considered a safe investment channel when world politics fluctuate, and since the beginning of 2024, the price has increased by more than 28%. This is not accidental, but largely due to concerns about escalating tensions in the region.
The market is currently very sensitive to political fluctuations, and I see many investors still waiting for new moves from the Fed. According to David Morrison, an analyst at Trade Nation, the expectation that the Fed will continue to cut interest rates below 3% is a strong supporting factor for gold prices.

XAUUSD: New Day Trading Strategy!Currently, XAUUSD is hovering around the 2662 USD mark, and it seems that the price has remained relatively stable over the past few days. On the other hand, the resistance level at 2670 is acting as a significant barrier to upward momentum. Interestingly, XAUUSD is forming a green candlestick right above the parallel wedge.
If this candle closes above the wedge, we could fully expect a strong breakout, aiming for new profit targets. Additionally, the positive signals from the EMA 34 and 89 are reinforcing this view, indicating a clear upward trend.
Investors might consider opening BUY positions on shorter timeframes, once the price confirms a breakout from the current range, provided that the support level around 2654 USD holds firm.

XAUUSD todayHello everyone,
Gold prices today continue to slide, dropping to $2,642, down 0.6% on the day.
This decline is largely driven by the U.S. Dollar (USD) extending its strong recovery, after hitting its lowest point since July 2023, now reaching its highest level in three weeks. This comes amid fading expectations of the Federal Reserve (Fed) implementing further aggressive monetary easing.
Moreover, gold closing below the $2,650 mark signals that the precious metal is entering a short-term bearish zone, with the next target expected to hit $2,630.
What are your thoughts on the current gold price situation?

Gold Thoughts - 03-Oct-2024Good morning all , Kindly see my Gold thoughts for today. These videos are aimed at making you compare charts with mine if you are a price acton trader and use my thoughts to improve your skill. They are not meant as signals even if they seem like they are. I want you to learn and be great

XAUUSD today !Looking at the XAUUSD 2-hour chart you provided, we can see that the price is currently trading around $2,658 after a slight retracement from the resistance zone around $2,685. The chart shows that gold is still facing pressure from the resistance zone marked by the orange rectangle at the top, which has been tested several times but has not yet been decisively broken.
Technical Analysis:
Resistance Zone: The resistance zone near $2,685 seems to be acting as a strong barrier, with prices reacting negatively whenever they come close to it. If this resistance holds, we could expect a further pullback.
Support Zone: The blue support area around $2,620 is clearly a critical zone. Any price movements down to this area may offer strong buying interest. A bounce from this level could signal a continuation of the upward trend.
EMA Levels: The price is still above both the 34 EMA ($2,653) and 89 EMA ($2,641), indicating that the overall trend remains bullish, although short-term corrections are expected.
RSI Divergence: On the RSI, we see multiple bearish divergence signals, which suggest that the upward momentum is weakening. This might indicate a potential retracement in the short term before a stronger move upwards.
News Influence:
The hot geopolitical tensions and economic data are fueling uncertainty, which often benefits gold as a safe-haven asset. Recent developments, such as uncertainty around global inflationary pressures and the Federal Reserve’s cautious approach to interest rate hikes, continue to support gold prices. Investors are still considering gold as a hedge against these factors, further strengthening the bullish outlook.
In summary, we are in a phase where a potential retracement toward $2,620 may happen before we see another push toward breaking the $2,685 resistance level. If this break occurs, we could see gold targeting $2,700 and even higher toward the $2,750 psychological level.
What do you think? Will the support hold, or do you see further downside potential before the next move up? Let's discuss!

Gold price analysis on 2nd of MayFundamental Analysis
According to the Institute for Supply Management (ISM), risk-off sentiment was the main reason why investors shifted their attention from better-than-expected US employment data to stable business activity in the manufacturing sector.
News reports revealed that Iran attacked Israel. According to ABC sources, Iran will launch 240-250 missiles at Israel. Meanwhile, Israel revealed that its air force will continue to attack targets in Lebanon, while US National Security Advisor Sullivan said, "There will be serious consequences for this attack."
Technical Analysis
Gold broke the trendline and was pushed back to the uptrend, exiting the downtrend channel and facing an important resistance level of 2673. When the price breaks the 2673 zone, it will form a strong uptrend channel and head towards 2700. The pullback to 2643 is considered an opportunity to buy at the present time, let's wait for the price reaction and trade together.
Trading signals
BUY GOLD 2643-2641 Stoploss 2538
SELL GOLD 2672-2674 Stoploss 2677
SELL GOLD 2684-2686 Stoploss 2688
SELL GOLD 2699-2700 Stoploss 2704

Gold Price Today: Popular Selling StrategyHello dear traders! Today, the gold market continued to decline sharply, reaching $2635, losing more than 100 pips after yesterday's trading session. This comes from a strong wave of profit-taking by short-term investors as the third quarter of 2024 ends. At the same time, the rebound of the USD has pushed gold prices into a more difficult position.
On the technical chart, the downtrend remains firmly maintained as the parallel downtrend channel has not shown any signs of weakening. In particular, the EMA 34 and 89 have reversed, confirming that the price trend continues to face difficulties. Currently, any short-term recovery is a great opportunity to short. Traders can take this opportunity to continue targeting potential targets such as $2630 and further to $2615 - $2605.

USDJPY trading signalsSELL USDJPY broke the trendline and support zone of the Asian session. The signal has retested the trend zone to welcome our entry before falling 50 pips.
SELL USDJPY small lot now zone 144.200-144.400
Stoploss 144.600
Take Profit 1 143.800
Take Profit 2 142.500

Gold Analysis October 1Fundamental Analysis
Wall Street traded mixed as Federal Reserve Chairman Jerome Powell delivered remarks at the 66th NABE Annual Meeting. Powell ruled out a 50 basis point (bps) interest rate cut at any of the central bank’s remaining policy meetings. Powell said there would be two more 25-bps cuts by 2024 if the economy performs as expected.
The greenback, as measured by the US Dollar Index (DXY), rose 0.15% to 100.56, a drag on the non-yielding metal. A light economic calendar in the US saw the Chicago PMI improve for a third straight month but remain in recessionary territory.
Geopolitical tensions remained high after Israel attacked Hezbollah headquarters in Lebanon, killing the group’s leader in the attack. While this warrants further gains for gold, bullion has failed to gain traction, analysts say.
Meanwhile, China’s economy remains sluggish, which has prompted a government response. The People’s Bank of China (PBoC) is implementing additional economic stimulus measures, which has stimulated money flows into the country’s soaring stock market.
Technical Analysis
A short-term bearish channel is in place, as long as gold remains below the 2643 zone, the downtrend is likely to continue and extend to the 2600 round harbor. Watch for price reaction zones for BUY signals in the 2626-2615-2604 zone. In case of a trend break, the uptrend is limited by the immediate resistance zone 2656.
Trading signals
BUY GOLD zone 2626-2624 Stoploss 2625
BUY GOLD zone 2615-2613 Stoploss 2609
BUY GOLD zone 2604-2602 Stoploss 2599
SELL GOLD zone 2656-2658 Stoploss 2671
SELL GOLD zone 2643-2645 Stoploss 2649
Gold price may break through to 2700Gold extended its decline after hitting a record high, currently trading around $2,650. However, the precious metal remains in an uptrend on a short, medium and long-term basis, and since the basic principle of technical analysis is that “the trend is your friend”, the odds are in favor of further upside for the yellow metal.
Support levels to watch are: 2,650 - 2,644
Resistance levels to watch are: 2,670 - 2,680 - 2,700

Gold Thoughts 30-Sept-2024Happy New Week all, Kindly see my Gold thoughts for today. These videos are aimed at making you compare charts with mine if you are a price acton trader and use my thoughts to improve your skill. They are not meant as signals even if they seem like they are. I want you to learn and be great

XAUUSD: Buyers still have a chance.The price started the week with a spike near the dynamic resistance at $2670, but quickly retreated after the reaction, currently at $2653 and down 0.17% on the day.
Although the price of gold has been slightly negatively affected by the market after lacking the momentum and fundamental news to break above the psychological resistance at $2700, this can be seen compared to the 2685 setup. However, the outlook for the metal remains bright at high prices, despite profit-taking from the market. The only concern from the market going forward is the NFP news, which, coupled with concerns about the situation in the Middle East and interest rate cuts and expectations of further adjustments in the future, will have a positive impact on the price of gold.
Traders can consider buying when the price drops to the support level around $2625.

Gold prices tend to decrease at the weekend!Hello everyone, Conan here.
Today, gold prices are showing a downward trend. After failing to break through the resistance levels of 2670 - 2680, the price has started to decline and is currently trading around 2658 USD. This drop has been supported by some USD buying activity, which tends to weaken demand for this commodity. Additionally, the optimistic market sentiment, fueled by new stimulus measures from China, turned out to be another factor pushing money away from the safe-haven precious metal.
As seen on the 1-hour chart, gold prices are still reacting around the EMA 34, and the descending wedge pattern remains unbroken, indicating that the downtrend is not over yet. Based on these factors, in my personal opinion, gold prices are likely to continue falling in the near future, possibly reaching a lower level around 2640 USD.

GBPUSD analysis week 40Fundamental Analysis
According to CME Group’s FedWatch Tool, the market is currently pricing in a more than 75% chance of the Federal Reserve cutting interest rates by another 50 basis points in November. In addition, weaker US macroeconomic data on Tuesday, coupled with the prevailing risk-on environment, further undermined the safe-haven dollar and confirmed the positive near-term outlook for GBP/USD.
Going forward, there is no market-relevant economic data due out of the UK on Wednesday. However, a scheduled speech by BoE MPC Member Megan Greene could influence GBP and provide some impetus to the GBP/USD pair. Later in the early North American session, US New Home Sales data could contribute to short-term trading opportunities.
Technical Analysis
GBPUSD’s trading range has remained largely unchanged over the past week. With little technical movement we still see the pair in a solid range of 1.323 and 2.349. In the short term we can see that the immediate support zone has been raised after the price reacted strongly at 1.331 and the resistance level forming a triple top around 1.342 has been established. The GBPUSD direction could continue the correction early next week and reach the yearly record around 1.350 in the near term.
Trading signals
SELL GBPUSD zone 1.349-1.351 Stoploss 1.353
BUY GBPUSD zone 1.323-1.321 Stoploss 1.319

XAUUSDPair : XAUUSD ( Gold / U.S Dollar )
Description :
Completed " 12345 " Impulsive Waves
Break of Structure
RSI - Divergence
Symmetrical Triangle as an Corrective Pattern in Short Time Frame
Demand Zone

XAUUSDPair : XAUUSD ( Gold / U.S Dollar )
Description :
Completed " 12345 " Impulsive Waves
Break of Structure
RSI - Divergence
Symmetrical Triangle as an Corrective Pattern in Short Time Frame
Demand Zone

XAUUSD Top-down analysis Hello traders, this is a complete multiple timeframe analysis of this pair. We see could find significant trading opportunities as per analysis upon price action confirmation we may take this trade. Smash the like button if you find value in this analysis and drop a comment if you have any questions or let me know which pair to cover in my next analysis.

World gold may reach 2,700 USD this weekendHello everyone!
Recently, gold prices have increased sharply, nearly 570 USD/ounce, after the US Federal Reserve decided to cut interest rates by another 0.5%. Currently, gold is on track to reach a new high, expected to reach 2,700 USD/ounce.
The upcoming important event is the US presidential election, which can create many unpredictable fluctuations in the market, which will further promote gold as a safe haven channel that many investors prioritize.

XAU/USD 27 September 2024 Intraday AnalysisH4 Analysis:
-> Swing: Bullish.
-> Internal: Bullish.
Price has continued to surge printing all time highs with price pulling back very minimally.
Price has printed a further bullish iBOS. Bearish CHoCH has been printed indicating bearish pullback phase initiation. We also have established an internal range.
You will note the internal range has extensively narrowed, allowing price to confirm swing pullback phase by printing bearish iBOS. However, we remain bullish.
Intraday expectation: Price to target weak internal high, however, due to the narrowing of the internal range and all HTF's requiring pullback, it would not be unrealistic is price printed a bearish iBOS.
H4 Chart:
M15 Analysis:
-> Swing: Bullish.
-> Internal: Bullish.
Intraday expectation was met with price printing bullish iBOS.
Price is now contained within an internal range and is in discount of internal 50% EQ.
Intraday expectation: Technically price should target weak internal high. Expecting reaction from discount of 50% EQ or M15 demand zone.
Alternative scenario: Due to all HTF's requiring a pullback, it would not be unexpected if price prints a bearish iBOS.
M15 Chart:

Gold Price Analysis September 27Fundamental Analysis
Gold (XAU/USD) attracted some sellers over the weekend and fell further from its all-time high, around the $2,685-$2,686 region hit on Thursday. The decline was financed by some buying of the US Dollar (USD), which tends to weaken demand for the commodity. In addition, the bullish market mood, fueled by China’s new stimulus measures, turned out to be another factor driving outflows from the safe-haven precious metal.
That said, expectations of a more aggressive easing policy from the Federal Reserve (Fed) kept the USD confined to a familiar range that has been maintained for about two weeks and within striking distance of the YTD low set last week. This, coupled with the risk of further escalation of geopolitical tensions in the Middle East, should limit losses for Gold. Traders may also prefer to wait for the release of the US Personal Consumption Expenditures (PCE) Price Index.
Technical Analysis
Currently, the trading range of gold is very wide. and Gold can make an ATH at any time during this period. The lower border area is focused on ports 2650 and 2640. The upper area of ATH is focused on the round ports 2690 and 2700. If gold holds above the 2662 hook until the middle of the US session, we can still set up buy orders in this area to the upper resistance areas, and if it breaks 2662, wait for retest and sell to 2650-2640
BUY XAUUSD 2651-2649 Stoploss 2646
BUY XAUUSD 2641-2639 Stoploss 2636
SELL XAUUSD 2688-2690 Stoploss 2693
SELL XAUUSD 2699-2701 Stoploss 2704

Gold prices continue to hold high amid profit-taking pressureHello everyone, let’s join in analyzing today’s gold prices!
XAUUSD is continuing its strong uptrend, currently trading around $2,659.
In the short term, the bullish momentum is clear, with the trendline, EMAs, and other technical factors all supporting buyers despite previous pressure. However, with the profit-taking resistance still intact at $2,670, buyers may significantly weaken, especially with today’s scheduled news, which could cause major volatility.
Traders might consider selling if the price forms a double top around $2,670, with a target of $2,625.
SELL GOLD: 2670 - 2672
STOPLOSS: 2675
TP: 2640 , 2625
Wishing you all successful trades and great profits!
