How much will gold continue to rise?☘️Fundamental analysis
Gold prices (XAU/USD) trimmed gains after hitting a fresh record high around $2,482-$2,483 during the Asian session on Wednesday and are now trading near the lower end of their daily range . The pullback lacks any clear fundamental catalysts and is likely to remain cushioned amid dovish Federal Reserve (Fed) expectations.
Investors now appear to believe that the US central bank will begin an interest rate cutting cycle in September, which has sent US Treasury yields falling to near multi-month lows. This has not helped the US Dollar (USD) register any meaningful recovery from the more than three-month low it hit earlier this week and will continue to act as a driving force behind Gold prices. yield. Therefore, any subsequent price slippage could still be seen as a buying opportunity. Traders are now looking to US Industrial Production figures for near-term momentum.
☘️Technical analysis:
The continuous breakout through the $2,450 supply zone has left gold with no clear resistance area above. Any further upside move will most likely encounter some resistance and stop near the psychological $2,500 mark.
On the other hand, any meaningful slide below the $2,450 zone could now be seen as a buying opportunity and the next cap is near the $2,445-2,425 resistance, which has now turned into support. However, a convincing break below the latter could prompt some technical selling and drag Gold prices down to the $2,400 mark. The possibility of 2400 in the current context is unlikely because world economic and political factors are still supporting Gold.
Support: 2450 - 2442 - 2426 - 2418
Resistance: 2500
BUY zone 2451 - 2449 stoploss 2445
BUY zone 2442 - 2440 stoploss 2336
SELL zone 2500 Stoploss 2505
Goldidea

Gold is about to welcome a low interest rate cycle☘️Fundamental analysis
Gold prices ended their decline in early European trading on Monday. Gold will gain further amid dovish expectations from the Federal Reserve (Fed). In fact, market participants appear to believe that the Federal Reserve (Fed) will begin cutting interest rates in September, which is seen as a boost for the yellow metal.
Additionally, US political anxiety following the assassination of former US President Donald Trump and China's economic difficulties confirm the positive short-term outlook for XAU/USD.
☘️Technical analysis
From a technical perspective, the strong recovery after touching the 2400 support zone has shown that investor sentiment is still supporting the BUY side. Buying power is further strengthened when RSI always remains stable above 50.
If the pre-market reaction is small and continued selling at 2410 could pull gold towards the key support area at 2393. A further decline could expose support at the 89 EMA in the h4 frame and this is a controversial price area around 2370-2368.
In the direction that the whole market is expecting. Last week's high, around $2,425 now appears to be acting as an immediate barrier, above which Gold prices are more likely to return to challenge all-time highs, around 2,450.
Support: 2393 - 2382- 2370
Resistance: 2425 - 2433 - 2448
Trading signals
BUY GOLD 2393-2391 Stoploss 2387
BUY GOLD 2370-2368 Stoploss 2365
SELL GOLD 2433-2435 Stoploss 2438
SELL GOLD 2448-2450 Stop loss 2453

Gold analysis new week☘️Fundamental analysis
Gold prices rose to the 2410 zone on Friday after hitting an intraday low of $2,391. The yellow metal will extend gains for a third straight week on speculation that the Federal Reserve (Fed) could begin an easing cycle in September.
The US Bureau of Labor Statistics on Friday revealed that the Producer Price Index (PPI) increased slightly in June, above analysts' estimates. As a result, US Treasury yields are falling, a boost for the non-yielding metal, which benefits from low yields.
Meanwhile, Fed officials remain cautious about changes in monetary policy. Fed President St. Louis Alberto Musalem stated that current interest rates are appropriate for current conditions and expects the economy to grow between 1.5% and 2% this year. US Dollar Index (DXY), according to The US dollar tracked against six other currencies, which fell more than 0.40% to 104.09.
☘️Technical analysis
Gold prices consolidate above $2,400 for the second day in a row after decisively breaking the Head-and-Shoulders neckline. Momentum favors the buyers, despite being depicted by a flat Relative Strength Index (RSI).
That being said, the path of least resistance is up. The first level of resistance for XAU/USD will be the yearly high of $2,450, ahead of the $2,500 round mark. Conversely, if Gold slips below $2,400 there will be many support levels to push the gold price back to its orbit. Two notable levels coincide with the two EMA lines at 2390 and 2365. Deeper is the 2340 most important Break Out zone that we pay attention to for gold to maintain its long-term uptrend.
Support: 2390-2365-2351-2340
Resistance: 2424-2433-2450

Gold approaches all-time peak☘️Fundamental analysis
Gold prices rose sharply for the second day in a row, reflecting positive moves over the previous six days - and surpassed $2,440 in early European trading. The prevailing risk environment is helping to limit gains in this safe-haven commodity. The short-term bias appears to favor bullish traders amid growing acceptance that the Federal Reserve (Fed) will begin cutting interest rates in September. overnight comments from the Chairman Fed Jerome Powell, kept US Treasury yields low and confirmed a positive outlook for the non-yielding yellow metal. Traders are now looking towards the release of the US Monthly Retail Sales data for fresh impetus.
☘️Technical analysis
The large-frame chart oscillators remain in positive territory and remain far from overbought territory, suggesting that the path of least resistance for Gold prices is to the upside. Therefore, further strength towards challenging the all-time high, around the $2,450 region, seems a clear possibility. Some follow-through buying should be seen as a fresh trigger for bullish traders and pave the way for an extension of the recent uptrend witnessed over the past three weeks or so.
On the other hand, a drop below the 1,618 fibonacci around the $2,430 zone could now be considered a prerequisite for a return to the 2,400 lows. Although this is not an easy thing to do in the current market climate. If this happens, it is considered a great opportunity for investors who missed this price range at the beginning of the week to recapture a long-term BUY signal.
Support: 2430 - 2413 - 2401 - 2392
Resistance: 2449 - 2470 - 2500
SELL price range 2449 - 2451 stoploss 2455
BUY price range 2392 - 2390 stoploss 2386

Scalping GOLD m15On the m15 frame chart we will have Scalping signals today with support at 2365 and resistance at 2371. The main trend in the small frame is up and is being supported by two EMA lines. Therefore, a BUY scalp signal around 2365 is still being considered by investors.
Gold prices held steady in early trading Wednesday morning in Asia.
Expectations of Fed interest rate cuts continue to boost yellow metal prices.
The PBoC has restrained gold purchases for a consecutive month, limiting XAU/USD's rise.

XAU-USD thoughts 10-07-2024Here are my thoughts for Gold for today, looking for possible long and short opportunities. These videos aren't meant to be signals, they are for you to have a thought process for the markets.

Slight fluctuations after price reductionGold prices increased slightly in early trading Tuesday morning in Asia. Rising interest rates dampen expectations and cash flows into safe havens could limit the precious metal's decline. The pause in gold purchases by the People's Bank of China (PBoC) is likely to put pressure on XAU/USD in the near term.
From a technical point of view, XAU/USD is under pressure, but not bearish. In the small h2 time frame chart, the pair continues to be supported by two EMAs. This could be a temporary recovery in a prolonged uptrend in the near term.
After recovering from EMA 89 around 2351, gold has shown positive signs at the beginning of the Asian trading session. Pay attention to important support and resistance zones to have the best trading strategy.
Support level: 2350-2358
Resistance level: 2371-2380

Gold analysis week 28Disappointing economic data, including a slowdown in the US labor market, have increased market expectations that the Federal Reserve will cut interest rates in September. Expectations are growing. The start of a new easing cycle has pushed the US Dollar index to a 3-week low and bond yields to a 4-week high, creating favorable conditions for gold prices to trade at their highest level in 2019. 4 weeks.
The US economic calendar will not release any data with a significant impact in the first half of next week. However, investors will be watching closely as Chairman Powell will conduct two days of testimony before the Senate Finance Committee on Tuesday and the House Finance Committee on Wednesday.
Gold prices decisively broke the head-and-shoulders neckline, pushing the spot price close to $2,390, suggesting buyers are in control and prices will move even higher.
The momentum has shifted in favor of the buyers as depicted by the bullish Relative Strength Index (RSI). A daily close above the June 21 high of $2,368 could open the door to a trading range higher in the $2,370-2,400 region, with buyers targeting higher levels .
If the price breaks above $2,400, it will hit a yearly high of $2,450 before hitting $2,500.
On the other hand, if sellers push the spot price below $2,350, the price could continue to fall towards $2,300. If this support fails, the next demand zone will be the May 3 low of $2,277, followed by the March 21 high of $2,222.

XAU/USD : Upward Movement Expected Before Potential Correction By analyzing the #gold chart on the 4-hour timeframe, we observe that based on the latest analysis from Friday, gold experienced an initial drop but then saw renewed demand, eventually rising to $2393 and closing above this liquidity pool. After that, we saw that with the market opening, gold experienced a significant drop, correcting by over 200 pips to $2369. Now, the price is trading around $2374, and the old LV has been fully filled as expected, with the price making a higher high. First, I expect an upward movement from the price, followed by another correction. The initial growth targets are $2377, $2380, and $2400. After this growth, I will announce the downward targets.
Please support me with your likes and comments to motivate me to share more analysis with you and share your opinion about the possible trend of this chart with me !
Best Regards , Arman Shaban

EURUSD July 4 analysisEUR/USD surged and rose above 1.0810 to touch its highest since June 12 on Wednesday. The pair remained in consolidation near 1.0800 early Thursday.
Disappointing macroeconomic data from the United States triggered a sell-off in the US Dollar (USD) during US trading hours on Wednesday and gave the EUR/USD pair a boost.
EUR/USD rose above 1.0800 on Wednesday, where the 100-day and 50-day Simple Moving Averages (SMA) converged, but failed to make a daily close above this level. Once 1.0800 is confirmed as support, technical buyers may remain interested. In this scenario, 1.0840 (23.6% Fibonacci retracement level of the latest uptrend) can be considered as temporary resistance before 1.0900 (psychological level, static level).
In case 1.0800 remains resistance, 1.0760 (50% Fibonacci retracement) and 1.0730-1.0740 (61.8% Fibonacci retracement, 20-day SMA) can be considered Support level.
Trading signals
SELL EURUSD zone 1.08450-1.08650
↠ Stoploss 1.08800
→ Take Profit 1 1.08000
→ Take Profit 2 1.07400
BUY EURUSD zone 1.07600-1.07400
↠ Stoploss 1.07300
→ Take Profit 1 1.08000
→ Take Profit 2 1.08600

Gold weakened at the beginning of the weekGold prices started the new week at a mild level and fluctuated within a range below multi-day peaks. Important US inflation data reaffirms market expectations that the Federal Reserve (Fed) may cut interest rates in September and again in December. This, in turn, will pull the Dollar The US dollar (USD) is off the peak reached last week and this is the main factor acting as support for the commodity.
Persistent geopolitical tensions and uncertainty about the final outcome of France's shock election have provided some support for safe-haven Gold prices. Meanwhile, the Fed is expected to cut interest rates only once in 2024, while officials still argue in favor of keeping rates higher for longer. This lifted US Treasury yields to multi-week highs and capped the yellow metal's yield.
Gold is still trading between the EMA 34 and EMA 89 of the h4 frame, showing that gold is hesitant around the 2320-2330 border. A sustained strength beyond this narrow price band has the potential to push Gold prices back to the 2344-2345 resistance area, which if overcome, would allow buyers to reclaim the $2,355 break out mark. Momentum could extend further to reclaim the 2400 key mark once last month's peak resistance of 2385 was broken.
On the downside, any slippage from the tight range is likely to find some support near 2310. A convincing break below that threshold would be seen as a fresh trigger for bearish traders and pull prices. Gold down to 2295. The round support area of 2300 has almost no meaning anymore to support gold price.
Support: 2310-2295
Resistance: 2344-2355
Trading signals
SELL GOLD 2355-2357 SL 2360
BUY GOLD 2295-2293 SL 2290

GOLD- 05-JUL-2024Hello all, sharing my Gold thoughts for today. Looking for possible longs and shorts as usual. It's the last trading day of the week, hoping to end it with a bang.

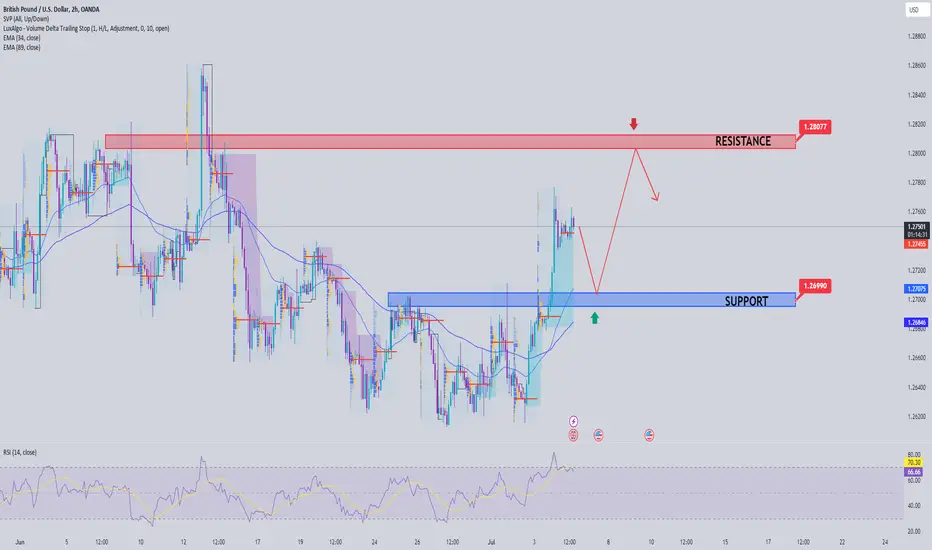
GBPUSD July 4 analysisGBP/USD hovers around 1.2750 on UK election day
GBP/USD is trading sideways near 1.2750 during the European session on Thursday. A generally weaker US dollar helped the pair maintain its upward momentum but traders did not place further bets on the British Pound as British voters went to the polls.
The Relative Strength Index (RSI) on the 4-hour chart has risen above 60, reflecting accumulating bullish momentum. Additionally, the last 4-hour candle closed above the 100-period Simple Moving Average.
On the positive side, the 20-day Simple Moving Average (SMA) and 200-period Simple Moving Average (SMA) on the 4-hour chart form strong resistance near 1.2700. In case GBP/USD rises above this level and begins to use it as support, technical buyers may remain interested. In this scenario, 1.2750 (static level) and 1.2800 (static level, psychological level) can be considered as the next resistance.
If GBP/USD fails to break above 1.2700, it could trigger a technical correction. The 100-day SMA links to key support at 1.2640 ahead of 1.2600 (psychological level, static level).
Trading signals
BUY GBPUSD zone 1.27000-1.26800
↠ Stoploss 1.06700
→ Take Profit 1 1.27500
→ Take Profit 2 1.28000
SELL GBPUSD zone 1.28000-1.28200
↠ Stoploss 1.28300
→ Take Profit 1 1.27700
→ Take Profit 2 1.27000
Gold trades with caution above $2,350, as focus shifts to US NFP☘️Fundamental analysis
Gold prices reversed initial gains to trade cautiously above $2,350 on Thursday. The continued weakness of the US dollar coupled with sluggish US Treasury yields kept gold prices restrained amid market weakness due to the US Fourth of July holiday.
Gold prices traded with a slight positive trend during early European trading hours on Thursday. Gold's trading range today is relatively narrow because today is a bank holiday. Traders also seem reluctant and prefer to wait for the release of monthly employment details from the US Nonfarm Payrolls (NFP) report on Friday before positioning for the next move. a move in direction.
Meanwhile, the downside for gold prices appears to have eased following solid expectations that the Federal Reserve (Fed) will begin an interest rate cutting cycle later this year. Weaker US macroeconomic data released on Wednesday pointed to signs of weakness in the labor market and a weakening economy. Furthermore, the most recent FOMC meeting minutes showed that the majority of policymakers said US economic growth was gradually cooling. This led to an overnight drop in US Treasury yields and dragged the US dollar (USD) to a three-week low, which could further support gold.
☘️Technical analysis
From a technical perspective, the strong breakout above the 2333 and 2344 resistance zones has pushed gold back to its 3-week high around 2365. Daily chart oscillators have begun to gain positive traction. , favoring bullish traders. 2365 Resistance Broken Some follow-through buying and sustained strength above the $2,385 area would reaffirm the prospect of a return to 2400 circular resistance.
On the other hand, gold's ability to turn around is lower. The first key support zone is the break out zone of 2344. The next relevant support level is anchored near the 2333 zone, which if broken, could leave Gold prices vulnerable to further weakness below the most important mark of 2319. gold Closing candles below the 2319 area is not allowed if you want to continue your uptrend.
Support: 2350 - 2344 - 2333 - 2320
Resistance: 2368 - 2385 - 2400
SELL price range 2385 - 2387 stoploss 2395
BUY price range 2345 - 2343 stoploss 2340
BUY price range 2335- 2333 stoploss 2330

GOLD / Short trade opportunity!Hello traders!
As expected in the previous analysis, the GOLD reached the OB level and now I see a good opportunity to execute a short entry.
Please LIKE 👍, FOLLOW ✅, SHARE 🙌, and COMMENT ✍ if you enjoy this idea!
Also, share your ideas and charts in the comments section below! This is the best way to keep it relevant, support us, keep the content here free, and allow the idea to reach as many people as possible.
www.tradingview.com

XAUUSD Pair : XAUUSD ( GOLD / U.S DOLLAR )
Description :
Head and Shoulder Pattern in Long Time Frame
RSI - Divergence
Break of Structure
Completed " 123 " Impulsive Waves
Demand Zone

XAUUSD Pair : XAUUSD ( GOLD / U.S DOLLAR )
Description :
Head and Shoulder Pattern in Long Time Frame
RSI - Divergence
Break of Structure
Completed " 123 " Impulsive Waves
Demand Zone

Gold accumulates narrow margin waiting Nonfarm and new Data✨Fundamental analysis:
Gold prices attracted some buyers after a pullback to 2319, starting a new week amid bets on a September interest rate cut by the Federal Reserve (Fed). Expectations were reaffirmed by data showing the U.S. manufacturing sector contracted for a third straight month in June and the prices factories pay for inputs fell to their lowest level in a decade. six months. This suggests that inflation is subsiding, which should allow the US central bank to begin lowering borrowing costs.
China's economic troubles, persistent geopolitical tensions and political turmoil in the United States and Europe have provided some support for the safe-haven precious metal. The solid recovery in the US Dollar (USD) from multi-day lows has capped any further gains in Gold prices. Benchmark 10-year government bond yields rose to their highest level in a month, seen as a driving force for the USD. Traders are adding signals about the Fed's policy path before placing clear directional bets. Therefore, the focus remains on Fed Chairman Jerome Powell's speech later today and the FOMC meeting minutes on Wednesday.
✨Technical analysis
Gold prices have so far been struggling to overcome the crucial resistance level of 2,340. The said barrier is currently anchored near the 2,338-2,340 zone and will act as an important pivotal point. A sustained strength above this level would pave the way for a move towards the next relevant hurdle at 2355-2368. On the downside, weakness below the $2,319-2,318 zone, or the overnight swing low, could find some support near the $2,300 mark ahead of the $2,285 horizontal zone.
✨Support: 2321-2310-2300-2289
✨Resistance: 2333-2340-2355-2368
SELL GOLD 2340-2342 SL 2345
SELL GOLD 2355-2357 SL 2360
BUY GOLD 2310-2308 SL 2305
BUY GOLD 2300-2298 SL 2295

GBPUSD analysis week 29GBP/USD ended the session in a relatively tight range below 1.2650 after the US Bureau of Economic Analysis released data on the Personal Consumption Expenditures (PCE) price index, the preferred measure of inflation of the Federal Reserve (Fed). Despite the UK's positive GDP report, it still cannot lift the strength of the GBP too much,
After recovering from the week's low hit last Wednesday, the GBP/USD pair limited losses and remained below the psychological level of 1,270, a key threshold for buyers to regain control. Sellers are also under less pressure as they face strong support at the 1.256 area because there is a gap in liquidity at a fairly wide price range. Previously, at the support area of 1,260, the profit-taking area of investors last month was also an area to pay attention to for scalping signals.
The relative strength index (RSI) shows that sellers remain in control, meaning more losses are expected.
Support: 1,260 -1,256
Resistance: 1,269 - 1,273
Trading signals:
SELL GBPUSD zone 1.273-1.275 SL 1.277
BUY GBPUSD zone 1.256-1.254 SL 1.252

Gold prices attract some sellers amid cautious FedGold prices fell again after once again facing rejection above 2334. A stronger-than-expected US purchasing managers index (PMI) released last week prompted Federal Reserve officials The Federal Reserve (Fed) pushed back the timing of cutting interest rates for the first time this year, which continues to limit gold's rise. However, safe-haven flows due to geopolitical tensions in the Middle East and Ukraine could boost the yellow metal in the near term.
Investors will focus on the Fed's Cook and Bowman's speeches on Tuesday. Any evidence of an easing inflation trend could boost expectations of a Fed rate cut by the end of 2024. This could drag the Greenback lower and create a tailwind for Gold priced in USD.
Gold is still trading near the important support level of 2320. We need to wait for more new market data to get an overview of whether the support level around 2320 will hold. Gold price is trading at a lighter level during the day. Gold hinh has formed a downtrend May 10 on the daily timeframe. The two moving averages EMA 34 and EMA 89 are still hesitant and have not clearly shaped the opening trend of the h4 frame.
There are not many important resistance levels near gold's current price range. The price level of 2343 becomes the nearest resistance area, a breach of this level will pave the way to $2,365, the highest level of 2 weeks.
On the other hand, the June 21 low at $2,316 serves as initial support for the yellow metal. Any further selling would see a drop to $2,305, which on a break of 2385 the low of June 7 would be the most important support at the moment.
Support: 2316 - 2312- 2305
Resistance: 2337 - 2345 - 2367
SELL zone 2341 - 2343 stoploss 2346
BUY zone 2302 - 2300 stoploss 2296

Gold trend broken, extending the downtrendGold prices fell for the second day in a row amid the Fed's hawkish outlook. The Fed's September interest rate cut is still on the table, which limits USD gains. Persistent geopolitical tensions contribute to limiting the rapid slide in gold prices.
The greenback followed US Treasury yields higher in the second half of Tuesday's trading session, ahead of hawkish comments from the US Federal Reserve Governor.
The uptrend line of the short-term trend has been broken and a new support price at 2312 has just been formed. The relative strength index (RSI) maintains its position below 50, proving that the downward trend in Gold prices is still continuing. In addition, the EMA 34 has begun to cross the EMA 89, in line with the main trend of the market.
If sellers muster strength, initial support will be at 2,306 and the decline could extend to the bottom of 2,290 three weeks ago.
In the opposite direction, Gold price needs to regain strength when it needs to close the daily candle above 2335 and also above the two moving averages EMA 34 and EMA 89 to return to the long-term upward trajectory. Level 2343 will become an important technical resistance hook for gold today.
Support: 2306 - 2291
Resistance: 2328 - 2343
🕯Trading signals
🔼BUY GOLD scalping zone 2306-2304 Stoploss 2301
🔼BUY GOLD zone 2291-2289 Stoploss 2286
🔽SELL GOLD scalping 2328-2330 Stoploss 2333
🔽SELL GOLD zone 2343-2345 Stoploss 2348
⚡️Psychology, discipline and capital management are the three factors that make victory possible.⚡️

GOLD - Short trade forecast / Sell trade opportunity !Hello Traders!
I am looking for a short trade from the supply & OB resistance zone. I expect to see a 50% retracement which could be turned into a 2R profit target.
Keep in touch and all eyes are on the next move 👀
Please LIKE 👍, FOLLOW ✅, SHARE 🙌, and COMMENT ✍ if you enjoy this idea!
Also, share your ideas and charts in the comments section below! This is the best way to keep it relevant, support us, keep the content here free, and allow the idea to reach as many people as possible.
www.tradingview.com

Investors eagerly await US PCE data✔️Gold prices attracted some selling during the Asian session on Friday and partially reversed the previous day's nice recovery from more than two-week lows. The US dollar (USD) spiked to a new two-month high in the final hour and became the main factor weakening commodities.
✔️That said, expectations that the Federal Reserve (Fed) will begin cutting interest rates later this year provide some support for the precious metal. Additionally, geopolitical tensions in the Middle East and lingering tensions between Russia and Ukraine act as drivers for the safe-haven XAU/USD.
✔️Investors also appear reluctant to bet on the upside and prefer to wait on the sidelines ahead of the release of the US Personal Consumption Price Index (PCE) at the end of the first North American trading session. Important inflation data will influence market expectations of the Fed's future policy decisions, which, in turn, will help determine the next leg of the directional move for Gold prices. profit.
✔️From a technical perspective, gold's positive move has been resisted at the price range of 2,330 points, EMA 89 of the h4 frame and EMA 34 in the long-term uptrend of frame D. The above barrier is currently anchored near the 2,336- 2,338, will now serve as an important pivotal point. Sustained strength beyond that is likely to push Gold prices back into the $2,360-$2,365 supply zone. Some follow-through buying should negate any near-term negative trend and allow bulls to reclaim the $2,400 round mark.
✔️On the downside, the 2300 and 2295 round harbor support marks are likely to protect the decline just ahead of the $2,285 horizontal support. A convincing break below the 2285 handle would be seen as a fresh trigger for traders to bearish on gold to the deeper 2268 zone.
Support: 2310 - 2300 - 2295 - 2285 - 2268
Resistance: 2328 - 2336 - 2344 - 2355
BUY price range 2312 - 2310 stoploss 2307
SELL price range 2335 - 2337 stoploss 2340
BUY price range 2286 - 2384 stoploss 2281
SELL price range 2354-2356 stoploss 2359
