Gold Price Intraday Analysis – Key Resistance and Support LevelsThis chart provides an intraday analysis of gold prices, highlighting critical levels for potential price action. Key zones include Trendline Resistance at 5,108.974, a Minor Resistance at 5,077.929, and a Support Zone at 5,040.216, where price could potentially bounce. The Key Support Level at 4,980.813 offers a strong buying opportunity, while the Final Target at 4,837.129 marks the expected bottom for the downtrend. Traders should monitor these levels for price reactions and plan entries accordingly.
Goldlong

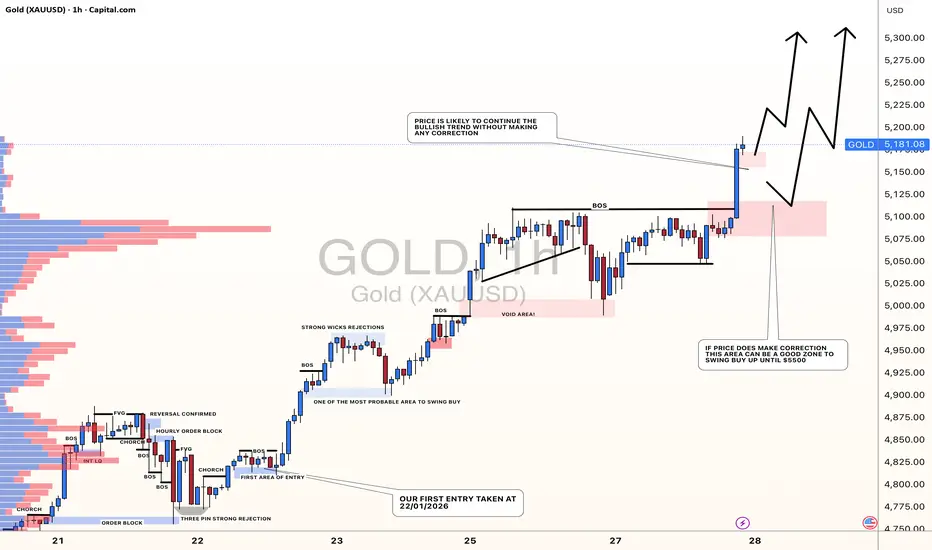
GOLD: Detailed View, Is Price Heading Towards $5500?Gold overview!
After the price built up, we're seeing a strong bullish move. Our earlier analysis today didn't quite work out, but this one points to two key areas where the price might turn around. The first zone is probably the better entry, since the market will open with a gap up and fill it before moving on. A profit target of $5500 looks pretty good.
If you like what we do, please hit like and leave a comment on this idea. And follow us to get updates on new ideas like this one.
Team Setupsfx_
XAUUSD – Brian | H3 Technical Analysis
Gold has officially broken above the 5,000 level for the first time, confirming a major structural shift on higher timeframes. The breakout reinforces the broader bullish narrative, with price now trading firmly in expansion mode rather than consolidation.
The move above 5,000 reflects sustained safe-haven demand amid elevated global uncertainty. While short-term volatility remains possible, the broader environment continues to favour gold as a defensive asset, supporting upside continuation scenarios.
Market Structure & Trend Context (H3)
On the H3 timeframe, XAUUSD remains well-contained within a rising price channel, with structure defined by higher highs and higher lows. The recent impulsive leg confirms continuation within the dominant trend rather than a terminal move.
Key structural observations from the chart:
Price is holding above the ascending trendline, which has acted as dynamic support throughout the advance.
A clean impulsive push above 5,000 followed by shallow pullbacks suggests strong buyer acceptance at higher prices.
The broader Elliott structure remains constructive, with price progressing through higher-wave extensions rather than showing signs of distribution.
Key Technical Zones to Monitor
Several important technical areas stand out:
5,000 – trendline retest zone: A potential area for price to stabilise if a technical pullback develops.
Strong liquidity zone around 4,787: A deeper support area where buy-side liquidity is concentrated, aligned with prior structure.
FVG zone below current price: Represents unfinished business in case volatility increases.
Upper resistance / extension zone near 5,315 (Fibonacci 1.618): A key upside reaction area where price may pause or consolidate before further expansion.
As long as price remains above the trendline and key liquidity supports, the bullish structure remains intact.
Liquidity & Forward Outlook
The breakout above 5,000 opens a new liquidity regime. With limited historical resistance overhead, price is now driven more by liquidity expansion and momentum than by traditional supply zones.
Short-term pullbacks should be viewed in the context of trend continuation rather than reversal, unless there is a clear breakdown in structure. Acceptance above 5,000 would further strengthen the case for continued upside toward higher Fibonacci extensions.
Trading Bias
Primary bias: Bullish continuation while structure holds
Key areas of interest:
Trendline / 5,000 retest zone
4,787 liquidity support
5,315 extension resistance
Preferred timeframe for confirmation: H1–H4
Strong trends rarely move in a straight line. Patience and alignment with structure remain critical in this phase of the market.
Refer to the accompanying chart for a detailed view of trend structure, liquidity zones, and Fibonacci extensions.
Follow the TradingView channel to get early access to structural updates and join the discussion.

GOLD(XAUUSD): Latest Update 23/01/2026 Hello Traders
Yesterday we analysed gold’s price at $4815 and set a target of $4950. Our target has been successfully hit and the price has surpassed $4950. Based on this analysis, we believe the price will likely continue its upward momentum until it reaches around $5000, a critical level for many investors worldwide.
We recommend setting a swing take profit at $5000 and a stop loss based on your risk management strategy. This analysis can also be applied to intraday trading.
If you enjoyed our work, please like and comment. Follow us for more trading setups.
Team Setupsfx_

Riding the XAUUSD Gold MONSTER Trade | What’s Next?In this video, we continue managing our XAUUSD Gold MONSTER trade 🥇💪. We’ve been seeing consistent success with every position we’ve opened recently 📈, and we break down our potential next move. Price is printing clear higher highs and higher lows on the 30-minute chart ⏱️📊, and we’re looking to capitalize on the next swing high and retracement.

XAUUSD Delivered 5100 benchmark!!Gold has successfully reached the $5,100.80/oz target, My 1st Benchmark was 4900 which delivered very early beyond expectations, I started buying and delivered my commentary and setups in advance when price was still trading below 4100
Congratulations to traders who followed the medium-term buying strategy and are now enjoying the rewards of patience and conviction.

Time To BUY Gold(xauusd)XAUUSD (GOLD) was recently in a short term downtrend for a few weeks but has now shown some clear bullish movements ahead. XAUUSD (Gold) has broken out of a downward trend channel that was acting as strong resistance, The price is very likely to head to the next strong resistance level which is marked as the take profit zone (green line). Time to buy gold XAUUSD now.

Jan 27 Gold will FLY another 1,300 pips, watch this pattern! Gold will FLY another 1,300 pips, watch this pattern!
I'm using the M15 timeframe in this analysis to better understand the market structure and patterns.
After the ABCDE correction, a leading diagonal pattern emerged with wave 12345, and there's a possibility of a correction pattern returning.
If you look more closely, you'll also see an inverted HnS pattern. I believe this is a dominant sign indicating a reversal that began this morning during the Asian session. The HnS support line also acts as a significant support line.
As for the price target, it's likely to reach $5200. I'm using Fibonacci expansion and extension levels, and I see an area of contact around 5200-5220.
I see a significant opportunity to buy when the price approaches 5060-5020, which is likely to be touched and has the potential to immediately resume the rally during the NY session in the next 8 hours.

GOLD (XAU/USD) – Bullish Continuation Toward Higher Highs🔍 Technical Analysis (H1):
Market Structure:
Gold remains in a strong bullish structure with clear higher highs & higher lows ✔️, firmly respecting the ascending trendline 📈.
Breakout & Momentum:
Multiple clean breakouts above previous resistance zones confirm strong buying pressure 💪. Each breakout is followed by healthy pullbacks, showing controlled bullish momentum.
POI → Pivot Support:
Previous POI zones have successfully flipped into support 🔄, and price is currently holding above the Pivot Point zone, which strengthens bullish continuation bias 🟢.
Current Price Action:
Price is consolidating above the pivot area, suggesting a brief pause before the next impulsive move higher ⏳➡️⬆️.
🎯 Upside Targets:
Target 1: 5,300 🎯
Target 2: 5,330 🎯🎯
Extended Target: 5,360+ 🚀 (if bullish momentum accelerates)
🛡️ Invalidation / Support to Watch:
Bullish bias remains valid as long as price holds above the Pivot Point zone. A break below may trigger a deeper pullback, not trend reversal ⚠️.
📌 Conclusion:
Overall trend is bullish, structure is healthy, and price action favors a continuation toward the marked target zone after minor consolidation 📦➡️🚀.
✨ Trade with the trend & manage risk wisely! 💼📊

Bullish continuation?Gold (XAU/USD) could fall towards the pivot, then bounce to the 1st resistance.
Pivot: 4,864.86
1st Support: 4,690.83
1st Resistance: 5,111.04
The opinions given above constitute general market commentary and do not constitute the opinion or advice of IC Markets or any form of personal or investment advice.
Any opinions, news, research, analyses, prices, other information, or links to third-party sites contained on this website are provided on an "as-is" basis, are intended to be informative only, and are not advice, a recommendation, research, a record of our trading prices, an offer of, or solicitation for, a transaction in any financial instrument and thus should not be treated as such. The information provided does not involve any specific investment objectives, financial situation, or needs of any specific person who may receive it. Please be aware that past performance is not a reliable indicator of future performance and/or results. Past performance or forward-looking scenarios based upon the reasonable beliefs of the third-party provider are not a guarantee of future performance. Actual results may differ materially from those anticipated in forward-looking or past performance statements. IC Markets makes no representation or warranty and assumes no liability as to the accuracy or completeness of the information provided, nor any loss arising from any investment based on a recommendation, forecast, or any information supplied by any third party

Gold Short Analysis – Bullish Trend & TradeGold remains bullish but corrective on the 1H chart, trading within a rising channel. Price has reacted from the 4960-4980 demand zone and is attempting to hold above the trendline support. As long as this zone holds the overall structure favors continuation higher though a brief pullback or consolidation is still possible before the next leg up.
Trade Plan:
Buy Zone: 4980 – 4960
Buy Trigger: Bullish rejection from the buy zone or a strong 1H/4H close above 5100
Targets: 5,100 → 5,165 → 5,210
Invalidation: Sustained break and close below 4,940
Fundamentally gold is supported by geopolitical uncertainty expectations of a more accommodative Fed stance and ongoing pressure on the US dollar and real yields. Any risk-off sentiment or weaker US data can further fuel upside while only a sharp USD rebound or hawkish surprises may slow the bullish momentum.
Note
Please risk management in trading is a Key so use your money accordingly. If you like the idea then please like and boost. Thank you and Good Luck!

XAUUSD GOLD Monster Trade Idea - Beware The $5000 TrapXAUUSD 🌍 The macro narrative heading into this week is dominated by safe-haven flows as geopolitical tensions—specifically the US-Europe tariff threats over Greenland and Middle East instability—drive capital into Gold 🏦. We are seeing a classic Risk-Off sentiment where dips are being aggressively bought by institutions and central banks eyeing the psychological $5,000 level.
We are seeing a Bullish Market Structure on the H1/H4 📈, but I'm looking for a correction.
Key Zone: The confluence of the channel's lower boundary and the Fibonacci 50% - 61.8% Retracement zone ($4,982 - $5,007) is the critical "Buy Zone" 📉. This area represents deep value in a strong uptrend.
We are currently trading near the top of this corrective channel. I am watching for a "Judas Swing" or a stop-hunt lower into that 61.8% Fib level to sweep early buyers before the real expansion leg kicks in 🧹. If price respects the $4,982 region, it confirms the structural integrity of this bullish flag.

XAUUSD - Long Entries Targeting Continuation Higher HighsPrice is in a strong uptrend inside an ascending channel, so bias is bullish toward higher levels around 5,200–5,300. The idea is to wait for a pullback into the marked demand/support zone near the lower channel line and then look for long entries rather than selling.

Gold Technical Outlook - Gold Buy Setup Targeting 5400Gold remains bullish after holding above the rising support line with a clear BOS confirming continuation strength. Price has broken and held above the 5275 showing strong buyer control. As long as gold stays above the 5110-5050 demand zone the upside structure remains valid with room for further extension toward high 5400+. only a decisive H4 close below 5110-5050 zone would signal deeper correction.
Fundamentally gold is supported by expectations of easier monetary policy later in 2026. Ongoing geopolitical tensions steady central bank gold buying and uncertainty around global growth continue to boost safe haven demand.
Any short term USD strength may cause pullbacks but overall fundamentals still favor gold on dips rather than aggressive selling.
Trade Plan
Buy Zone: 5200 – 5150
Buy Trigger: Strong bullish close above 5275 with continuation
Targets: 5275 → 5402 → 5455
Invalidation: H4 close below rising support
Note
Please risk management in trading is a Key so use your money accordingly. If you like the idea then please like and boost. Thank you and Good Luck!

Gold Pullback or Extension? Smart Money Sets the Trap Near HighsXAUUSD | Daily Smart Money Plan – H1
Gold keeps its bullish structure intact after a strong impulsive leg, but the current price action shows hesitation just below the recent highs. After a clean BOS and aggressive expansion, price is now trading in premium, where buy-side liquidity has already been delivered. The chart suggests Smart Money is no longer chasing higher prices, but managing positions through rotation.
Macro backdrop today remains hot:
Markets are digesting fresh volatility around U.S. data expectations, shifting Fed rate-cut timing, and persistent geopolitical tension. These factors continue to support gold as a safe haven, but intraday execution shows rebalancing behavior, not blind continuation. Headlines may move price fast — liquidity decides where it settles.
Rather than exploding higher, price pulled back from the highs and left a clear imbalance (FVG) below, signaling unfinished business before any sustained continuation.
Market Structure & Liquidity Context
Higher-timeframe bias remains bullish
Strong bullish BOS confirms trend strength
Short-term pullback forms after liquidity delivery at highs
Clear H1 imbalance + buy zone below current price
Market logic favors premium → discount → continuation
➡️ News creates volatility, but Smart Money seeks efficiency
Key Trading Scenarios
🔴 Sell Reaction at Premium (Short-term rotation)
Zone: 5,265 – 5,275
SL: Above 5,300
Confluence:
Buy-side liquidity already tapped
Momentum slows near highs
Rejection here favors a dip into imbalance before continuation
🟢 Buy Reaction at Discount (Primary Long Setup)
Zone: 5,170 – 5,168
SL: 5,160
Confluence:
H1 imbalance mitigation
Prior structure support
Ideal Smart Money reload zone after pullback
🟢 Continuation Target
Upside Objective: 5,300 – 5,310
Next external liquidity pool
Target only valid after discount reaction + confirmation
Invalidation
Strong H1 acceptance above 5,300 without mitigation
Would signal direct continuation, skipping deeper rebalance
Expectation & Bias
This is not a FOMO breakout environment
Liquidity comes before direction
Rejection = rotation
Acceptance = continuation
Execution > Prediction
💬 Will gold respect the H1 imbalance near 5,170 before attacking 5,300 — or will Smart Money surprise with direct acceptance at the highs?

Gold prices hit a record high ahead of the interest rate decisio1️⃣ Trendline
Price is moving clearly within an ascending channel.
The Higher High – Higher Low structure remains intact → the main trend is still BULLISH.
The most recent strong rally was a breakout from a consolidation zone, confirming that buyers are in control.
2️⃣ Resistance
🔵 5,278 – 5,280 (Strong Resistance Zone)
Confluence of: channel top + previous supply zone + trendline + Fibonacci level.
Profit-taking and short-term pullbacks are likely to appear here.
To confirm further upside → price needs a clear breakout and candle close above this zone.
3️⃣ Support
🟢 5,200 (Near-term Support)
The most recent breakout area → first technical support.
If price pulls back and holds here, the uptrend remains valid.
🟢 5,105 (Strong Support)
Recent structural low + lower boundary of the ascending channel.
If price drops deeper into this area and shows a buying reaction → potential continuation of the medium-term uptrend.
4️⃣ Main Scenario
✔ The trend still favors buying the dip while price holds above 5,200.
✔ A strong break above 5,280 → opens room for further upside within the channel.
⚠ A break below 5,105 → warns of a short-term structure breakdown and a deeper correction.
📌 Trading Plan
BUY GOLD: 5,200 – 5,202
Stop Loss: 5,190
Take Profit: 100 – 300 – 500 pips
SELL GOLD: 5,278 – 5,280
Stop Loss: 5,288
Take Profit: 100 – 300 – 500 pips

Gold Bullish Outlook - Buy Zone & 5200 TargetGold remains in a clear bullish market structure. Price is trading well above the rising long term trendline and has already confirmed multiple Break of Structure showing strong institutional buying interest. After the impulsive rally from the 4550-4620 base price paused briefly in consolidation and then expanded higher validating the continuation trend rather than a distribution phase.
Currently gold is undergoing a healthy corrective pullback after testing the resistance near 5094. The pullback is aligning perfectly with the premium discount zone where the 4840-4760 overlaps with previous structure support and trendline confluence. This strongly suggests the move is corrective not a trend reversal.
As long as price holds above 4760 the bullish structure remains intact and this pullback should be treated as a buy the dip opportunity. A strong bullish rejection from the buy zone or a confirmed 4H close back above 4970 would signal continuation toward higher targets.
From a fundamental perspective gold continues to be supported by persistent geopolitical risks global economic uncertainty and expectations of looser US monetary policy going forward. The market is increasingly pricing in slower US growth which keeps real yields under pressure and limits USD strength both positive for gold.
Additionally ongoing central bank gold accumulation and safe-haven demand further strengthen the upside bias. Unless we see a surprise hawkish shift from the Federal Reserve or a sharp USD rebound downside moves in gold are likely to remain corrective and short lived.
Trade Plan:
Buy Zone: 4840 – 4800
Buy Trigger: Bullish rejection from the buy zone or a strong 4H close above 4970
Targets: 5095 → 5172 → 5200
Invalidation: Sustained 4H close below 4760
Note
Please risk management in trading is a Key so use your money accordingly. If you like the idea then please like and boost. Thank you and Good Luck!

GOLD (XAU/USD) – FINAL GRAND CYCLE ANALYSIS🟡 GOLD (XAU/USD) – FINAL GRAND CYCLE ANALYSIS
“The Rise of Real Money in a Failing Fiat World”
Elliott Waves | Fibonacci | Smart Money | Macro Fundamentals | Market Psychology
📅 Date: October 22, 2025
📍 Current Price: ~$4,039/oz
⏳ Time Horizon: 1970s to post-2050
🎯 Focus: Multi-decade Elliott Wave structure signaling the endgame for fiat currencies
🌐 SUPER CYCLE NARRATIVE – GOLD’S MONETARY METAMORPHOSIS
🔵 Wave I (1971–1980): The Rebirth of Real Money
Gold's first major secular rally began when the Bretton Woods system collapsed and President Nixon ended the U.S. dollar’s convertibility to gold in 1971. Gold soared from around $35 to nearly $875 by 1980. This wave was driven by runaway inflation, the oil embargo, and shattered confidence in fiat money.
🔴 Wave II (1980–1999): The Great Fiat Illusion
Following the 1980 peak, gold entered a brutal 19-year corrective phase, falling to the $250 zone. During this time, the U.S. dollar gained strength, Volcker’s interest rate hikes reined in inflation, and a new era of debt-based prosperity and stock market euphoria unfolded. Gold was dismissed, even by central banks who sold reserves. Structurally, this corrective phase formed a complex WXYXZ pattern , setting the groundwork for the massive Wave III rally.
🟢 Wave III (1999–~2033): The Fiat Reckoning Has Begun
This is the longest and most powerful supercycle wave and the one we are currently in. It is subdivided into five impulsive macro waves. As of now, gold is deep within Wave iii of III , the most explosive phase of the entire structure. The current rally is no longer driven by inflation fears but by existential doubts about the long-term viability of fiat currencies.
📈 Wave I of III (1999–2011): The Institutional Accumulation
Gold rose from around $250 to $1,920 over this period. Triggers included the dot-com bust, 9/11, the 2008 global financial crisis, and the launch of the first gold ETFs like GLD. This wave marked the beginning of institutional interest in gold as a systemic hedge.
📉 Wave II of III (2011–2015): The Disbelief Correction
Gold corrected nearly 45%, bottoming near $1,050. The narrative shifted — QE hadn't caused hyperinflation, the stock market was booming again, and faith in the dollar resurged. Retail abandoned gold, but institutional buyers quietly accumulated from newly created demand zones.
🚀 Wave iii of III (2015–~2026): The True Price Discovery Phase
This is where we are now. Since 2015, gold has exploded upward, driven by COVID-era QE, negative real interest rates, geopolitical instability, and major central banks accumulating gold for cross-border settlements outside the dollar system.
We are currently in the middle of this wave — micro wave (3) of iii — with price around $4,039. According to Fibonacci projections, this wave is expected to peak near $6,552 , corresponding to the 2.618 extension level . If bullish momentum continues, gold could overshoot toward $22,744 , matching the 3.618 Fibonacci extension and marking the likely top of macro Wave III.
In an extreme scenario where fiat trust collapses entirely, the 4.618 extension projects a possible target of $78,940 . All of these levels align with the upper bounds of the long-term logarithmic channel, validating both structure and projections. But most likely this target is for Wave V TOP .
🟣 Wave IV (Projected: 2026–2033): The Great Shakeout
After the parabolic run of Wave iii, a deep multi-year correction is likely. This correction — Wave IV — may retrace toward the long-term red trendline and could coincide with a temporary return to “faith” in fiat through reforms like CBDC rollouts or aggressive fiscal pivots.
This wave could resemble a WXY pattern or large ABC structure and may unfold alongside capital controls, deflationary pressure, and a resurgent tech or dollar narrative. However, this will likely be the last major buying opportunity before gold enters its final, euphoric revaluation.
🟢 Wave V (2033–2045+): The Final Blow-Off Top
Wave V is expected to be driven by an overt crisis of confidence in the global fiat system. Scenarios could include:
Mass adoption of gold-backed or commodity-tied digital currencies
Loss of global trust in the USD as the reserve currency
BRICS or emerging alliances introducing gold into cross-border settlements
Global central banks returning to physical gold as a monetary base
The upside potential here is monumental. The 4.618 Fibonacci extension already targets $78,940 , but under full systemic collapse or monetary reset conditions, gold could reprice toward $100,000–$250,000 per ounce — not as a bubble, but as a return to its role as sound, base-layer money.
📐 Fibonacci Milestones and Structure Alignment
Each major wave has closely respected its corresponding Fibonacci extension. Wave I topped around the 1.618 level ($1,887) . The ongoing Wave iii appears on track to reach the 2.618 level ($6,552) . From there, macro Wave III could stretch toward 3.618 ($22,744) . If Wave V extends fully, a 4.618 projection leads to $78,940 — all within the bounds of the established logarithmic trend channel. In a full-blown systemic reset, price could break even higher.
These levels are not speculative but grounded in structural alignment with Elliott wave geometry , Fibonacci mathematic s, and long-term institutional order flow .
🧠 Smart Money Concepts & Technical Validations
Smart money activity has left clear fingerprints across this cycle. Each break of market structure (in 2016, 2020, and 2023) confirmed higher time-frame bullish continuation. Institutional demand zones — especially during the 2018–2019 consolidation and 2022 pullback — were respected to the dollar.
This cycle isn’t retail-driven mania — it's a stealth institutional accumulation that’s now evolving into price discovery.
📊 Market Psychology Across the Cycle
Investor sentiment has followed classic psychology stages:
From 1999 to 2004, disbelief reigned: “Gold is dead.”
Between 2005 and 2011 came growing awareness: “Gold might work again.”
The 2011–2015 correction brought denial: “It was just a bubble.”
Hope returned in 2016–2020 as price quietly rallied.
From 2022 to 2026, euphoria dominates: “Gold will never go down.”
Wave IV will likely bring fear and capitulation between 2026 and 2033.
Finally, Wave V will ignite mania: “Gold to the moon!”
🚨 Final Synthesis: What This All Means
We are living through the largest repricing of monetary value in modern financial history. Gold is no longer just an inflation hedge — it’s becoming a hedge against the system itself . The structure on the chart doesn't just map price — it maps the collapse of fiat trust and the return of monetary sanity.
Gold is transitioning from:
A commodity hedge →
To a central bank hedge →
To a currency hedge →
And finally, to a system hedge
The current leg — Wave iii of III — is nearing its climax. After a correction in Wave IV, Wave V could take gold into previously unthinkable territory, not because gold changed — but because everything else did.
📌 Final Position Summary
We are currently in wave (5) of iii of III — the most powerful segment of the bull run
The next Fibonacci target is $6,552
The broader Wave III could peak near $22,744
After a correction (Wave IV), the final wave could send gold toward $78,940 , or even into the $100,000–$250,000 zone under extreme monetary reset conditions
This is not a mere forecast — it’s a macro-monetary blueprint for the coming decades.
🌊 "Those who understand the waves will ride them. Those who don’t will be swallowed by the tide." – FIBCOS
📘 Disclaimer: This is an educational market outlook based on technical and macroeconomic structure. It is not financial advice. Always do your own due diligence and risk management.
#XAUUSD #Gold #GoldAnalysis #ElliottWave #Fibonacci #SmartMoneyConcepts #PriceAction #TechnicalAnalysis #MarketStructure #Commodities #InflationHedge #MacroEconomics #CentralBanks #BRICS #MonetaryReset

GOLD, one another bullish impulse?subsequent to setting new ath on Monday's London session, Gold went into a consolidation. however accumulating both sell-side and buy-side liquidity. Tuesday's Asian session opened with a movement towards the sell side liquidity. There is clearly still Buyside resting above Monday's High and that entire range. The market seems very good to be going long in the short term, however, longer term direction is still uncertain and there is a possibility it could plumet as a correction. good opportunity to get a 1:1 if you go long now.

Will gold prices return to a liquid state and continue to rise? 📈 1️⃣ Trendline
Primary Trend: BULLISH
Price is moving within a medium-term ascending channel
Market structure continues to form Higher Highs – Higher Lows
The recent decline is only a technical pullback to the rising trendline
No structural breakdown → no confirmed reversal
➡️ The lower trendline is currently acting as dynamic support
🟦 2️⃣ Support Zones
🔹 4,996 – 4,994 → Near-term support
Confluence of ascending trendline + recent demand zone
If price reacts positively here → high probability of bullish continuation
🔹 4,974 – 4,976 → Stronger support + structure retest
Aligns with Fibonacci level + previous structural low
A break below this zone would signal weakening bullish momentum
🟥 3️⃣ Resistance Zones
🔸 5,109 – 5,111 → Near-term resistance / recent high
Price has reacted multiple times at this level
A clear breakout and close above is needed to confirm bullish continuation
🔸 5,148 – 5,150 → Major resistance / supply zone
Next upside target if breakout occurs
Strong profit-taking pressure may appear here
🎯 Trading Plan
🟢 BUY GOLD: 4,996 – 4,994
Stop Loss: 4,989
Take Profit Targets: +100 / +300 / +500 pips
🔴 SELL GOLD: 5,148 – 5,150
Stop Loss: 5,155
Take Profit Targets: +100 / +300 / +500 pips

XAUUSD - Post London Session, Pre New York (Jan 26)Gold finally broke above 5000 this morning.
Asia session:
Price opened with a gap up into 5015 and continued higher, pushing into 5092 to form the Asia high before pulling back into the 5050 support area.
London session:
Price broke above the Asia high and extended into 5111, but was rejected and fell back below. Since then, it has been ranging between 5075 and 5096.
Heading into New York, here’s what I’m watching:
• A clean break and close above 5097 would open the door toward the 5115 area.
• A break and close below 5078 would shift focus to the 5055–5058 support zone.
• Momentum remains strongly bullish, but there are large gaps and price is extended, so patience and confirmation are key.
• A loss of the 5055–5058 area would expose the 5030 support next.
Let price come to the levels. No rush, no FOMO - clean structure first.

Gold Spot / XAUUSDKey Price Drivers for GOLD
Safe-haven demand due to geopolitical and macro stress.
Weakening dollar and strong physical demand premiums.
Gold prices were predominantly higher over the last week, with record-high spot levels globally and higher domestic Indian gold rates by week’s end, reflecting strong investor demand.
Gold continues its strong upward momentum, trading above $5,000/oz through much of the week and setting historic highs near ~$5,100/oz
Any close above 5133 (Close above in 4H chart) then more bullish bias is expected.
Like & Share

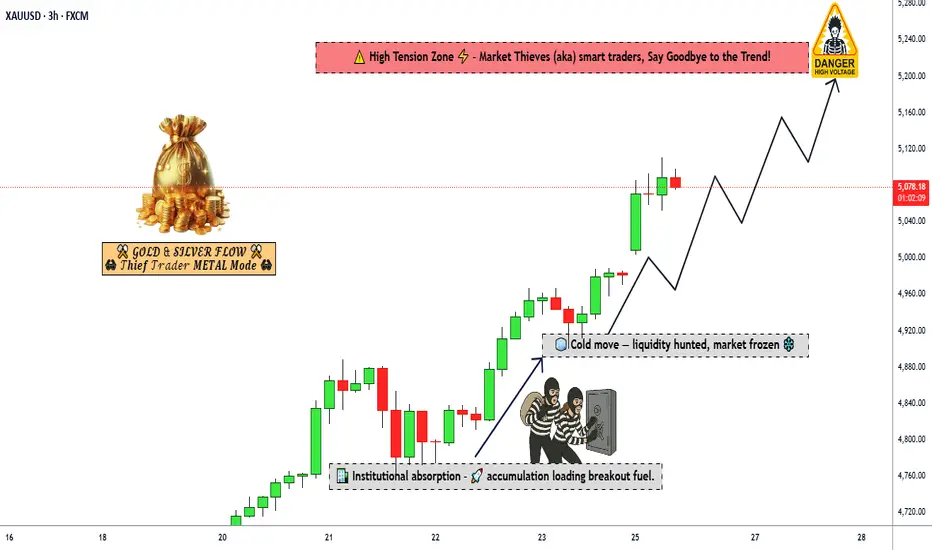
XAU/USD → High-Probability Bullish Trade Framework🔥 XAU/USD Bullish Blueprint
Gold vs U.S. Dollar | Metals Market Opportunity (Day / Swing)
⚡ Smart Money Flow • Macro-Driven • Liquidity-Aware Setup
📈 Market Bias
Bullish Continuation Plan
Gold remains supported by macro uncertainty, USD sensitivity, and defensive flows. Structure favors upside continuation while respecting major trap zones.
🎯 Trade Framework
Asset: XAU/USD (Gold vs U.S. Dollar)
Plan: 📊 Bullish
Entry: Any price level (scaling / dynamic positioning allowed)
Target Zone:
🚧 HIGH-VOLTAGE SHOCK FENCE GATE @ 5200
▪ Strong resistance
▪ Overbought conditions
▪ Profit-taking & liquidity trap zone
👉 Escape with profits near this zone
Stop Loss (Thief SL): ❌ 4960 (nearest structural low)
⚠️ Risk Disclaimer (Read Carefully)
🧠 Dear Ladies & Gentlemen (Thief OG’s)
I do NOT recommend blindly using only my TP or SL.
Risk management is your responsibility — secure profits and manage losses based on your own strategy and risk appetite.
🔗 Related Pairs to Watch (Correlation Watchlist)
💵 USD-Driven Instruments
DXY (U.S. Dollar Index):
▪ Weak DXY = fuel for Gold upside
USD/JPY:
▪ Rising USD/JPY often pressures Gold
EUR/USD:
▪ Strength here usually supports XAU/USD
Metals Correlation
XAG/USD (Silver):
▪ Confirmation metal — strength supports Gold continuation
📉 Yields & Risk Sentiment
US10Y Treasury Yield:
▪ Falling yields = bullish Gold
S&P 500 / NASDAQ:
▪ Risk-off sentiment supports safe-haven demand
🧠 Fundamental & Economic Factors to Monitor
📡 Use live market feeds & economic calendars while trading
🔔 High-Impact Drivers
Federal Reserve Interest Rate Outlook
US Inflation Data (CPI / PCE)
US Employment Reports (NFP, Unemployment Rate)
Central Bank Speeches (Fed Officials)
Geopolitical Tensions & Global Risk Events
📌 Key Insight:
Hawkish Fed tone → short-term pressure on Gold
Dovish signals / slowing inflation → bullish continuation
Risk-off headlines → instant volatility spikes in XAU/USD
🧲 Smart Money Notes
Watch for liquidity sweeps near resistance
Avoid chasing at extremes
Let price come to your level — patience pays 💎
💬 Final Thought
Gold doesn’t move randomly — it reacts to liquidity, fear, and money flow.
Trade smart. Protect capital. Take profits like a pro 🥷📊
👍 Like | 💬 Comment | 🔁 Share
If this blueprint helps your bias, support the idea — more precision setups coming.