Gold surges strongly after Fed decision – eyes on 4000+ breakout1. Market Movements
After the Federal Reserve cut interest rates by 0.25% and signaled a potential end to quantitative tightening (QT), gold extended its strong upward momentum.
Institutional and ETF buying continues to drive prices higher, with gold now testing the key psychological level at $4000/oz.
2. Technical Analysis
• Near-term Support: $3960 – $3970
• Deeper Support: $3935 – $3940 (pre-Fed accumulation zone & H4 EMA50)
• Immediate Resistance: $3988 – $4000
• Extended Resistance: $4025 – $4040 (mid-October technical high)
• Momentum: Both EMA20 and EMA50 on H1 and H4 are sloping upward, confirming strong bullish momentum. RSI remains elevated (70–75), signaling overbought but still strong trend conditions.
• Volume: Continues to rise steadily, showing sustained institutional inflows. However, short-term correction risks remain near $4000 due to overextension.
3. Outlook
The overall trend remains bullish, but caution is advised as gold approaches the $4000–$4040 resistance zone — a potential area of strong profit-taking.
If gold fails to break above $4040 decisively, a short-term pullback toward $3970 or $3940 is likely.
4. Suggested Trading Plan
🔺 BUY XAU/USD
Entry: $3925 – $3928
🎯 TP: 40 / 80 / 200 pips
🛑 SL: $3922
🔻 SELL XAU/USD
Entry: $4037 – $4040
🎯 TP: 40 / 80 / 200 pips
🛑 SL: $4043
Goldlong

Gold: Trending downwards, 3980 is key.#XAUUSD TVC:GOLD OANDA:XAUUSD
In the short term, gold is still digesting the hawkish impact of Powell's speech, and selling pressure remains heavy.
From a technical perspective, yesterday's daily candlestick closed with a long upper shadow. The 4030 level has proven to be a strong resistance level for gold prices, while the daily MA5 moving average has continued to cross below the MA10 moving average, making 3980-3990 a key short-term resistance level. Only by breaking through this key resistance range can gold prices potentially test higher levels further. Otherwise, the market will remain in a weak and volatile state in the short term.
On the support side, pay close attention to the double bottom support level formed on the hourly chart at 3920-3915.
If this range is breached, gold prices may experience an accelerated decline, further testing 3880 or even 3850.
Therefore, in the short term, European trading can try to short gold with a small position when the price rebounds to 3980-3990. The first target can be 3960-3950, and if the price falls sharply, the next target is 3920-3915.

Gold /XAUUSD long🎯 Idea Summary:
· Direction: Long
· Instrument: XAUUSD (Spot Gold)
· Primary Timeframe: 4H
· Bias: Bullish (Counter-trend bounce)
📊 Technical Rationale:
· Market Structure: The longer-term trend is still bullish, but price has corrected into a major support zone. Looking for a bounce.
· Key Levels:
· Support: $2315** (Previous Resistance), **$2300 (Major Psychological & Swing Low)
· Resistance: $2340** (Recent Swing High), **$2355 (21 EMA)
· Price Action / Pattern: Price is approaching the $2315 support. Watching for a bullish reversal candle (like a hammer or bullish engulfing) for a confirmation signal.
· Confluence:
· The $2315 level coincides with the 61.8% Fibonacci retracement of the last major up-move.
· RSI is entering oversold territory (<30), suggesting selling pressure may be exhausting.
⚙️ Trade Setup:
· Entry Zone: $2315 - $2320 (On a bullish confirmation candle)
· Stop Loss: $2305 (Just below the key $2300 psychological level and the Fib level)
· Take Profit Targets:
· TP1: $2340 (First resistance, take 50% off)
· TP2: $2350 (21 EMA & next resistance)
· Risk-Reward Ratio: ~1:2.5
💡 Narrative / Fundamental Context:
This is a mean-reversion play within a bull market.The confluence of a major Fibonacci level, prior support, and oversold RSI creates a high-probability zone for a technical bounce. A break below $2300 would signal a much deeper correction is likely.
Disclaimer: This is my personal analysis and not financial advice. Trading commodities like gold carries a high level of risk. Always do your own research (DYOR) and manage your risk appropriately.

GOLD REVERSAL Hello! Been on a holiday and am back.
Here is a swing trade on GOLD after a good fall and retracement. Gold has made a hammer on the daily timeframe. One can look for a reversal from here.
Entry- 119000-118800
Target- 120500, 121000, 121700
STOP- The low of hammer candle.
Note- You may enter as close as the low of the hammer candle.
Disclaimer- This is just for educational purpose
Jai Shree Ram.

Gold peaks once the Fed's cutting cycle is over...As the cutting cycle ends and rates remain relatively low, that is when the gold price tends to peak. This suggests that we are not yet near a gold price top, as the cutting cycle has not been ended by Chairman Powell. With poor economy or jobs data, or via a dovish Trump candidate for Fed Chair next year, rates will drop further. History tells us that once the cutting is over, the gold price will stall.

Watch for support at 3990-3980 to consider going long on gold.#XAUUSD TVC:GOLD OANDA:XAUUSD
Gold prices have repeatedly tested the 4030 level without a successful breakout. Gold has now begun to decline, with short-term bears gradually releasing their momentum. Further downside is expected, with support expected in the 3990-3980 range. If gold prices can pull back to this range in the short term, we can consider going long on gold in anticipation of a rebound. Target range: 4030-4050
Gold climbs above $4030, bullish momentum remains strong📊 Market Overview:
Gold extended its gains to around $4030, supported by a weaker USD and stronger safe-haven demand. After consolidating between $4015–$4020, buyers regained control, pushing the price higher toward short-term resistance.
📉 Technical Analysis:
• Key Resistance: $4035 – $4050
• Nearest Support: $4018 – $4022
• EMA: Price remains above the 9-EMA, confirming a short-term bullish trend.
• Candle / Momentum: Momentum is still positive on the H1 chart, showing solid buying pressure with no clear reversal signs.
📌 Outlook:
Gold may continue to rise if it stays above $4018, targeting $4045 – $4052 in the short term. However, if a rejection candle appears near $4035–$4040, a technical pullback toward $4020 could occur.
💡 Trading Plan:
🔺 BUY XAU/USD
Entry: $4024 – $4028
🎯 TP: 40 / 80 / 200 pips
🛑 SL: $4018

Gold Bullish Butterfly Forming – Reversal Ahead?As I expected in the previous idea , Gold started declining from the Resistance zone($4,192 – $4,137) and has now reached the Support zone($4,004 – $3,895) — full target achieved .
At the moment, Gold is moving within that Support zone($4,004 – $3,895) and Potential Reversal Zone(PRZ) .
Looking at the 1-hour time frame , we can spot a Bullish Butterfly Harmonic Pattern forming, which is likely to complete right in that PRZ .
I expect that in the coming hours, once Gold enters the PRZ , it could rise at least up to around $4,057(First Target) .
Second Target: $4,132
Stop Loss(SL): $3,889(Worst)
Please respect each other's ideas and express them politely if you agree or disagree.
Gold Analyze (XAUUSD), 1-hour time frame.
Be sure to follow the updated ideas.
Do not forget to put a Stop loss for your positions (For every position you want to open).
Please follow your strategy; this is just my idea, and I will gladly see your ideas in this post.
Please do not forget the ✅ ' like ' ✅ button 🙏😊 & Share it with your friends; thanks, and Trade safe.

Gold (XAU/USD) 4H Chart Analysis – Short-Term Reversal from ?Technical Overview:
Gold has recently rebounded from a High Demand Zone around the $3,900–$3,910 region, showing clear signs of buyer re-entry after a prolonged bearish correction. The candle structure suggests strong bullish intent, with higher lows forming and a potential continuation toward the next liquidity area.
Key Observations:
🔹 High Demand Zone: Price reacted strongly here, indicating institutional buying pressure.
🔹 High Prop POI (Point of Interest): Served as a key accumulation level before the breakout.
🔹 SMC Trap: Indicates a prior liquidity grab, trapping late sellers before the move up.
🔹 Bullish Momentum Building: Consecutive bullish candles after rejection from the demand zone strengthen the reversal bias.
Target Projection:
🎯 Immediate Target: $4,080 – $4,100 (aligned with local resistance and liquidity grab zone).
🛑 Support: $3,905 (must hold to maintain bullish structure).
💎 Extended Target (if momentum continues): $4,160 – $4,180 (previous major swing high zone).
Summary:
Gold is showing a short-term recovery phase within a broader bullish structure. A confirmed 4H close above $4,030 would likely propel price toward the $4,100 region, while a drop below $3,900 would invalidate the bullish setup.
📊 Suggested Title:
"Gold Rebounds from Key Demand Zone, Eyes $4,100 Resistance 🔥"

Gold’s New Game — Higher Highs Again!In my view, gold has completed its correction from the previous rally and is now preparing to renew its all-time high.
On the chart, I’ve marked a 5-wave structure, which I believe represents the first wave of a much larger 5-wave sequence.
This suggests we could see gold far above $4600.
Honestly, I can’t even imagine how high it could go — or what might drive that kind of move.
It’s insane.

Beyond the Chart - GOLD Market Technicals & FundamentalsOANDA:XAUUSD Long Bias & Smart Money Flow
Price tapped right into my mid-FVG zone and bounced clean textbook demand reaction.
Buyers stepped in heavy, volatility’s still alive but controlled just how we like it before the next leg.
Lower FVGs acted as accumulation, and now price is pushing toward the 4,045–4,060 zone where liquidity’s sitting pretty.
As long as we stay above the 4,015 support base, gold’s got room to keep running.
🎯 Targets: 4,045 → 4,080
❌ Invalidation: Break below 3,985 and close under the reclaimed FVG
No luck, just precision⚡

technical analysis of your provided XAU/USD (GoldTimeframe: 15 minutes
Current Price: $3,963.81
Trend Structure: Price recently broke out from a descending channel.
Key Levels:
Support Zone: $3,920 – $3,940
Immediate Resistance: $3,980
Target Zone: $4,142
📉 Technical Breakdown
Descending Channel Breakout
The chart shows gold had been moving in a clear downward channel.
The recent candles show attempts to break above the upper trendline, suggesting potential bullish momentum building up.
Support Level
A strong demand zone is visible around $3,920 – $3,940.
This zone has been marked as a possible retest area before continuation to the upside.
Price Projection
The chart projects a bullish scenario, where price may retrace slightly to support before targeting the $4,142.60 level.
This suggests a swing-buy setup, with confirmation depending on a strong bounce from the support level.
Market Structure
The formation of higher lows near the lower boundary of the channel signals momentum reversal.
A confirmed breakout with volume above $3,980 will lik TVC:GR10Y TVC:GR02Y EURONEXT:PSI1! EURONEXT:EV6X2025 EURONEXT:GE8Z2025 EURONEXT:PO6X2025 ely validate the bullish continuation.
🎯 Trading Plan Suggestion (Analytical View)
Buy Zone: $3,940 – $3,950 (after confirmation candle)
Take Profit Target: $4,142
Stop Loss: Below $3,915 (to protect against false breakout)
⚠️ Notes
Watch for price rejection near $3,980, as it could form temporary consolidation. EURONEXT:PO6X2025 EURONEXT:SNAX2025 EURONEXT:EV8Z2025 EURONEXT:PSI1! EURONEXT:XA8Z2025 EURONEXT:XA6X2025 EURONEXT:PO8Z2025
If price closes below $3,920, bearish momentum may resume.

ANFIBO | XAUUSD - Bullish Head & Shoulder [10.29.2025]Hi traders, Anfibo's back!
XAUUSD Analysis – Daily Trading Plan
Overall Picture:
OANDA:XAUUSD recently reached a new ATH near $4,400/oz, before undergoing a healthy correction back to the $3,890 support level following an exceptionally strong rally fueled by geopolitical tensions. After this retracement, gold is now consolidating around the $4,000 zone, showing signs of breaking above the descending trendline on the H1 timeframe — a signal that short-term bullish momentum may be reemerging.
From a structural standpoint, this pullback appears to be part of a technical correction within an ongoing uptrend, not a trend reversal. Currently, the market is stabilizing and setting up for a potential new wave upward. I’m personally watching for a Head & Shoulders (H&S) formation to develop — this could offer optimal Buy and Sell opportunities depending on which neckline breaks first.
I still believe gold is likely to revisit the $4,200 area soon , as long as the $3,890 support holds firm and global risk sentiment continues to favor safe-haven assets.
Trading Plan for Today:
>>> SELL ZONE:
ENTRY: 4135 - 4150
SL: 4165
TP: 4045 - 4010 - 4000
>>> BUY ZONE:
ENTRY: 4000 - 4010
SL: 3990
TP: 4135 - 4150 - 4200
Risk Management:
- Prioritize Buy setups following the higher-timeframe trend; Sell only for intraday scalps.
- Maintain a minimum Risk:Reward ratio of 1:2.
- Avoid entries during major geopolitical or economic announcements.
- Monitor the Head & Shoulders pattern closely — confirmation will guide the next major move.
Conclusion:
Gold has completed a healthy correction after its parabolic surge to $4,400, and the market is now regrouping around the $4,000 zone, with early signs of renewed bullish momentum. As long as $3,890 remains intact, the broader trend remains bullish, and I expect a potential rebound toward $4,200 in the near term.
Patience and precision are key here — waiting for the Head & Shoulders formation to confirm will provide the best entry signals for both sides of the market. Until then, the bias remains bullish with a short-term recovery underway.
GOODLUCK, LOVE U GUYS!


LiamTrading - XAUUSD: Dual Strategy Ahead of FOMCLiamTrading - XAUUSD: Dual Strategy Ahead of FOMC - Prioritise Buying the Retracement at $3914
Hello trading community,
Following a significant sell-off, Gold is showing signs of a slight uplift, forming an upward structure. We continue to prioritise buying the recovery, viewing this as an intermediate correction within the larger downtrend. High volatility is imminent as the FOMC decision approaches.
📰 MACRO CONTEXT & FUNDAMENTAL FLOW
The market is displaying clear hesitation before the FED announcement:
Technical Recovery 🟢: Gold reversed its decline during Asian trading, recovering slightly from a three-week low as traders anticipate the FOMC interest rate decision.
Headwinds 🔴: Despite the recovery, optimism over US-China trade and a slight lift in the USD are acting as a barrier, limiting further buying momentum.
📊 TECHNICAL ANALYSIS & ACTION PLAN
Based on the current market structure, the strategy involves trading high-probability liquidity zones:
🟢 Primary BUY Recovery Scenario (BUY Primary)
We are looking for price to test the crucial Buy zone Liquidity to initiate the recovery wave.
Entry Zone (BUY): $3914
Stop Loss (SL): $3906 (Tight SL required)
Take Profit (TP): TP1: $3933 | TP2: $3956
🔴 SELL Continuation Scenario (SELL Retest/Scalping)
Using the broken trend area for short-term selling opportunities:
Entry Zone (SELL): $4048
Stop Loss (SL): $4056
Take Profit (TP): TP1: $4035 | TP2: $4022
SUMMARY & DISCIPLINE (Liam's Note)
Gold is in a decision zone. This is the time to apply a disciplined strategy: only enter at identified liquidity areas, and Always adhere to your Stop Loss (SL). Capital management is the number one priority before the FOMC event.
Wishing all traders a successful and disciplined trading session!

Gold price recovers - resistance zone 4000⭐️GOLDEN INFORMATION:
Gold (XAU/USD) bounces from an Asian session low near $3,916, edging away from a three-week trough hit on Monday. The metal’s pullback from record highs appears to pause, though gains remain limited as traders await the Fed’s policy decision, with a rate cut widely expected on Wednesday.
⭐️Personal comments NOVA:
Gold prices are recovering, as the market is looking forward to today's FED interest rate cut, regaining the 4000 mark.
⭐️SET UP GOLD PRICE:
🔥SELL GOLD zone: 4050 - 4052 SL 4057
TP1: $4040
TP2: $4030
TP3: $4020
🔥BUY GOLD zone: 3886 - 3884 SL 3879
TP1: $3900
TP2: $3910
TP3: $3925
⭐️Technical analysis:
Based on technical indicators EMA 34, EMA89 and support resistance areas to set up a reasonable BUY order.
⭐️NOTE:
Note: Nova wishes traders to manage their capital well
- take the number of lots that match your capital
- Takeprofit equal to 4-6% of capital account
- Stoplose equal to 2-3% of capital account

Why am I bearish when the market is bullish?#XAUUSD TVC:GOLD OANDA:XAUUSD
We have reminded everyone today that you can short gold in batches at key points, and now all short positions have been exited. When entering the market, it depends on the technology; when leaving the market, it depends on the mentality. Don’t be dominated by fear and greed. Profits belong to you only when you really get them in your hands. Otherwise, everything is just empty talk.
Short-term bears should not continue to participate blindly. By observing the hourly line trend, we can find that this is a typical upward trend. Therefore, bulls may still have a certain rebound momentum in the short term. But it should also be noted that there is pressure from the golden section point of 38.2%, or 3975, and it is also close to the downward trend line. Therefore, for evening trading, I think we can continue to be patient and wait, observe the performance of 3975-3990, and then consider appropriately participating in shorting gold after there is obvious pressure but it is not broken.

Quiet in FX Options — But Gold Is Heating Up
Over the past 24 hours, major currency options saw little of interest.
In contrast, precious metals — especially Gold — are attracting serious attention.
Let’s break down the key developments:
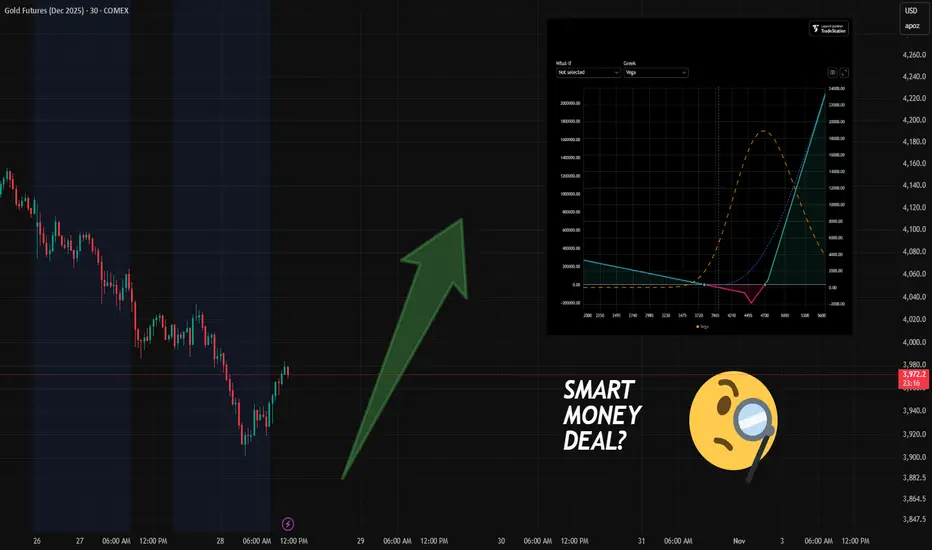
🔹 Observation #1: A New Bullish (But Hedged) Portfolio Appears
(See risk profile on screenshot.)
A new SMART option portfolio has entered the market:
Bullish bias, but with a built-in hedge — which reduces its predictive value.
If price drops below $3,800, the portfolio starts generating profit for its owner (via the hedge).
Built on the February 2025 futures contract, under an option series expiring in December 2025.
📌 Yes, it sounds confusing — and it is.
Option series expire, but futures live on.
This creates what we call "expiry risk" — a topic for another deep-dive article.
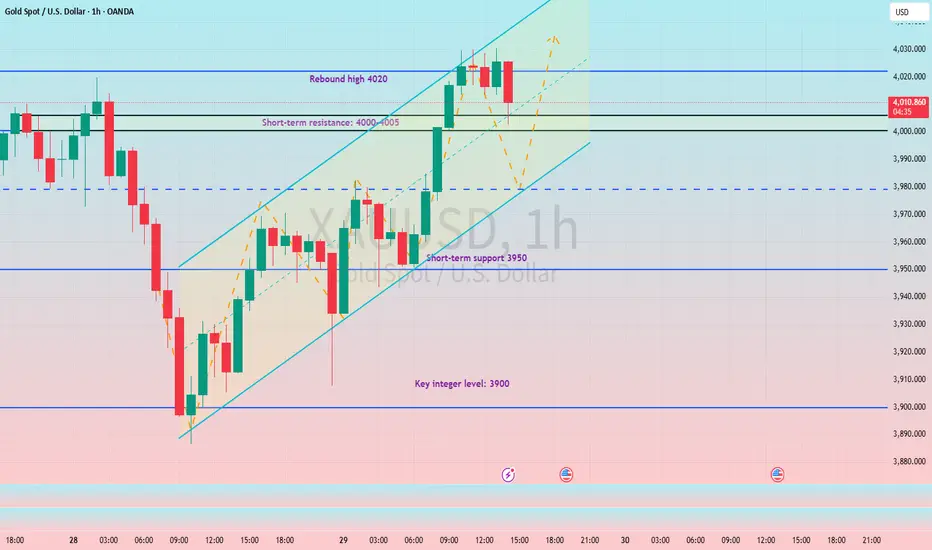
🔹 Observation #2: Put Activity at 3900 (Dec Series)
There’s growing activity in puts at the 3900 strike — moderate bullish positioning or support.
The bullish structure is hedged — not a pure directional bet.
Bearish positioning remains active.
Price has not yet shown signs of moving toward the main long setup.
I’d recommend at least 2–7 days of observation before considering any reversal trades.
📌 And here's why:
It’s rare for price to move immediately toward the target of a large, long-dated portfolio.
More often, there’s a delay of several days — especially when expiry is still far out.
Watch the flow.
Trade only when the edge is clear.
May the data-driven approach be with you!
“Gold Rebounds from Demand Zone — Short-Term Recovery Ahead”Analysis:
Gold (XAU/USD) on the 4-hour chart shows a strong corrective decline after forming an SMC trap near the 4,250–4,300 zone, where liquidity was swept before a sharp selloff. Price has now reached the High Probability POI (Point of Interest) around the 3,850–3,880 region, showing early signs of a bullish reaction.
The recent candle structure indicates buyers are stepping in from this demand zone, confirming a potential short-term reversal. If momentum sustains, the first target zone lies around 3,950–3,980, aligning with minor resistance and previous imbalance fill.
Outlook:
📈 Bias: Bullish correction (short-term)
🧭 Key Support: 3,850 – 3,880
🎯 Target: 3,950 – 3,980
⚠️ Invalidation: Break below 3,840 may reopen bearish continuation toward 3,780

XAU/USD: Bullish Rally to 4225?OANDA:XAUUSD is priming for a bullish rally on the 1-hour chart , with price pulling back to a critical support zone after a sharp decline, forming a potential reversal point as buyers defend against further downside amid overall uptrend signals. This setup highlights a classic dip-buy opportunity near the confluence of support and recent lows.
Entry zone between 4007-4037 for a long position. Target at 4225 near the resistance zone for attractive upside potential. 📊 Set a stop loss on a close below 3991 to manage risk effectively. 🌟 Keep an eye on confirmation through a bullish engulfing pattern or increased volume pushing above the entry, leveraging gold's volatility in response to USD movements.
Fundamentally , today's US Initial Jobless Claims and Existing Home Sales data could introduce volatility to gold and the dollar—Jobless Claims are forecasted at around 233K, while Existing Home Sales are expected near 4.00M, potentially strengthening USD if figures beat expectations and pressuring gold prices. 💡
📝 Trade Plan:
✅ Entry Zone: $4,007 – $4,037 (buy zone near support)
❌ Stop Loss: Close below $3,991
🎯 Target: $4,225 (resistance zone / take-profit area)
💎 Risk-to-Reward: More than 1:4, offering a strong technical edge.
What's your outlook on this trade? Share below! 👇

GOLD (XAU/USD) – 15-Minute Chart AnalysisCurrent Price: 4006.53
Trend: Short-term bearish
🔍 Chart Breakdown
The price is moving within a descending channel, indicating a continuation of the bearish momentum.
There is a key resistance zone around 4035–4060, highlighted in the shaded area. This zone aligns with previous structure and upper trendline resistance.
The market is currently making a minor pullback toward this resistance area after touching the lower boundary of the descending channel.
📉 Expected Move
The purple projection suggests a pullback to the resistance zone, followed by a strong rejection downward.
The target level is set around 3920.72, which corresponds to a previous swing low and a possible completion of the bearish wave.
⚙️ Trading Outlook
Direction Entry Zone Stop Loss Take Profit Confirmation
Sell 4035–4060 4075 3920 Rejection candle or bearish engulfing at resistance
📊 Summary
Gold remains in a short-term downtrend, and the best opportunity is to wait for price to test resistance (4035–4060) before considering short positions targeting 3920.
A breakout above 4075 would invalidate this bearish setup and could signal a potential trend reversal. LME:CA1! LME:MC1! LME:SN1! LME:LH1! LME:SC1! LME:AH1! LME:CO1! LME:ZS1! LME:PB1! LME:HC1! LME:AA1! LME:EA1! LME:ST1! LME:AN1! LME:AW1!

GOLD (Xauusd) is going DOWN! great sell tradeAs you can see GOLD - Xauusd is in a clear downtrend. The red lines drawn show a downward channel which indicate that GOLD is now moving to the downside... Secondly, Gold has broken a powerful support level (the upper green line)! It is now very likely to head down to the lower green line (next support level). Great time to sell!

Gold at a Critical Crossroad: Bounce or Breakdown Ahead?Hi!
The gold price is currently trading around $4,042, sitting just above a critical support area near $3,953.80. This gray zone is a key decision point for the next major move.
Trend Structure:
The broader trend remains bullish, moving within a well-defined ascending channel.
Double Top Formation:
A short-term double top has formed near recent highs, triggering a corrective move down into the channel’s midline and the gray support area.
Critical Support Zone ($3,953.80):
This level aligns with previous structure support and the channel’s bottom, making it a high-probability reaction zone.
________________
Scenario 1: Bullish Reaction (Primary Scenario)
If gold holds above the gray critical area and bounces within the ascending channel, we could see a renewed bullish wave.
Confirmation: A strong bullish reaction or higher low around $3,953–$3,980.
Target: The green target zone around $4,619.57, corresponding to the upper channel boundary and a potential measured move from the recent correction.
Scenario 2: Bearish Breakdown
If the gray area fails to hold, it could signal deeper downside momentum.
Trigger: A clean break and 4H close below $3,953.80.
Target: The pink support zone near $3,656.01, which aligns with prior accumulation and the lower channel boundary.
________________
Disclaimer: As part of ThinkMarkets’ Influencer Program, I am sponsored to share and publish their charts in my analysis.
