Xau/usdXau/usd long term idea if the political situation is like this
dont forget capital management
dont forget the SL
Goldlong

LiamTrading - XAUUSD: SCENARIO BEFORE FOMC LiamTrading - XAUUSD: SCENARIO BEFORE FOMC - $3840 Level Awaits Bottom Fishing Reaction Wave
Hello traders community,
The Gold market is showing a strong and sustainable downtrend. We are witnessing a crash after prices broke through key support zones. With the upcoming FOMC event, our strategy is to seek Buy opportunities at deep liquidity zones and continue Selling when prices recover to retest the broken trend.
📰 MACRO ANALYSIS & CASH FLOW CONTEXT
Gold is currently under dual pressure:
Downward Pressure 🔴: Optimism about the US-China trade progress has significantly weakened the demand for Gold, a safe-haven commodity. Spot Gold prices have fallen below $3950, hitting a three-week low, down about 0.78% on the day (28/10).
Short-term Support 🟢: Bets on the possibility of a Fed rate cut continue to weaken the US Dollar (USD), which is the only factor that could potentially support this precious metal.
Conclusion: This tug-of-war makes it difficult to determine the bottom. The bearish scenario remains the top priority.
📊 TECHNICAL ANALYSIS: THE DOWNWAVE CONTINUES
Based on the H4 chart (image_5fa7fa.png):
Current Trend: The price has successfully broken through the key liquidity support zone near $3950 and is continuing its downtrend.
Current Fibonacci Level: The price is touching and reacting at the 1.618 Fibonacci zone (around $3950).
Next Level: The next level Gold is targeting will be the 2.618 Fibonacci zone (around $3840), which is a large liquidity area expected to see a strong reaction.
Main Strategy: We focus on two scenarios: Bottom fishing reaction at 3840 and continuing to Sell when the price recovers.
🎯 DETAILED TRADING PLAN (ACTION PLAN)
We have two detailed scenarios based on the current price level:
🟢 BUY Reversal Scenario
We wait for the price to hit the deep liquidity bottom zone of 3840 to execute a buy order with the expectation of a technical recovery.
Entry Zone: 3840
Stop Loss (SL): 3832 (tight SL)
Take Profit Targets (TP): TP1: $3872 | TP2: $3898 | TP3: $3925 | TP4: $3950
🔴 SELL Retest Scenario
If Gold recovers without breaking the downtrend structure:
Entry Zone: Watch for a Sell retest at $4091
Stop Loss (SL): $4099
Take Profit Targets (TP): TP1: $4065 | TP2: $4033 | TP3: $4004 | TP4: $3965
SUMMARY & DISCIPLINE (Steven's Note)
Gold is in a strong fall ahead of the FOMC, with significant volatility expected. Capturing deep Fibonacci and Liquidity zones is key.
Note: Always adhere to the set Stop Loss. Capital management is the number one priority, risking only 1-2% of the account per trade.
Wishing traders a successful and disciplined new trading week!

Gold Price Analysis - Gold Breakout Levels 4200 vs 4040Gold is trading inside a tightening rising channel after forming a strong higher timeframe rejection from the ATH which pushed price into a corrective phase. Buyers have repeatedly defended the strong support zone near 4000-3980 creating a false breakout low followed by a controlled recovery showing that demand remains active.
However, each rally into the weak-high resistance at 4160-4200 has shown fading momentum meaning sellers are still protecting this zone aggressively. Until price breaks out with a clean close and retest above this resistance gold will remain in a neutral to slightly bullish consolidation phase driven by stop hunts and choppy movements inside the channel.
A successful breakout above 4200 can trigger a bullish continuation toward 4240 then 4320-4360 and possibly back to the ATH zone while a breakdown below 4040 rising support would shift the structure bearish again exposing the 3980 demand and potentially a deeper drop to 3900 if buyers fail there.
In simple terms buyers still control support, sellers still control resistance and the next big move will come once one of these critical levels breaks with strength.
✅ Option 1-Strong Bullish Bias
Gold is still respecting the rising channel and defending the strong support zone around 4000-3980. As long as price stays above the rising trendline bullish structure remains valid. A clean breakout above 4160-4200 will confirm continuation toward 4240 → 4320 → ATH retest. Buyers are still in the game, waiting for the breakout.
✅ Option 2-Neutral to Bullish
Gold is consolidating inside a rising channel after rejecting the ATH. Support remains strong around 4000-3980 while sellers continue to defend 4160-4200. A breakout on either side will define the next major move. Above 4200 bullish continuation toward 4240 and 4320+. Below 4040 deeper pullback toward 3980 and possibly 3900.
✅ Option 3-Neutral to Bearish
Gold is struggling to break above 4160-4200 showing seller strength at the top of the range. If price fails again and breaks below the rising channel near 4040 downside can accelerate toward 3980 and 3900 for liquidity. Bulls must hold support to avoid a deeper correction.
Gold remains trapped between 4040 support and 4200 resistance inside a rising wedge. Buyers holding strong at the bottom but sellers still defending the top. Break above 4200 bullish continuation toward 4320. Break below 4040 bearish move to 3980-3900. Still a range waiting for breakout confirmation.
Note
Please risk management in trading is a Key so use your money accordingly. If you like the idea then please like and boost. Thank you and Good Luck!

Gold to $4500?You’re looking at a 4-hour chart of Gold (XAUUSD) with a combination of Fibonacci extensions, RSI, and MACD indicators.
1. Price action & Fibonacci levels
• Current price: around $4,008.
• The chart shows retracement and extension levels, with key Fibonacci zones marked (0.618, 1.618, 2.618, etc.).
• The price recently retraced to the 1.618 level (~$4,010) — a common Fibonacci support zone — and bounced slightly.
• There’s also a 2.618 extension at $3,865, suggesting that if $4,000 fails as support, the next downside target could be around $3,865.
2. MACD (top indicator)
• MACD Line (blue) is well below the Signal Line (orange) → strong bearish momentum.
• Histogram is negative (–7.643), confirming the bearish trend.
• However, the histogram bars are starting to shrink, which can often signal bearish exhaustion or a potential bullish reversal coming.
3. RSI (bottom indicator)
• RSI = 35.93, with the RSI-based MA at 39.91.
• This means Gold is nearing oversold territory (below 30) — it’s not extreme yet, but buyers might soon step in.
• If RSI turns up and crosses the MA, it could confirm the beginning of a short-term reversal.
4. Projected path (orange line on chart)
• The drawn orange curve shows a possible bounce scenario:
• Gold could dip slightly below $4,000 or test $3,865 (2.618 level),
• then begin a gradual recovery toward $4,380–$4,400.
• That’s in line with a Fibonacci retracement to 1.0–1.618 area — a common recovery zone after a sharp drop.
5. Summary
Indicator Current Bias Signal
Price Action Slightly Bearish Approaching support zone
Fibonacci Key support at $4,000, next at $3,865 Possible bounce
MACD Bearish but flattening Early reversal potential
RSI Near oversold Could trigger rebound soon
Quick Take:
Gold might dip slightly lower (possibly to $3,865), but technicals suggest a bullish reversal may follow in early November, targeting the $4,380–$4,400 area.

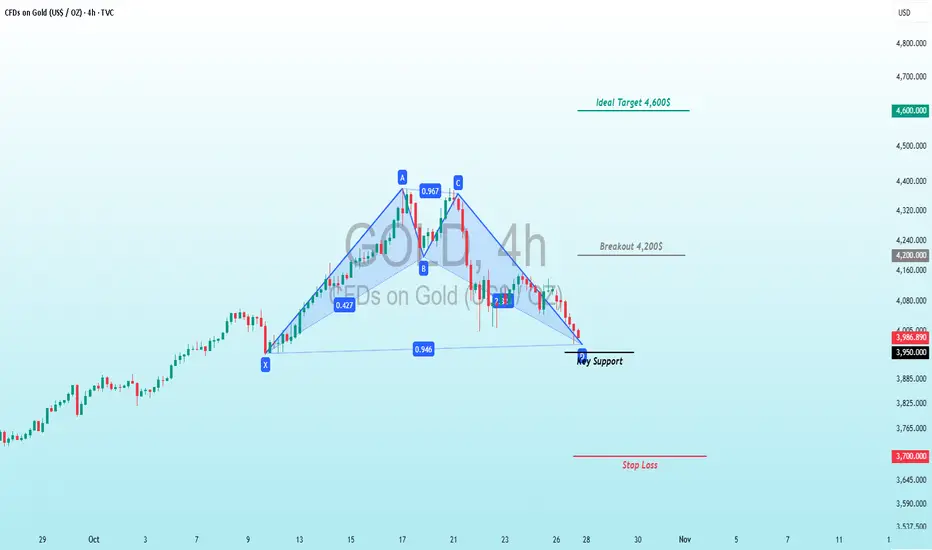
CFDs on Gold (USD/OZ) Symmetrical Triangle Squeeze Setup!TVC:GOLD
🟡 CFDs on Gold (USD/OZ) Symmetrical Triangle Squeeze Setup! 📊
TVC:GOLD 's been on a rollercoaster since early Oct! 🚀 Starting from a solid base at Point A (~$3,730 on Oct 3) 🏗️, it powered up in a steep ascending channel 📈, smashing through resistance to hit euphoric highs at Point B (~$4,600 by Oct 15) – a whopping +23% pump fueled by green marubozu candles, surging volume, and RSI blasting overbought at 75 amid safe-haven flows. But greed turned to fear: A sharp reversal kicked in at Point C, forming a classic symmetrical triangle consolidation 🔺 between ascending support (blue line from A-B) and descending resistance (from C), coiling tight over 10+ days with contracting volatility – MACD flattening, Bollinger Bands squeezing like a spring ready to pop!
Fast-forward to Oct 27: Price's testing the apex near $3,989 (up +3.989% short-term) ⚖️, hovering at the 0.47 Fib retracement level from the A-B swing 🕸️ (key support at $3,950, resistance at $4,070). Breakout north? Bulls could rocket to $4,200 (5.5% quick gain) or full measured move to $4,600 retest for +15.5% profit 💰 from here – ideal for longs with stops below $3,900. Bear breach? Down to $3,700 (-7%) for shorts. Geopolitics + Fed whispers = high octane – watch volume explosion! ⚠️
#GoldTrading #CFDs #CommodityBreakout
XAU/ USD Bullish trend analysis Read The captionSMC Trading point update
-
Technical analysis of XAU/USD (Gold Spot)
Timeframe: 1H (OANDA)
Technical Basis: Smart Money Concepts (SMC) + EMA Confluence
---
Market Structure
Current trend: Bearish, price respecting a descending wedge/channel.
Recent Break of Structure (BOS) confirms bearish momentum continuation.
Price is retracing after forming a new low and may move back to mitigate imbalance (FVG).
---
Key Technical Areas
Retracement Levels:
0.5 – 0.79 Fibonacci zone marks the premium shorting area.
Fair Value Gap (FVG) zone between 0.62–0.79 levels is the ideal entry region.
EMA Resistance:
EMA-50 ≈ 4,067
EMA-200 ≈ 4,120
Both EMAs align with the supply zone, strengthening sell bias.
---
Projected Move
1. Expected retracement toward the 4,067–4,100 zone (supply/FVG region).
2. Potential short entry within that area.
3. Bearish continuation targeting the next structural low at 3,960 (as marked).
---
Targets
Next Target (retracement zone): 4,089
Final Bearish Target: 3,960
Mr SMC Trading point
---
Summary
Gold remains under bearish pressure within a contracting structure. A retracement to the premium zone (4,067–4,100) offers potential short opportunities aligned with structure and EMA resistance. A break below 3,995 would further confirm bearish continuation toward 3,960.
---
Pelas support boost 🚀 this analysis

Gold 4H — Bearish Control With FVG Above
Gold continues to trade under bearish structural dominance, currently ranging between 4,161.535 (local supply) and 4,004.280 (structural support).
The market remains in compression, forming a potential redistribution range within a broader downtrend.
If price breaks below 4,004.280, it confirms a bearish BOS, opening the path toward the 4H Demand Zone (3,960–3,944) — where a reaction or further continuation could occur.
Above, two unmitigated Fair Value Gaps (FVGs) remain at 4,240–4,320, serving as potential retracement targets if the market shows a corrective pullback after internal CHoCH.
However, as long as 4,161 holds as resistance, bearish dominance stays intact.
Range → Break → Mitigation → Continuation → Expansion.
Until structure shifts, rallies are just liquidity grabs.
Technical Outlook Summary:
Dominant Bias: Bearish
Range: 4,161 – 4,004
FVGs Above: 4,240–4,320
Demand Zone: 3,960–3,944
Break Below 4,004: Bearish continuation
Break Above 4,161: Temporary retracement, not reversal
NFA | AI generated | Educational Purpose Only
OANDA:XAUUSD FXOPEN:XAUUSD

GOLD rise?GOLD is consolidating. Making it's way to the RESISTANCE zone and then we will see if it will continue ranging or BreakOut going to the London and NY session.

Bullish bounce off 50% Fibonacci support?The Gold (XAU/USD) is falling towards the pivot, which aligns with the 50% Fibonacci retracement and could bounce from this level to the swing high resistance.
Pivot: 3,847.44
1st Support: 3,701.62
1st Resistance: 4,357.81
Disclaimer:
The above opinions given constitute general market commentary, and do not constitute the opinion or advice of IC Markets or any form of personal or investment advice.
Any opinions, news, research, analyses, prices, other information, or links to third-party sites contained on this website are provided on an "as-is" basis, are intended only to be informative, is not an advice nor a recommendation, nor research, or a record of our trading prices, or an offer of, or solicitation for a transaction in any financial instrument and thus should not be treated as such. The information provided does not involve any specific investment objectives, financial situation and needs of any specific person who may receive it. Please be aware, that past performance is not a reliable indicator of future performance and/or results. Past Performance or Forward-looking scenarios based upon the reasonable beliefs of the third-party provider are not a guarantee of future performance. Actual results may differ materially from those anticipated in forward-looking or past performance statements. IC Markets makes no representation or warranty and assumes no liability as to the accuracy or completeness of the information provided, nor any loss arising from any investment based on a recommendation, forecast or any information supplied by any third-party.

XAU/USD Bullish trend analysis Read The captionSMC Trading point update
Technical analysis of XAU/USD – Bullish Continuation Setup (1H Chart)
Technical Overview:
Instrument: Gold Spot (XAU/USD)
Timeframe: 1 Hour
Current Price: $4,114
Next Target: $4,220
---
Chart Breakdown:
1. Demand Zone (Blue Box):
The price has respected a key bullish order block / demand zone between $4,040 – $4,080, showing strong buyer reaction (green arrows).
2. Ascending Trendline Support:
Multiple rejections from the ascending trendline confirm higher lows, signaling ongoing accumulation from buyers.
3. Fibonacci Retracement:
The market retraced around the 0.618 – 0.786 Fibonacci levels — a strong buy zone for continuation setups.
4. Moving Averages (EMA 50 & EMA 200):
EMA 50 (Blue) is trying to cross above the EMA 200 (Black), hinting at a possible bullish crossover.
A successful break above both EMAs would confirm bullish momentum.
5. Bullish Flag / Wedge Pattern:
The structure shows a bullish flag/wedge forming after an impulsive upward move — indicating potential for another breakout rally.
---
Trade Idea:
Buy Zone: $4,070 – $4,100
Target 1: $4,160
Target 2: $4,220 (main target on chart)
Invalidation (Stop Loss): Below $4,030
Mr SMC Trading point
---
Market Bias:
Bullish Bias – As long as the price holds above the highlighted demand zone and the ascending trendline, buyers remain in control. A breakout above recent highs will confirm momentum toward the next target.
---
Pelas support boost 🚀 this analysis

Global Trade and Its Impact on Currency ShiftsIntroduction
In the complex web of global economics, trade and currency movements are inseparably linked. The value of a nation’s currency is not determined in isolation but reflects the balance of its trade relationships, capital flows, and macroeconomic conditions. Global trade—comprising exports, imports, and cross-border investments—plays a crucial role in determining currency demand and supply. When trade flows shift due to policy changes, geopolitical developments, or technological advancements, they often trigger corresponding movements in currency values.
This essay explores how global trade impacts currency shifts by examining trade balances, exchange rate mechanisms, capital flows, commodity cycles, and geopolitical factors. It also delves into how trade-driven currency shifts affect economies, businesses, and global financial stability.
1. The Link Between Trade and Currency Value
At its core, global trade affects currency through demand and supply dynamics. When a country exports goods or services, foreign buyers must purchase its currency to pay for those exports. This increases demand for the exporter’s currency, leading to appreciation. Conversely, when a country imports more than it exports, it must convert its currency to buy foreign goods, increasing the supply of its currency in global markets and potentially leading to depreciation.
For example, when global demand for German automobiles or Japanese electronics rises, the euro and yen often strengthen because international buyers must acquire those currencies to pay for imports. Similarly, when the United States runs persistent trade deficits, the U.S. dollar experiences downward pressure—although it often remains strong due to its status as the world’s reserve currency.
In short, trade balances—exports minus imports—directly influence currency demand and valuation.
2. Trade Balances and Exchange Rates
A nation’s current account balance is a key determinant of long-term exchange rate movements. The current account includes trade in goods and services, net income from abroad, and net transfer payments. A trade surplus indicates more exports than imports, leading to net foreign currency inflows and upward pressure on the domestic currency. A trade deficit has the opposite effect.
Example: The U.S. Dollar and Trade Deficit
Despite running consistent trade deficits, the U.S. dollar remains relatively strong due to high global demand for U.S. assets, Treasury securities, and the dollar’s dominance in international trade settlements. However, persistent deficits can create structural vulnerabilities, particularly if foreign investors lose confidence in U.S. fiscal sustainability.
Example: China’s Trade Surplus and Yuan Stability
China’s consistent trade surpluses, driven by its manufacturing exports, have historically supported the yuan (renminbi). Although China manages its currency through capital controls and intervention, its export-led model generates strong foreign exchange inflows that support currency stability.
Thus, trade balances serve as a key long-term anchor for currency valuation, even as short-term movements may be driven by speculation and interest rate differentials.
3. Exchange Rate Regimes and Trade Impacts
Exchange rate systems also shape how global trade affects currencies. Broadly, exchange rate regimes can be divided into floating, fixed, and managed float systems.
Floating Exchange Rates (e.g., U.S., U.K., Japan): Market forces of supply and demand determine currency value. Trade imbalances quickly translate into currency shifts.
Fixed Exchange Rates (e.g., Gulf nations pegged to USD): Governments or central banks maintain a fixed value against another currency. Trade impacts are mitigated through central bank intervention.
Managed Float (e.g., China, India): Authorities allow market forces some role but intervene periodically to stabilize the currency.
In floating systems, an increase in exports strengthens the currency, which can eventually make exports less competitive—a self-correcting mechanism. In contrast, countries with fixed exchange rates must adjust through monetary or fiscal policy rather than currency depreciation.
4. Capital Flows and Trade-Linked Currency Movements
Global trade and capital flows are two sides of the same coin. A country running a trade surplus typically becomes a net lender to the rest of the world, investing its excess savings abroad. Conversely, a trade-deficit country must borrow or attract capital inflows to finance its deficit.
This dynamic influences currency movements through the financial account of the balance of payments. For instance:
If a country imports more than it exports, but foreign investors purchase its bonds, equities, or real estate, the inflow of foreign capital can offset currency depreciation.
However, if capital inflows dry up due to political or economic instability, the currency can weaken sharply, as seen during the Asian Financial Crisis (1997–1998), when several Southeast Asian currencies collapsed following rapid capital flight.
Therefore, trade imbalances often lead to corresponding capital flow adjustments that can amplify or counteract currency shifts.
5. Commodity Prices and Terms of Trade
Commodity-dependent economies are highly sensitive to global trade trends and price cycles. When the prices of key exports—like oil, metals, or agricultural goods—rise, commodity exporters’ currencies appreciate, while importers’ currencies depreciate.
Case Study: The “Petro-Currency” Effect
Currencies of oil-exporting nations like Saudi Arabia, Russia, and Canada tend to strengthen when oil prices rise because global buyers must purchase their currencies to pay for energy imports. Conversely, when oil prices fall, these currencies often weaken, reflecting reduced export revenues.
Terms of Trade (ToT)
The terms of trade—the ratio of export prices to import prices—also affect currency value. An improvement in ToT means a country can purchase more imports for the same amount of exports, increasing demand for its currency. For instance, Australia’s dollar (AUD) tends to appreciate when global iron ore and coal prices rise, improving its ToT.
6. Trade Policies and Tariffs
Trade policies, tariffs, and trade agreements directly influence currency movements. When countries impose tariffs, restrict imports, or provide export subsidies, they alter trade flows and thereby currency demand.
Protectionist measures can strengthen domestic currency temporarily if they reduce imports, but over time they may harm competitiveness and productivity, leading to depreciation.
Free trade agreements (FTAs) can stimulate exports and foreign investment, strengthening the domestic currency.
For example, the signing of the North American Free Trade Agreement (NAFTA) increased trade between the U.S., Canada, and Mexico, supporting the Mexican peso and Canadian dollar through higher trade inflows.
7. Geopolitical Events and Global Supply Chains
Geopolitical tensions—wars, sanctions, or trade conflicts—often disrupt global trade flows and cause currency volatility. Trade sanctions can restrict export markets, reduce foreign currency inflows, and weaken affected nations’ currencies.
The Russia-Ukraine conflict (2022–) provides a striking example. Western sanctions reduced Russian exports to Europe, weakening the ruble temporarily, though capital controls later stabilized it. Meanwhile, European currencies like the euro were pressured by surging energy import costs.
The COVID-19 pandemic also exposed the fragility of global supply chains. Trade disruptions caused sharp fluctuations in currencies, particularly in emerging markets dependent on exports of manufactured goods or commodities.
8. The Role of Trade Deficits and Surpluses in Global Imbalances
Persistent trade surpluses and deficits create global financial imbalances that can drive long-term currency misalignments. Countries like China, Germany, and Japan often run large surpluses, accumulating foreign reserves and exporting capital. The U.S., on the other hand, runs chronic deficits financed by foreign investment in U.S. assets.
These imbalances influence global currency trends:
Surplus countries accumulate foreign exchange reserves, often investing them in U.S. Treasury bonds, which supports the dollar.
Deficit countries face currency depreciation risks if investor confidence wanes.
Efforts to rebalance global trade, such as by encouraging domestic consumption in surplus countries or reducing dependence on imports in deficit nations, are central to achieving currency equilibrium.
9. Central Bank Intervention and Trade Dynamics
Central banks often intervene in currency markets to stabilize exchange rates and protect trade competitiveness. For example:
The People’s Bank of China (PBoC) actively manages the yuan to maintain export competitiveness.
The Swiss National Bank (SNB) has intervened to prevent excessive appreciation of the Swiss franc, which could hurt exports.
The Bank of Japan (BoJ) frequently monitors the yen’s strength, as a strong yen can undermine Japan’s export-led economy.
Such interventions can take the form of buying/selling foreign currency reserves, adjusting interest rates, or implementing capital controls.
However, excessive intervention can attract criticism of “currency manipulation,” as seen in U.S.-China trade tensions during the 2010s.
10. The Dollar’s Dominance and Global Trade
The U.S. dollar’s dominance in international trade settlements has a unique impact on global currency dynamics. Most commodities, including oil and gold, are priced in dollars, creating constant global demand for USD regardless of America’s trade balance.
This “exorbitant privilege” allows the U.S. to run persistent deficits while maintaining a strong currency. However, as more nations explore de-dollarization—conducting trade in local or regional currencies—the long-term structure of global currency demand could shift.
Emerging blocs like BRICS are actively exploring alternatives to the dollar, which, if realized, could lead to a more multipolar currency system and alter global trade-currency relationships.
11. Technological and Structural Shifts in Trade
Technological advancements, such as digital trade, automation, and supply chain diversification, also influence currency trends. For instance:
Digital trade platforms reduce transaction costs, increasing global capital mobility and influencing forex markets.
Reshoring and nearshoring production—seen after COVID-19—alter traditional trade balances, thereby impacting currencies.
E-commerce exports by small and medium enterprises are increasing foreign exchange inflows in emerging economies.
Moreover, innovations like blockchain and central bank digital currencies (CBDCs) could reshape how global trade is settled, potentially reducing dependence on traditional reserve currencies and changing how trade flows affect exchange rates.
12. Long-Term Implications of Trade-Driven Currency Shifts
Global trade’s influence on currency shifts extends far beyond financial markets—it affects inflation, employment, investment, and overall economic stability.
Currency Appreciation: Makes imports cheaper, reducing inflation but potentially harming export competitiveness.
Currency Depreciation: Boosts exports but raises import costs, potentially fueling inflation.
Volatility: Frequent currency fluctuations can complicate long-term business planning, investment decisions, and government policy-making.
Therefore, nations strive for a balanced trade and exchange rate policy—neither excessive appreciation nor chronic depreciation—to maintain competitiveness and price stability.
Conclusion
Global trade remains one of the most powerful forces shaping currency values. Trade balances, commodity cycles, capital flows, and geopolitical developments all contribute to how currencies move in global markets. A country’s ability to manage these forces—through prudent macroeconomic policies, diversified trade relationships, and stable political governance—determines its currency’s resilience.
As globalization evolves and new trade patterns emerge, currency dynamics will continue to adapt. The rise of regional trade blocs, digital currencies, and de-dollarization movements may gradually reshape how global trade impacts currencies in the 21st century. Yet, the fundamental principle remains unchanged: trade is the lifeblood of currency demand, and currency shifts are the mirror reflection of a nation’s position in the global economic system.
FED cuts interest rates - gold prices rise next week ✍️ NOVA hello everyone, Let's comment on gold price next week from 10/27/2025 - 10/31/2025
⭐️GOLDEN INFORMATION:
Gold (XAU/USD) rebounds over 0.10% on Friday, trading near $4,127 after recovering from $4,043 lows, as softer-than-expected US inflation data reinforced expectations of a Fed rate cut next week. The CPI report broadly met forecasts but offered little support for hawkish policymakers.
⭐️Personal comments NOVA:
Gold price recovers, positive next week when FED almost continues to reduce interest rate by 0.25%. Opportunity for gold to return above 4200, 4300
🔥 Technically:
Based on the resistance and support areas of the gold price according to the H4 frame, NOVA identifies the important key areas as follows:
Resistance: $4153, $4237, $4380
Support: $4045, $3944
🔥 NOTE:
Note: Nova wishes traders to manage their capital well
- take the number of lots that match your capital
- Takeprofit equal to 4-6% of capital account
- Stoplose equal to 2-3% of capital account
- The winner is the one who sticks with the market the longest

Bullish potential detected for BGLEntry conditions:
(i) higher share price for ASX:BGL along with swing up of indicators such as DMI/RSI.
Depending on risk tolerance, the stop loss for the trade would be:
(i) below the long-term support level of $0.98 (from the open of 7th January), or
(ii) below the rising 30 day moving average (currently $0.94).

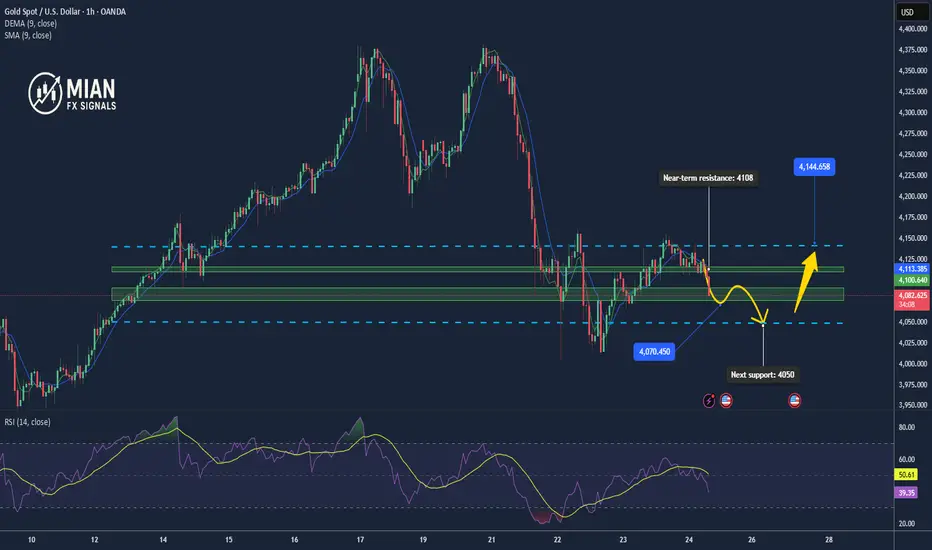
Gold weakens, retesting key 4080 supportMarket Overview
After failing to hold above the 4115–4120 zone, gold (XAU/USD) has turned lower toward 4085, signaling the loss of short-term recovery momentum.
Profit-taking pressure increased as U.S. bond yields rose again and traders turned cautious ahead of the upcoming U.S. PCE data.
Buyers are now defending the 4080–4078 support area, which will be crucial in determining the next market direction.
📊 Technical Analysis
• EMA50 (H1): 4107 → price now trading below EMA50, indicating a clear correction phase.
• EMA200 (H1): 4126 → remains the main resistance until a firm close above it.
• RSI (H1): dropped to 40, showing bearish momentum dominance.
• Near-term resistance: 4108 – 4115
• Upper resistance: 4130 – 4142
• Immediate support: 4080 – 4075
• Next support: 4062 – 4050
On the H1 timeframe, a bearish engulfing pattern is forming — a signal that deeper downside could follow if 4080 is broken.
💡 Outlook
The short-term trend has shifted back to neutral-to-bearish.
If price closes below 4078 (H1), gold could extend losses toward 4062 – 4050.
Conversely, a bullish reversal candle around 4080–4078 may trigger a rebound toward 4108–4115.
🎯 Trading Strategy
🔺 BUY XAU/USD: 4053 – 4050
🎯 TP: 40 / 80 / 200 pips
🛑 SL: 4047
🔻 SELL XAU/USD : 4108 – 4112
🎯 TP: 40 / 80 / 200 pips
🛑 SL: 4116
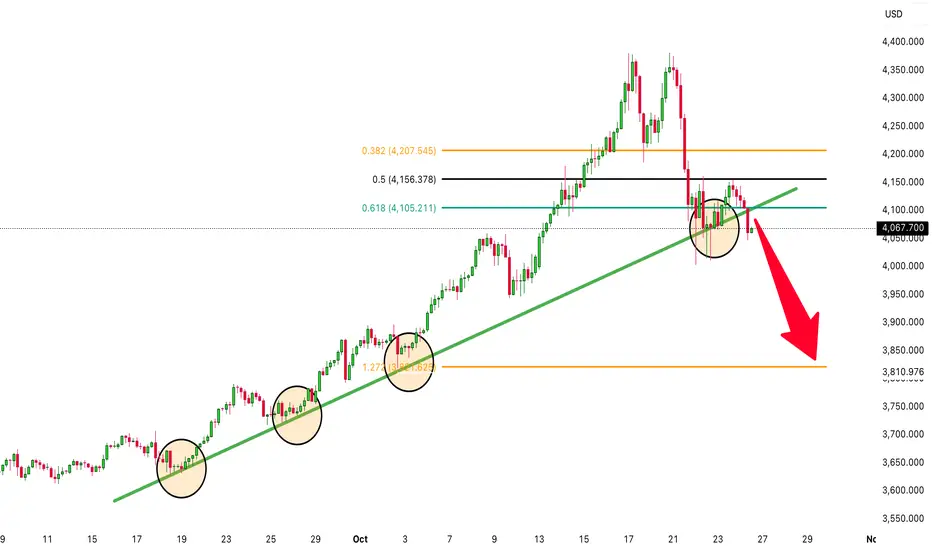
Time for GOLD To DROP! (XAUUSD is heading to the downside!)For many weeks gold (XAUUSD) has been sky rocketing to the upside, however there have been many new signals indicating that it could be a bearish move to the downside. Nothing keeps going up forever! Gold has broken major support levels including the trendline that has been holding it up for weeks. It has also been struggling to break above the fibonacci level of 0.50! Time to sell!
GOLD HIGH PROBABILITY SETUP SOON!!! 🚨 XAUUSD HIGH PROBABILITY BUY SETUP 🚨
* Here We Can See Clearly The Next Potential Moves For GOLD Coming Hours/Days.
* Keep Your Eyes Close On Your Trading Positions.
* Happy PIP Hunting Traders.
FXKILLA.

GOLD will rise.XAUUSD has been moving sideways this week and good probabilité it will rise today or next week when markets will reopen. Also some news coming so we will see it's reaction from the fundamentals.

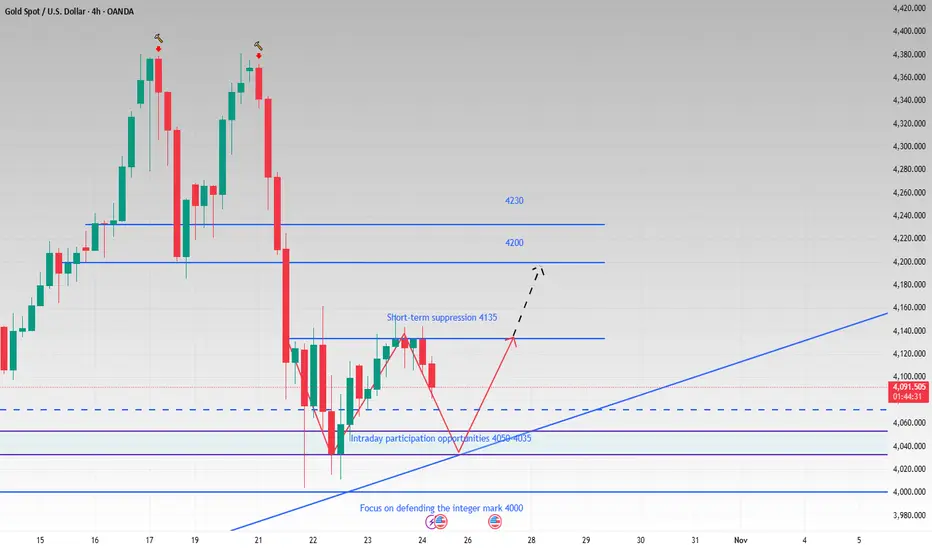
4H see W shape. Support is not broken and it is still bullish.Although gold has experienced a temporary pullback today, we remain bullish as long as the price remains above the upward trend line. While the hourly chart shows a downward trend, with moving averages diverging downward and technical indicators like the MACD forming a death cross, it appears that bears have regained control of the market in the short term.
But from the 4H perspective, if the short-term decline continues and it can effectively rebound after touching the trend line and move out of the W-shaped structure, then gold will be expected to hit the 4135-4145 pressure again, and then gradually hit the 4160, 4200 and other periodic resistance levels until the bulls return. As time goes by, the support points on the short-term trend line are constantly moving up. If it falls back to 4050-4035, try to go long on gold in batches with light positions, and the target is 4090-4130.
OANDA:XAUUSD
Bullish Gold XAUUSD Setup: Breakout, Retest & Trade OpportunityGold is currently bullish and beginning to break market structure 📈. Price is moving toward previous highs, which may act as resistance. Ideally, I’m watching for price to push through these highs, then retest the level for a potential long opportunity ✅.
In the video, I break everything down clearly — including:
📊 Trend direction
🏛 Market structure
💹 Price action
📉 Volume profile analysis
🎯 How to plan the trade step-by-step
⚠️ This is not financial advice — educational purposes only.

XAUUSD 4H Bullish SetupGold shows signs of short-term bullish momentum after forming a double bottom pattern near the lower green EMA ribbon, suggesting selling pressure is fading. The candles are now attempting to close above the short-term EMA cluster, hinting at a potential shift in momentum toward buyers.
Bullish Confluences:
Price has bounced from the lower Fibonacci zone, aligning with previous support around $4,045.
The EMA ribbons are starting to compress, often a precursor to a trend reversal or breakout.
Heikin Ashi candles show smaller wicks to the downside, signaling weakening bearish momentum.
Potential Fibonacci Targets:
Target 1: 4,120 – 4,130 (38.2% Fib retracement / first resistance zone)
Target 2: 4,163 – 4,175 (61.8% Fib retracement / mid EMA ribbon resistance)
Target 3: 4,220 – 4,250 (100% Fib extension / upper channel confluence)
Invalidation:
A 4H candle close below 4,045 would invalidate the bullish setup and suggest continuation of the broader downtrend.


Gold Spot | H4 Countertrend Recovery Toward Daily Breakdown Zone
The Market Flow | Oct 23, 2025
Technical Overview
H4:
• Pivot zone active at 4073–4097 ; structure turned upward.
• Price is correcting within the broader daily downtrend phase.
• As long as this pivot zone holds, short-term bias remains constructive toward upper resistance.
• Next resistance lies at 4220–4246 (H4 supply + daily breakdown area).
• Expansion level aligns at 4360 , marking the limit of the countertrend reach.
Daily:
• The daily structure remains in correction following the prior impulsive decline.
• Current advance reflects a correction within that corrective phase — effectively, a secondary retracement.
• Breakdown pivot sits at 4040 ; reclaim above that would signal early reaccumulation.
Trade Structure & Levels
• Bias: Long above 4073
• Trigger = 4097
• Invalidation = 4073
• Path → 4220 → 4246
• Phase: Correction of a corrective wave (short-term recovery within broader downtrend)
Risk & Event Context
• No imminent macro catalyst; gold volatility subdued after recent impulse.
• Next reaction likely around the 4240–4260 region — alignment of structural resistance.
Conclusion
H4 bias remains long while holding above the 4073–4097 pivot zone. The market is retracing within a corrective context, targeting the daily breakdown and upper H4 resistance. A close below the active pivot would invalidate this recovery structure.
Disclaimer
This analysis is for informational purposes only and does not constitute investment advice, an offer, or a recommendation. Market conditions and price behavior may change without notice. Past performance is not indicative of future results. Always conduct your own research or consult a licensed financial advisor before making investment decisions.

RGLD Ready to Shine—Ride the Next Precious Metals WaveRoyal Gold Inc. (RGLD) is showing trending buy momentum supported by boosted FY2025 earnings estimates and solid growth in streaming revenues. Monitor price action near Weekly Support for an entry on this high-quality precious metals play.
