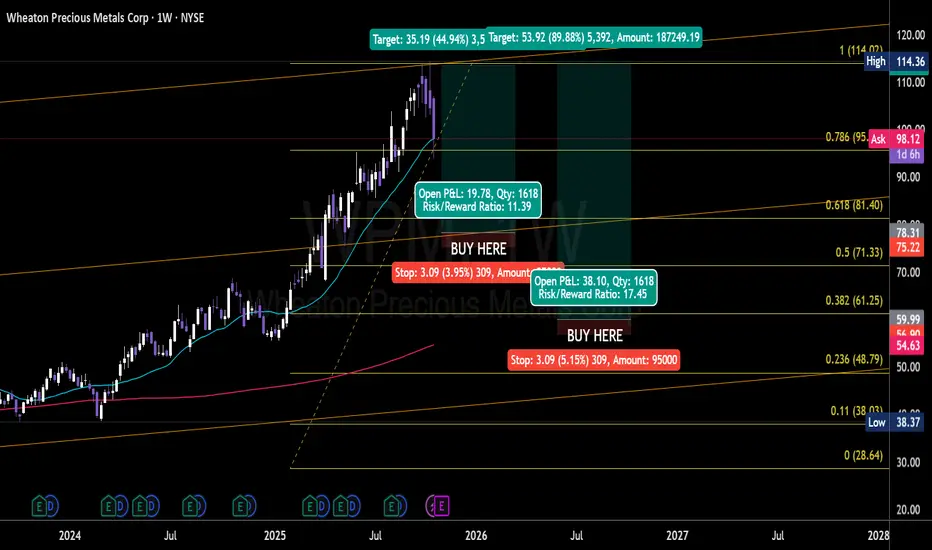
WPM Trending Down—Position for Precious Metals GainsWheaton Precious Metals (WPM) was trending higher with rising precious metals prices and strong cash flow growth. The stock benefits from its streaming model, offering exposure to multiple metals with limited operational risk. Watch key support levels for confirmation of this buy setups.
Goldlong
AEM Trending Strong—Capitalize on Earnings BUY MomentumAEM is trending strongly with earnings momentum! 💰 Watch $132 and volume for the next breakout. #Trading #Gold #AEM

Barrick Gold (B) Poised for Further Gains as Gold Prices SurgeThis trade idea highlights Barrick Gold's strong momentum backed by rising gold prices and robust Q2 earnings showing increased gold and copper production. With the stock recently rallying over 100% year-to-date and analysts rating it as undervalued on key metrics, this setup offers potential for continued upside. Watch for key Support levels and volume confirmation to enter, applying strict risk management.

Gold update- Bullish Reaction from Key Level..Price reacted beautifully from the 4000 key level / demand zone we marked last week.
We’re now seeing early bullish signs and structure holding.
At this stage:
I’m managing my current positions with the trend
No need to force trades — just letting price action develop
As long as structure holds, I remain bullish on gold for now
Risk is managed, emotions aside — focus is on what the chart is showing
I’ll update again after data/news prints or if structure changes.

Gold is Heating Up – Watch GLD for Big BUY MovesTechnical analysis of GLD highlights a setup with strong upside potential. Traders should observe volume spikes and price behaviour around Support areas for confirmation

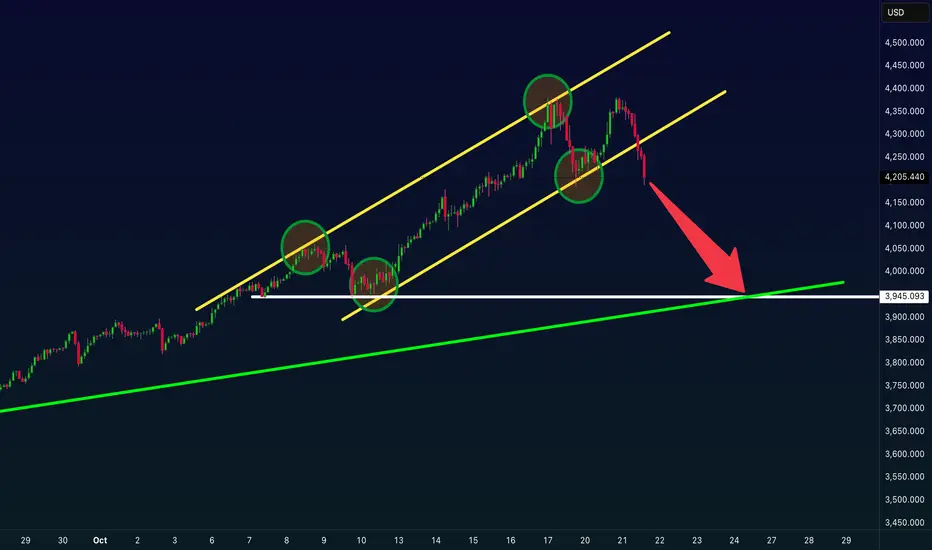
Labubu - New pattern spotted on GoldAfter the sharp selloff, I’ll be watching whether bulls can pull the price back into the October rising channel.
Right now, price action looks like a post-panic consolidation, where the market decides: is this just a pause — or the start of a bigger recovery?
The strong break above the yesterday highs would confirm that demand is returning.
Until then, the bias remains neutral but hopeful.

GOLD POSSIBLE MOVEMENT ON 4HRSBear it in mind that Gold is on bullish movement so I am working on this pattern to form before considering any entry.... Dyor
Continuation pattern 🕊️🙏

The trend line is not broken and the medium to long term is bull
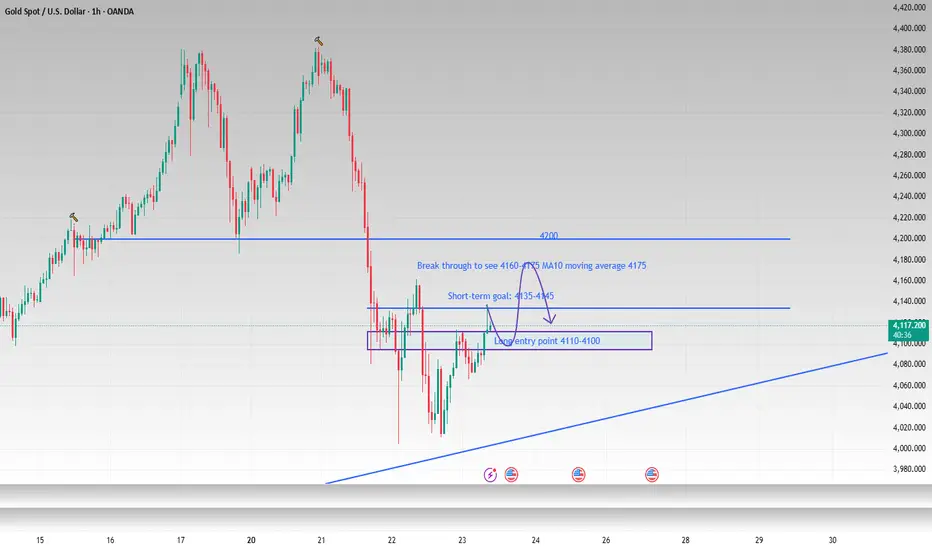
Good morning, bros. Gold has fallen from its high of 4380, dropping nearly $380. This significant drop is relatively rare in the past six months. However, judging from the 4H cycle trend, the current gold price is still above the rising trend line. The 4000 mark is a defensive point for bulls. The decline will only continue after successfully breaking through 4000. Yesterday, the lowest point only retreated to around 4015-4005 before it began to rebound. Although it did not provide us with an ideal entry opportunity, it also confirmed the determination of the buyers below to hold on to the 4000 mark. Therefore, until a clear break below the trend line is achieved, our bullish outlook remains unchanged.
The gold price rebounded to around 4135 during the day and then fell back. As I told you yesterday, this position is a relatively dense trading area. I believe the current decline is the market accumulating strength to hit yesterday's rebound high, and it also provides us with a good opportunity to enter the long market. Pay attention to 4110-4100 below. If it retreats to this range, you can try to go long on gold in batches. The first target can continue to look at 4135-4145.
OANDA:XAUUSD
GOLD PAUSES DECLINE; REBOUND IN PLAY TP: 4398 - 4485 - 4630GOLD Macro Outlook
Gold prices rose to around $4,120 per ounce on Thursday, halting a two-day decline as investors weighed trade developments and geopolitical tensions that lifted the metal’s safe-haven appeal.
Reports indicated that the US is considering export restrictions on China involving American-made software, though President Donald Trump later confirmed plans to meet with Chinese President Xi Jinping.
Gold is setting up for a potential bullish continuation as falling bond yields and anticipated Federal Reserve rate cuts continue to weaken the U.S. dollar and boost demand for safe-haven assets.
The 10-year Treasury yield remains below 4%, and yields across the curve have softened. This reinforces expectations that the Fed will announce rate cuts during its upcoming FOMC meetings on October 29 and December 10.
Looking into 2026, the trend of global monetary easing is likely to persist. Economies in Asia and Northern Europe are showing signs of structural weakness due to aging demographics and declining household formation, leading to prolonged low growth and further pressure on global interest rates.
Gold Technical Structure
On the technical front, Gold is currently trading near $4,137, after correcting from the recent high of $4,398. The chart shows price consolidating along the lower Gann support, with a potential reversal setup forming.
Immediate Support: $4,023–$4,100
Immediate Resistance: $4,175 and $4,225–$4,255 (key breakout zone)
Breakout Targets: $4,318 → $4,398 → $4,485 → $4,631
Stop-Loss: Below $4,025 (closing basis)
A daily close above $4,255 would confirm bullish continuation, opening the path toward $4,400–$4,630 levels in the medium term. A breakdown below $4,050 would invalidate the setup and shift bias back to neutral.
Summary
Bias: Bullish (above $4,225)
Entry Zone: $4,060–$4,150
Confirmation: Close above $4,255
Stop-Loss: $4,025 (closing basis)
Targets: $4,318 → $4,398 → $4,485 → $4,631
Macro Catalyst: Fed easing cycle, weaker USD, global rate decline
Gold remains well-positioned for a renewed upside phase driven by macro tailwinds and technical recovery from support zones. Sustained trade above $4,225–$4,255 could confirm a breakout, aligning both macro fundamentals and technical signals in favor of the bulls.

Bull ride on gold 4H is in range bound.
the lower timeframe is bull i.e, the market is trying to move up from the lower side of the range bound of 4H.
Once the channel breaks out, small bull run can be expected till the 4H resistance.
The target and SL details are in the chart.
as the market in range bound in 4H, so the bull trade must be made with caution, have a tight SL.

GOLD (XAU/USD) – FINAL GRAND CYCLE ANALYSIS🟡 GOLD (XAU/USD) – FINAL GRAND CYCLE ANALYSIS
“The Rise of Real Money in a Failing Fiat World”
Elliott Waves | Fibonacci | Smart Money | Macro Fundamentals | Market Psychology
📅 Date: October 22, 2025
📍 Current Price: ~$4,039/oz
⏳ Time Horizon: 1970s to post-2050
🎯 Focus: Multi-decade Elliott Wave structure signaling the endgame for fiat currencies
🌐 SUPER CYCLE NARRATIVE – GOLD’S MONETARY METAMORPHOSIS
🔵 Wave I (1971–1980): The Rebirth of Real Money
Gold's first major secular rally began when the Bretton Woods system collapsed and President Nixon ended the U.S. dollar’s convertibility to gold in 1971. Gold soared from around $35 to nearly $875 by 1980. This wave was driven by runaway inflation, the oil embargo, and shattered confidence in fiat money.
🔴 Wave II (1980–1999): The Great Fiat Illusion
Following the 1980 peak, gold entered a brutal 19-year corrective phase, falling to the $250 zone. During this time, the U.S. dollar gained strength, Volcker’s interest rate hikes reined in inflation, and a new era of debt-based prosperity and stock market euphoria unfolded. Gold was dismissed, even by central banks who sold reserves. Structurally, this corrective phase formed a complex WXYXZ pattern , setting the groundwork for the massive Wave III rally.
🟢 Wave III (1999–~2033): The Fiat Reckoning Has Begun
This is the longest and most powerful supercycle wave and the one we are currently in. It is subdivided into five impulsive macro waves. As of now, gold is deep within Wave iii of III , the most explosive phase of the entire structure. The current rally is no longer driven by inflation fears but by existential doubts about the long-term viability of fiat currencies.
📈 Wave I of III (1999–2011): The Institutional Accumulation
Gold rose from around $250 to $1,920 over this period. Triggers included the dot-com bust, 9/11, the 2008 global financial crisis, and the launch of the first gold ETFs like GLD. This wave marked the beginning of institutional interest in gold as a systemic hedge.
📉 Wave II of III (2011–2015): The Disbelief Correction
Gold corrected nearly 45%, bottoming near $1,050. The narrative shifted — QE hadn't caused hyperinflation, the stock market was booming again, and faith in the dollar resurged. Retail abandoned gold, but institutional buyers quietly accumulated from newly created demand zones.
🚀 Wave iii of III (2015–~2026): The True Price Discovery Phase
This is where we are now. Since 2015, gold has exploded upward, driven by COVID-era QE, negative real interest rates, geopolitical instability, and major central banks accumulating gold for cross-border settlements outside the dollar system.
We are currently in the middle of this wave — micro wave (3) of iii — with price around $4,039. According to Fibonacci projections, this wave is expected to peak near $6,552 , corresponding to the 2.618 extension level . If bullish momentum continues, gold could overshoot toward $22,744 , matching the 3.618 Fibonacci extension and marking the likely top of macro Wave III.
In an extreme scenario where fiat trust collapses entirely, the 4.618 extension projects a possible target of $78,940 . All of these levels align with the upper bounds of the long-term logarithmic channel, validating both structure and projections. But most likely this target is for Wave V TOP .
🟣 Wave IV (Projected: 2026–2033): The Great Shakeout
After the parabolic run of Wave iii, a deep multi-year correction is likely. This correction — Wave IV — may retrace toward the long-term red trendline and could coincide with a temporary return to “faith” in fiat through reforms like CBDC rollouts or aggressive fiscal pivots.
This wave could resemble a WXY pattern or large ABC structure and may unfold alongside capital controls, deflationary pressure, and a resurgent tech or dollar narrative. However, this will likely be the last major buying opportunity before gold enters its final, euphoric revaluation.
🟢 Wave V (2033–2045+): The Final Blow-Off Top
Wave V is expected to be driven by an overt crisis of confidence in the global fiat system. Scenarios could include:
Mass adoption of gold-backed or commodity-tied digital currencies
Loss of global trust in the USD as the reserve currency
BRICS or emerging alliances introducing gold into cross-border settlements
Global central banks returning to physical gold as a monetary base
The upside potential here is monumental. The 4.618 Fibonacci extension already targets $78,940 , but under full systemic collapse or monetary reset conditions, gold could reprice toward $100,000–$250,000 per ounce — not as a bubble, but as a return to its role as sound, base-layer money.
📐 Fibonacci Milestones and Structure Alignment
Each major wave has closely respected its corresponding Fibonacci extension. Wave I topped around the 1.618 level ($1,887) . The ongoing Wave iii appears on track to reach the 2.618 level ($6,552) . From there, macro Wave III could stretch toward 3.618 ($22,744) . If Wave V extends fully, a 4.618 projection leads to $78,940 — all within the bounds of the established logarithmic trend channel. In a full-blown systemic reset, price could break even higher.
These levels are not speculative but grounded in structural alignment with Elliott wave geometry , Fibonacci mathematic s, and long-term institutional order flow .
🧠 Smart Money Concepts & Technical Validations
Smart money activity has left clear fingerprints across this cycle. Each break of market structure (in 2016, 2020, and 2023) confirmed higher time-frame bullish continuation. Institutional demand zones — especially during the 2018–2019 consolidation and 2022 pullback — were respected to the dollar.
This cycle isn’t retail-driven mania — it's a stealth institutional accumulation that’s now evolving into price discovery.
📊 Market Psychology Across the Cycle
Investor sentiment has followed classic psychology stages:
From 1999 to 2004, disbelief reigned: “Gold is dead.”
Between 2005 and 2011 came growing awareness: “Gold might work again.”
The 2011–2015 correction brought denial: “It was just a bubble.”
Hope returned in 2016–2020 as price quietly rallied.
From 2022 to 2026, euphoria dominates: “Gold will never go down.”
Wave IV will likely bring fear and capitulation between 2026 and 2033.
Finally, Wave V will ignite mania: “Gold to the moon!”
🚨 Final Synthesis: What This All Means
We are living through the largest repricing of monetary value in modern financial history. Gold is no longer just an inflation hedge — it’s becoming a hedge against the system itself . The structure on the chart doesn't just map price — it maps the collapse of fiat trust and the return of monetary sanity.
Gold is transitioning from:
A commodity hedge →
To a central bank hedge →
To a currency hedge →
And finally, to a system hedge
The current leg — Wave iii of III — is nearing its climax. After a correction in Wave IV, Wave V could take gold into previously unthinkable territory, not because gold changed — but because everything else did.
📌 Final Position Summary
We are currently in wave (5) of iii of III — the most powerful segment of the bull run
The next Fibonacci target is $6,552
The broader Wave III could peak near $22,744
After a correction (Wave IV), the final wave could send gold toward $78,940 , or even into the $100,000–$250,000 zone under extreme monetary reset conditions
This is not a mere forecast — it’s a macro-monetary blueprint for the coming decades.
🌊 "Those who understand the waves will ride them. Those who don’t will be swallowed by the tide." – FIBCOS
📘 Disclaimer: This is an educational market outlook based on technical and macroeconomic structure. It is not financial advice. Always do your own due diligence and risk management.
#XAUUSD #Gold #GoldAnalysis #ElliottWave #Fibonacci #SmartMoneyConcepts #PriceAction #TechnicalAnalysis #MarketStructure #Commodities #InflationHedge #MacroEconomics #CentralBanks #BRICS #MonetaryReset

Gold Market Update – What Price Just Did & What I’m WatchingGOLD (XAUUSD) – Key 4H Structure Reaction | Watching 4500 Next
Gold sold off aggressively yesterday and tapped into the 4H extreme structure level. This zone held perfectly, showing a strong reaction—which tells me price shouldn’t violate this level if structure is to remain bullish.
Dropping down to the 1H timeframe, at 2PM UK time, we printed a clean bullish engulfing candle, showing early signs of buyers stepping back in.
📌 My Outlook from Here:
As long as price holds above this 4H structure low, bullish structure remains valid.
I’m staying patient with calculated risk, allowing price action to confirm continuation.
If momentum holds, gold could push back toward the previous higher high, and potentially towards the next psychological level at 4500.
🟡 No impulsive entries — just patience, structure, and reaction-based execution.

Look for a volatile upward correction of 4200-4220Good morning, bros. Although the market did not provide us with suitable trading opportunities last night, this did not prevent the market from confirming Allen's advanced trading vision. Even if the long orders at 4060-4050 were stopped out, the gold price still fell back to around 4000 as expected. Continuing to go long can not only turn losses into profits in one fell swoop, but also ensure substantial profits. how is it? Although we were unable to participate in this transaction, the final trend and results always prove the high accuracy of Allen's advanced trading vision and strategic analysis.
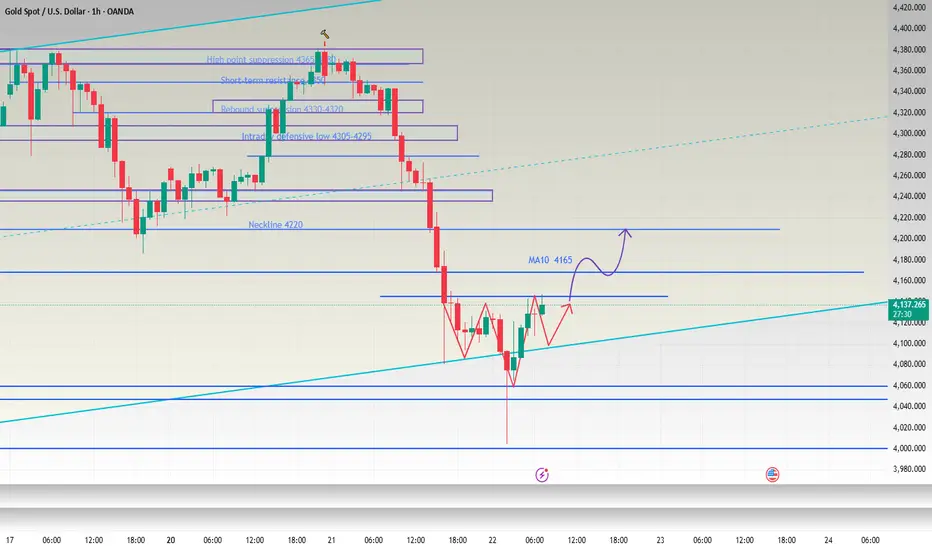
As the candle chart closed with a long lower shadow that was nearly twice the length of the body, the short-term bottom was found near 4000. Therefore, I believe that gold may be in a state of volatile upward repair today. After a rapid decline and rebound this morning, the current price is once again around 4120-4130. Judging from the hourly chart, there is a rudimentary form of a head and shoulders bottom pattern in the short term. If the gold price retreats again, thus prompting the formation of a head and shoulders bottom pattern, then when the gold price falls back to around 4105-4095, we can also try to go long on gold with a light position. If gold continues to rise, we will pay attention to the performance of 4160-4170 above, which is both a short-term resistance and the daily MA10 moving average. If the bulls want to return to the market, they must first stand firm on the MA10 moving average to have greater hope. Therefore, this resistance range is also the focus of our short-term attention. Once it stabilizes above the MA10 moving average, gold will be expected to rebound to 4200-4220.
OANDA:XAUUSD
COULD GOLD (XAU/USD) BOUNCE TO THE UPSIDE OR DROP?GOLD (XAUUSD) is currently being held by a strong support trend line which is is struggling to breakthrough.. however, it is currently in a new downtrend and could continue to fall to the downside.
If The support trendline has been broken, this will be a great sell opportunity.. if it struggles to break, then it will be a great buy opportunity. Keep an eye!

XAUUSD: Double top pattern completed, gold confirms reversalContrary to the vast majority of people's beliefs, OANDA:XAUUSD was unable to break through the old peak at $4380/oz to move above the $4400/oz area but formed a double top pattern on the 1 hour timeframes and corrected downwards with a record margin from $4380 to near $4000/oz.
With these factors, we can almost certainly conclude that gold has completed this rally and will begin to correct downwards in the near future.
Looking through the options market, almost all traders have withdrawn all Longcall contracts from the market and a large number of Longput contracts have been pushed in.
This further reinforces the fact that the price has begun to enter a downward correction cycle in the near future.
Some key levels that we need to pay attention to in today's trading session:
Resistance: , , ,
Support:
Margin zone support:
Strong support:
Always be patient and wait for the price to reach the support and resistance zones above and get confirmation. Do not place limit orders or enter orders when the price is increasing or decreasing sharply.
Take advantage of the above support and resistance zones and trade short-term when the price reacts at these support and resistance zones.
Take profit when the price moves from 10 to 20 prices since entering the order at the support and resistance areas.
Wait for reactions such as Engulfing candles, Doji,... at the support and resistance zones.
Always set stop loss when trading and manage risks closely.
Note: Price may spike through support or resistance levels and then reverse. Therefore, it is crucial to patiently wait for the candle to close before entering a trade.
Victor Dan @ ZuperView

Attractive Bullish Gold SetupHey, it’s Erik!
XAUUSD is currently in a fascinating phase. After a strong pullback from the upper boundary of the ascending channel, gold is now heading toward the lower boundary. This region aligns with a key support zone, and a potential reaction here could propel the price back upward.
If buyers manage to defend this level, the potential for a rise to $4,380 is significant. This level coincides with the middle of the channel and previous resistance, making it a logical short-term target in this bullish market structure.
However, there’s an important caveat. If the market fails to hold this support, the bullish scenario could lose its validity, and we might see a continuation of the downward trend. That’s why it’s crucial to wait for clear confirmation before entering. A rejection wick, increased buying volume, or a bullish engulfing pattern are all key technical signals to watch for the right entry point.
So, what do you think? Ready to seize this opportunity, or do you see other risks? Share your thoughts with us!

mrmoney limited XAU/USD swing trading ideaprice approached our 4hours QMR and daily timeframe engulfing candle/trendline

$GOLD Rally Pause – Will the Golden Fib Hold?TVC:GOLD has seen a strong rally after months of accumulation, but the recent sharp pullback looks like a healthy correction rather than a trend reversal.
Currently, price is approaching the Golden Fib Zone (0.5–0.618), an area that often acts as a strong support during ongoing uptrends. If the price manages to hold this zone and form a solid base, we could see the next leg higher, potentially leading to new highs.
For now, the focus remains on how price reacts at this Fib zone, a bounce here could confirm continuation, while a breakdown below may signal a deeper correction.
DYOR, NFA
THANKS FOR THE READING

Accurately grasp every trading opportunity,do you dare to followGold prices fell sharply in the evening due to the news, with a daily drop of nearly $300. Judging from the daily chart, the large real negative line almost swallowed up all the gains last week, and the bears have absolute control over the market.
Since this morning, Allen has been reminding everyone to pay attention to the M-shaped double-top structure and be alert to the possible sharp market correction. Even if you fail to keep up with our trading rhythm, as long as you refer to my ideas and read them carefully, you can at least effectively avoid being washed out by the market.
As gold continues to fall, various voices have appeared in the market. Bros must keep their eyes open when referring to them. After all, not everyone is as brave as Allen in facing mistakes and losses.
As I said, the bears are currently dominating the market. Although the decline has stagnated slightly in the short term, the downward trend has not completely stopped. It will be difficult for the bulls to recover all their lost ground tonight. The current gold price is hovering around 4110. If it continues to fall, you can pay attention to the short-term support of 4060-4050 below. Try to go long with a light position, set a stop loss, and look for support at the 4000 integer mark if it breaks.
OANDA:XAUUSD

Time for GOLD To DROP! (is XAUUSD heading to the downside?)For weeks gold (XAUUSD) has been sky rocketing to the upside, however there have been many new signals indicating that it could be a bearish move to the downside. Nothing keeps going up forever! Gold has broken major support levels + trend line and channel breakout. Time to sell!
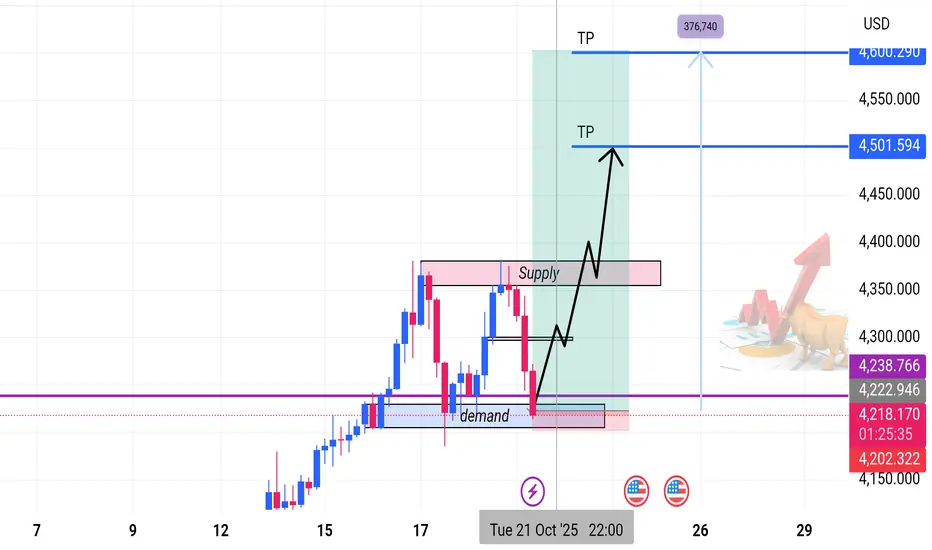
Bullish Continuation from Demand Zone | 4H SetupOverview:
Gold is maintaining a strong bullish structure on the 4-hour timeframe, forming consistent higher highs and higher lows.
Recently, price tapped into a key Demand Zone, showing a clear rejection and early signs of buyer re-entry — signaling a potential continuation of the uptrend.
Technical Outlook
• Trend: Bullish market structure intact.
• Current Price: ~4,230.34
• Demand Zone (Buy Zone): Price has bounced from a major demand area — indicating renewed buying pressure.
• Reversal Confirmation: Rejection wicks and bullish candles confirm demand reaction.
• Supply Zone (Resistance): Overhead supply remains the key obstacle. A break and close above it could trigger a strong rally toward the next resistance.
Trade Setup
Parameter Level (Approx.) Description
Entry (Buy Zone) 4,230.34 Reaction from demand zone
Take Profit 1 (TP1) 4,501.59 Conservative target
Take Profit 2 (TP2) 4,576.74 Extended target
Stop Loss (SL) ~4,200.00 Below demand zone
Market Outlook
As long as the demand zone holds, the bullish structure remains valid.
A confirmed break above the supply zone could invite strong momentum toward higher targets.
Failure to hold the demand base may trigger a corrective move lower — hence, risk management remains crucial.
Bias: 🟢 Bullish
Timeframe: 4H
Strategy: Supply & Demand | Market Structure | Price Action
Gold 1H – Can Gold Hold Above 4247 as Powell Takes the Stage?XAUUSD – Intraday Trading Plan | by Ryan_TitanTrader
📈 Market Context
Gold holds firm near $4,230, with traders cautiously awaiting U.S. Retail Sales data and Fed Chair Powell’s remarks later today.
After a series of softer inflation reports, market sentiment has tilted mildly dovish — yet the U.S. dollar remains steady as investors hesitate to price in early rate cuts.
The Fed’s tone today will be critical: a hawkish Powell could trigger short-term profit-taking on gold, while any dovish signals may reignite safe-haven bids.
Expect choppy intraday movement with liquidity sweeps around key zones before a confirmed directional move emerges.
🔎 Technical Analysis (1H / SMC Style)
• The structure remains bullish, confirmed by previous Breaks of Structure (BOS) and a Change of Character (ChoCH) earlier in the week.
• Price is now approaching a premium supply zone at 4247–4249, where potential short-term sell reactions could appear before retracement.
• Below, the discount demand zone at 4184–4186 aligns with prior BOS support and acts as a high-probability reaccumulation area.
• If price revisits the buy zone and forms bullish confirmation on M15, continuation toward new highs around 4260+ is favored.
🔴 Sell Setup: 4247 – 4249
SL: 4255 – 4257
TP targets: 4210 → 4195
🟢 Buy Setup: 4184 – 4186
SL: 4174
TP targets: 4210 → 4245 → 4260+
⚠️ Risk Management Tips
• Wait for M15 BOS/ChoCH confirmation before executing either setup.
• Watch for volatility spikes around Powell’s speech and U.S. Retail Sales release — spreads may widen.
• Consider partial profits at intra-day liquidity points and trail stops once structure confirms.
✅ Summary
XAUUSD maintains its bullish structure but may face a liquidity sweep above 4247–4249 before a deeper retracement into 4184–4186.
Institutional activity could drive accumulation near the discount zone if macro data supports dovish sentiment.
The intraday bias remains “Buy the Dip”, with tactical sells possible at premium resistance for short-term scalps.

GOLD HIGH PROBABILITY SETUP SOON!!!🚨 XAUUSD HIGH PROBABILITY BUY SETUP 🚨
* Here We Can See Clearly The Next Potential Moves For GOLD Coming Hours.
* Keep Your Eyes Close On Your Trading Positions.
* Happy PIP Hunting Traders.
FXKILLA.
