Analysis of the latest gold price trends today!Market News:
Spot gold prices fluctuated at high levels in early Asian trading on Tuesday (October 21st), currently trading around $4,360 per ounce. Amidst the volatile global financial markets, gold, as a traditional safe-haven asset, has once again demonstrated its unparalleled appeal. Spot gold prices surged by over 2.5%, nearly $160, recouping all of last Friday's losses and reaching a new all-time high of $4,381 per ounce. This strong rebound in London gold prices is driven not only by strong investor expectations for further Federal Reserve rate cuts, but also by continued safe-haven demand and potential uncertainty surrounding the Sino-US trade negotiations. With the US government shutdown entering its 20th day and key economic data releases delayed, the market is highly sensitive. Gold's safe-haven properties are further amplified in the current global economic environment. Internationally, political developments in Japan and the Eurozone are also indirectly impacting the gold market. Investors should closely monitor this week's CPI data, the progress of Sino-US trade negotiations, and next week's Federal Reserve meeting, as these events will directly shape the future trajectory of gold prices. In such volatile times, gold is more than just a metal; it's an anchor of investor confidence. Faced with the potential $5,000 target, rational investment strategies may be the wisest choice at this time.
Technical Analysis:
Gold remained under pressure throughout yesterday, fluctuating around 4280. However, gold ultimately broke through the US market, driven by safe-haven buying, and surged again. This strong rally demonstrates that, as in previous sessions, gold is undergoing rapid adjustments, demonstrating its consistent strength. While the market is currently volatile, wait patiently for a pullback and continue buying. Returning to the 1-hour gold chart, the moving average continues its upward golden cross, maintaining a buy pattern. Gold prices remain strong in the short term after a strong breakout above 4325 resistance, with gold buying once again breaking through Friday's high. Following the trend, gold once again reached a new all-time high at 4381, closing with a large bullish candlestick pattern. Technically, gold retraced to support at the 5-day and 7-day moving averages, with the moving averages continuing to trend upward. Bollinger Bands on the hourly and 12-hour charts are pointing upward, with the moving averages forming a golden cross, indicating a continued trend-buying pattern. Today's trading strategy remains focused on buying low! Trading strategies suggest buying opportunities when prices dip above the 4320 support level!
Trading strategy:
Short-term gold buy at 4325-4330, stop loss at 4315, target at 4380-4400;
Short-term gold sell at 4420-4425, stop loss at 4435, target at 4360-4330;
Key points:
First support level: 4352, second support level: 4325, third support level: 4300;
First resistance level: 4380, second resistance level: 4396, third resistance level: 4420
Goldlong

Gold Bulls Still in ControlTVC:GOLD price recently swept the previous swing high around the $4,380 level, triggering a rejection as buy-side liquidity was taken. After this liquidity grab, the market attempted to extend its upward momentum but failed to break decisively above that level, resulting in the formation of a bearish order block between $4,367 and $4,372. This area has since acted as a short-term supply zone, driving price lower and guiding it back toward the bullish order block at $4,341 – $4,346 highlighted in green.
Upon retesting this demand zone, gold swept the sell-side liquidity resting beneath recent lows; however, the candle body managed to close above the zone, implying that bullish pressure remains intact despite the temporary downward movement. This reaction suggests that institutional participants may still be defending long positions within this zone, potentially accumulating orders before initiating the next upward leg.
Considering this overall market structure, price action continues to favour a bullish outlook. If the green order block holds as support, there is a strong likelihood of another impulsive move to the upside, targeting liquidity above the $4,380 – $4,400 region.

Gold Update – Key Level Respected, Here’s What’s NextGOLD (XAUUSD) Update – Reaction + Next Steps
Price played out exactly as expected from the previous idea. Gold tapped into the key demand zone, grabbed liquidity, and reacted strongly.
🟡 What Happened:
Price tested the
Liquidity lows was taken
Clear rejection with momentum showing (bullish) strength
📌 What I’m Watching Next:
If price holds above , I’ll be looking for continuation into the next psych level 4500..
If price fails to hold, a pullback retest towards is likely before another move
Waiting for a clean break + retest structure before taking a position
🎯 Trading Plan:
No rush entries – waiting for confirmation
Targeting the next PSYCHOLOGICAL LEVEL 4500 once structure is clear
Not financial advice – just how I’m reading gold right now.
Like or comment if you want updates when price taps entry levels ✅

The 4400 era is coming, and the 4500 era is just beginning.Judging from the current trend, the middle track of the hourly line and the 4H line are already around 4280. As time goes by, the lower low point is constantly rising. We can appropriately increase the expected retracement target and participate in long trading when it retraces to around 4390-4380. But at the same time, we also need to pay attention to the short-term support formed by 4330-4320. If it falls back to this level in the evening and shows a clear stop in the decline, we can also consider entering the market in advance and going long on gold in this range. The upper pressure continues to focus on 4365-4380. If gold rebounds first, you can also consider shorting gold appropriately.
OANDA:XAUUSD

Gold Breaks Out Above 4270, Targeting 43301️⃣ Market Overview
During the U.S. session, gold (XAU/USD) surged sharply, breaking above the key resistance zone of 4270–4280 and reaching 4323, its highest level of the week.
The main drivers were a weaker U.S. dollar and expectations that the Federal Reserve (Fed) may cut interest rates sooner than anticipated.
Additionally, rising geopolitical tensions in the Middle East and Trump’s latest remarks on Ukraine have strengthened safe-haven demand for gold.
2️⃣ Technical Analysis
• Main trend: Strong uptrend, breakout from the 4250–4280 consolidation zone
• Resistance: 4330 – 4345 – 4360
• Support: 4290 – 4275 – 4250
• EMA20 (H1): Strong upward slope, acting as dynamic support
• RSI (H1): Around 68, showing continued bullish momentum with a possible short-term correction
• Candlestick pattern: A bullish engulfing on the H4 timeframe confirms continuation of the uptrend.
3️⃣ Outlook
The current rally shows that buyers remain firmly in control, though after a strong breakout, gold may experience a technical pullback to 4290–4300 before advancing further toward 4330–4345.
As long as the price holds above 4290, the medium-term bullish trend remains intact.
4️⃣ Trading Strategy
🔺 BUY XAU/USD: 4299 – 4302
🎯 TP: 40 / 80 / 200 pips
🛑 SL: 4295
🔻 SELL XAU/USD: 4330 – 4333
🎯 TP: 40 / 80 / 200 pips
🛑 SL: 4337

Short-term volatility, how to plan for the next market trendGold is currently continuing its upward momentum. In the short term, we will first focus on whether gold can break through 4266. The intraday market has rebounded to this point many times and encountered resistance and fell back. If it is difficult to break through in the short term, the gold price will continue to fluctuate widely. On the contrary, if it can effectively break through 4266, continue to pay attention to the upper resistance range of 4280-4300. When the first rebound touches this resistance range, consider shorting gold in batches with light positions.
OANDA:XAUUSD

Gold Analysis: Break Above $4,293 Could Trigger a New HighHi guys!
Gold has been moving inside a clear ascending channel, respecting both its upper and lower boundaries. Recently, we saw a double top formation near the upper trendline , which triggered a corrective move down to the $4,190–$4,200 support zone, an area that has already shown strong buying interest.
After the rebound from this support, the price is now aiming toward the $4,293 resistance.
👉 If the price breaks and holds above $4,293 , it’s likely to continue the bullish momentum and head toward a new higher high inside the channel.
Overall, the structure remains bullish as long as the price stays above $4,190 , with the next key resistance at $4,293 being the level to watch for a potential continuation of the uptrend.
Gold’s bullish bias remains supported by the ongoing geopolitical tensions, uncertainty over global interest rate paths, and softening U.S. dollar. Investors are also increasingly turning to gold as a safe-haven asset, especially amid concerns about economic slowdown and central bank gold purchases remaining strong.
Disclaimer: As part of ThinkMarkets’ Influencer Program, I am sponsored to share and publish their charts in my analysis.

Gold Price Analysis - Gold Showing Strong Reversal SignsGold is currently trading around $4,230, showing a mild pullback after making an all-time high near $4,380. The market has corrected toward its main support zone around $4,120–$4,166 (Fib 0.5–0.618 region). This zone is acting as a crucial demand area, aligning with the ascending trendline, which suggests potential for bullish continuation if price holds above it.
In the short term, a retest of the support is likely before a possible bounce toward the resistance at $4,401–$4,420. If bulls regain strength above $4,250, momentum could quickly shift upward, targeting new highs. However, a confirmed 4H candle close below $4,110 may open the door for deeper correction toward $4,050–$3,950.
🔑 Key Levels to Watch
Resistance: $4,379 → $4,401 → $4,541
Main Support: $4,120–$4,166
Trendline Support: $4,100 area
🔹 Buy Zone:
- Primary Buy Zone: $4,120–$4,166 (Fib 0.5–0.618 area + trendline support)
🔹 Buy Trigger:
- Buy Trigger: Break and 4H close above $4,250
- Upside Target: $4,379 → $4,401 → $4,450
Summary
Gold remains bullish in the bigger picture but is currently in a retracement phase.
- Holding above $4,120 keeps buyers in control.
- Breaking below $4,100 turns the short-term trend bearish, opening room for a deeper correction.
Note
Please risk management in trading is a Key so use your money accordingly. If you like the idea then please like and boost. Thank you and Good Luck!

BUY GOLD - XAUUSD- Amazing low risk high reward trade!Based on our deep analysis we can see that XAU/USD (gold) will head to the upside. Great time to BUY - it has broken all major resistance levels and has nowhere else to go except upwards. It is also struggling to break past powerful support levels. Buy gold!

Gold consolidates around 4264 – safe entries within narrow range🟡 Market Overview
Gold trades around $4264/oz, showing mild bullish pressure during the European session.
The market remains range-bound but buyers still dominate slightly.
Traders are awaiting upcoming Fed remarks and US PMI data for clearer direction.
📊 Technical Analysis
• Resistance: $4272 – $4275 - $4228
• Support: $4255 – $4252 - $4290
• Price stays above EMA50 (H1), maintaining short-term bullish bias.
• Neutral RSI suggests potential sideways accumulation before breakout.
💡 Outlook
Gold is stabilizing within a tight range.
The safe plan is to wait for H1 candle confirmation at either boundary:
• Buy near $4252–$4255 if support holds.
• Sell near $4272–$4275 if rejection occurs.
________________________________________
🎯 Trading Plan
🔻 SELL XAU/USD
Entry: $4272 – $4275
🎯 TP: 40 / 80 / 200 pips
🛑 SL: $4278
🔺 BUY XAU/USD
Entry: $4246 – $4243
🎯 TP: 40 / 80 / 200 pips
🛑 SL: $4240

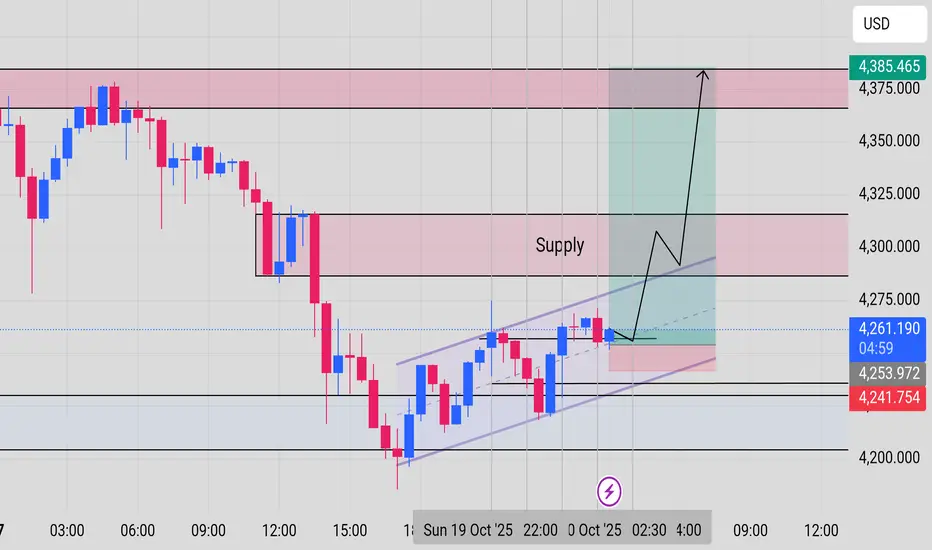
GOLD – 30m Chart Daily bias Trend : Short-term pullback inside an ascending channel, bullish bias for now
Trade Setup : Buy (Long)
Entry: ~4,261 (near channel support)
Stop-Loss: 4,241 (below recent low/support)
Take-Profit: 4,385 (next major resistance)
Key Zones:
Support: 4,254 (lower boundary of channel)
Supply/Resistance: 4,290–4,320 (may act as partial profit area)
Notes for Traders:
Buy near the lower channel line for better R:R.
Watch price reaction around supply zone; can scale out if needed.
Always respect SL to protect capital.
This content is for educational purposes and trade at your own risk
mrmoney limited XAU/USD swing trading ideaprice has reacted off our 4hour support which gave us a nice bullish momentum to the upside

Gold Trade Breakdown | Price Is Setting Up Something Big… Don’t GOLD (XAUUSD) – Super Clean Setup Forming.
I’m sharing how I’m looking to execute on this move – where price is reacting, what it’s trying to do next, and how I plan to manage my entry, stop loss and targets.
🔹 Market Structure: Price is tapping into a key zone – buyers/sellers are clearly fighting here. I’m waiting for confirmation before entering.
🔹 Idea Behind the Entry: price already retested at the extreme pont of 4h-1h structure.. not only that we clearly seeing 3 pin formation forming idea a swing low forming.. all my trade on gold is giving the same entry criteria.. but mainly just focus on price action and go with the trend and what i use most right now with gold price movement is the psychological number..
🔹 Trade Management: If price gives me my entry, I’ll secure partials at the first target and move stop loss to breakeven. Let runners target higher.
🔹 What Price Is Telling Us: Clearly building orders – this could be preparing for a strong move if momentum confirms.
Not financial advice – just sharing how I see the market and how I plan to execute it.
If you find this helpful, leave a like/comment. I’ll update if entry gets triggered ✅

Gold Nears $4500: Is $5000 the Next Magnet?Asset : XAUUSD
Current Price: ~$4254
Timeframe : Daily / Weekly
Analysis Type : Macro + Technical Momentum
🌍 Macro Drivers: Why Gold Is Defying Gravity
• Geopolitical risk premium: Middle East tensions, U.S.–China trade recalibration
• Central bank buying: China, India, and Russia accumulating at record pace
• Real yields: Still negative across major economies
• Dollar weakness: DXY softening amid fiscal uncertainty
• ETF inflows: Rebounding sharply after months of outflows
📈 Technical Structure: Parabolic Rally in Motion
• Breakout zone: $3945 (minor swing low)
• Current price: ~$4254
• Recent high: $4380.99
• Volume: Highest since 2020 pandemic rally
• RSI: Above 75—momentum strong, but nearing overbought
• MACD: Weekly bullish crossover confirmed
🧠 Sentiment Snapshot
• Retail traders chasing momentum
• Options market shows heavy call buying above $4600
• Institutional desks rotating into gold as equities stall
🛡️ Risk Management
• Trailing stop: Use 2x ATR on daily chart
• Invalidation zone: Weekly close below $4100
• Hedge strategy: Consider partial profit booking near $4625
📝 Final Thoughts
Gold isn’t just rallying—it’s repricing. With macro tailwinds, central bank flows, and technical momentum all aligned, the $5000 magnet is now in play.
📌 Follow for updates as we track this historic move.

BUY GOLD - XAUUSD- Amazing low risk high reward trade!Based on our deep analysis we can see that GOLD - XAUUSD will head to the upside. Great time to buy - it has broken major resistance levels + trends.

#XAUUSD:$4200 Almost Hit, Our New Target Is $4500! Dear Traders,
Gold has been extremely bullish since our previous analysis. The US has imposed a 100% tariff on China which has caused fear within the global trading community. Our next move is to wait for the price to retest whether minor or major. Once we have confirmation, we can target our next move.
Team Setupsfx

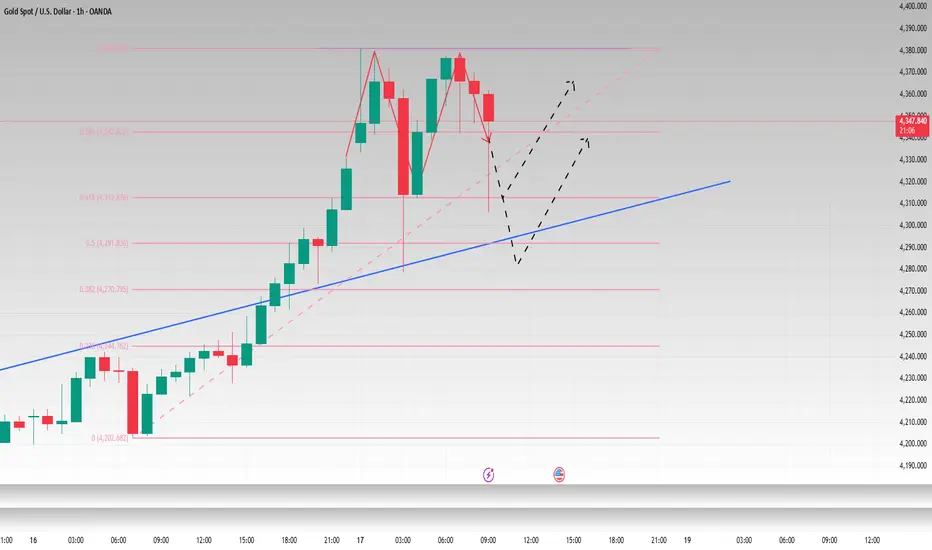
Gold 1day trade idea buy at Fib 0.32 target ATHThis is just a trade idea seperate from my weekly tradeing chart.
We are looking for a retracement to a good support level which is Fibonacci 0.382 and retrace back to the all time high for a 930 pips move.
With these sort of trades be prepared to increase your stop loss so i would advise to use your own risk management.
method trend lines and fibonacci levels.
Ill update this tomorrow AM

Gold (XAU/USD) – Bullish Rebound Expected from Key Support ZoneTechnical Structure
Uptrend Confirmation: Despite the pullback, the overall structure remains bullish — higher highs and higher lows are intact.
Support Zone (Green Box): The area between 4,132 – 4,197 acts as a strong demand region where a reversal is likely.
Target Point: The upside target lies near $4,378 – $4,381, coinciding with previous highs and resistance.
📈 Bullish Scenario
If price tests the support level and shows rejection (bullish candles or wicks), we can expect:
Entry: Around $4,160 – $4,200
Target: $4,380 – $4,381
Stop Loss: Below $4,120
This would confirm a continuation of the uptrend after a healthy correction.
📉 Bearish Scenario
If price breaks below $4,120, it could trigger:
Deeper correction toward $4,060 – $4,000
Momentum shift from bullish to short-term bearish.
🟢 Signal Summary
Direction Entry Zone Stop Loss Take Profit Confidence
BUY (Long) $4,160 – $4,200 $4,120 $4,380 ⭐⭐⭐⭐ (Strong if support holds)
⚠️ Conclusion
Gold is showing signs of retracement within an uptrend.
If the support zone holds, we can expect a bullish reversal toward the $4,380 target point.
However, a break below $4,120 will signal a deeper correction before any new rally.

GOLD Support Ahead!
HI,Traders !
#GOLD keeps falling but
A strong horizontal support
Level is ahead at 4173.32
From where we will be
Expecting a rebound
And a local bullish move up !
Comment and subscribe to help us grow !

Gold Healthy PullbackGold is taking a short breather after a strong rally. Price recently tapped near the $4,230 zone before showing its first meaningful pullback in days.
The 33 EMA (pink line) is acting as dynamic support, if the price holds above it, we could see another leg higher toward the $4,280–$4,320 range. However, if that level breaks cleanly, the next strong demand sits around $4,020, where both the 100 EMA and previous accumulation zone align.
In simple terms, this is a healthy correction within a bullish trend. A bounce from either the 33 EMA or 100 EMA could easily trigger the next push upward.

Gold Consolidates After Hitting Record High–Uptrend Still Intact🔸 1. Market Overview
After reaching a new all-time high at 4,383, gold saw a sharp drop to 4,278, losing over 100 USD/oz before recovering. The price is now sideways within the narrow range of 4,340 – 4,350, reflecting short-term consolidation after strong volatility.
Traders are awaiting further signals from the Federal Reserve (Fed) regarding rate cuts, while geopolitical tensions and safe-haven demand continue to support gold in the medium term.
📊 2. Technical Analysis
• Immediate Resistance: 4,355 – 4,370
• Major Resistance: 4,382 (all-time high)
• Near Support: 4,330 – 4,320
• Key Support: 4,278
The EMA 50–100 continues to trend upward, confirming that the main trend remains bullish.
RSI (H1/H4) has returned to a neutral zone, showing temporary balance between buyers and sellers.
💡 3. Outlook
Gold is consolidating after a correction, and if the price holds above 4,320, the uptrend may resume toward 4,380 – 4,400.
Conversely, a break below 4,320 could trigger further short-term profit-taking toward 4,278.
🎯 4. Suggested Trading Strategy
🔺 BUY XAU/US: 4,335 – 4,330
🎯 TP: 40 / 80 / 200 pips
🛑 SL: 4,327

It is not a reversal callback correction to continue to buyGold gapped up at the opening, touched 4379 and then plunged nearly $100 before rebounding quickly. The fluctuations in the Asian session alone are so drastic. In addition, today is Friday and there is a risk of market closure, so intraday trading needs to be more cautious.
From the news perspective, the expectation of a Fed rate cut provides liquidity support, Sino-US trade tensions and geopolitical risks stimulate safe-haven demand, and the weakening of the US dollar and economic uncertainty amplify the appeal of gold. Many investors continue to increase their holdings of safe-haven assets in a complex macroeconomic context, providing solid and strong support for the rise of gold.
Although short-term prices fluctuate frequently, they have not fallen below the daily MA5 and MA10 moving averages. Therefore, it should not be regarded as a trend reversal, but a market shakeout. Therefore, we maintain a trading strategy that is mainly bullish and supplemented by short selling.
From a fundamental perspective, multiple rebound attempts failed to break through, making the upper 4380-4400 range a short-term resistance range. The short-term trend has the tendency to form an M top, so I will give several long trading opportunities during the day.
First of all, we should pay attention to the first support formed by 4315-4305 below, which is also the 61.8% retracement position of gold. If it repeatedly circles this position in the short term without breaking, we can try to go long on gold. For the second chance, I would give the support level of 4290-4280 below, which is near the trend suppression and the 50% dividing line, as well as the 4H MA10 moving average. I think we can try to go long on gold again within this range. The last chance I would give is around 4200, the starting point of this round of rise. Even if gold retaliates and falls, we can still maintain good trading opportunities.
During the day, we can go long on gold in batches according to the strength of gold's retracement.
OANDA:XAUUSD
BUY XAUUSD (GOLD)Based on our deep analysis we can see that gold (XAUUSD) will keep heading to the upside.... BUY!
