Goldlong

Gold surges to $4,218 – The bullish wave shows no sign of ending💹 Market Overview
Gold continues its impressive rally, now trading around $4,218/oz, marking a new all-time high.
The main catalyst comes from expectations that the Federal Reserve (Fed) may begin its rate-cutting cycle sooner than expected, following dovish comments from Chair Jerome Powell.
The U.S. dollar weakened further, and Treasury yields declined, boosting safe-haven demand for gold.
Additionally, geopolitical tensions in the Middle East and ongoing U.S.–China trade uncertainties continue to support buying interest in the precious metal.
📊 Technical Analysis
• Main trend: Strong uptrend, price remains above all EMA 20/50/100 levels, confirming solid bullish momentum.
• Key resistance: 4218 – 4225 – 4250
• Short-term support: 4205 – 4200 – 4185
• RSI (H1/H4): Still in the overbought zone (>75), signaling potential for a minor pullback in the short term.
• Volume: Rising along with the breakout — confirming strong and active buying pressure.
🔎 Outlook
Gold is currently in an extended bullish phase, with the 4200–4185 zone acting as key support.
As long as the price holds above 4200, the uptrend is likely to continue toward 4235–4250 in the next session.
However, traders should be aware of potential technical corrections due to overbought conditions.
🎯 Trading Strategy
🔺 BUY XAU/USD : 4206–4203
🎯 TP: 40 / 80 / 200 pips
🛑 SL: 4200

BUY GOLD Gold will be buying and I’ve set a buy limit to make sure I’ll be able to catch it at the right time join in with me but keep it all professional and not too risky as we are following the trend

Bullish Gold (XAUUSD)The following are my reasons to buy:
* Bull Trend;
* Price is seating at a strong support between 2.882,46 - 2,890 levels following with wick rejections on H4;
* Price is above 50 on RSI;
* On the LTF (30min) the price crossed up on MACD ;
* USA yields are pushing lower, since Gold is a safe heaven, it will tend to go up.

Gold Hits New All-Time High– The Bullish Wave Isn’t Over Yet📊 Market Overview
Gold prices continued to surge during the Asian and early European sessions today, officially reaching a new all-time high at $4,190/oz.
The main drivers are expectations that the Federal Reserve (Fed) may start cutting interest rates earlier than expected, along with strong safe-haven demand amid escalating geopolitical tensions in the Middle East.
Falling U.S. bond yields and a weaker U.S. dollar have further reinforced gold’s bullish momentum, pushing the metal beyond resistance levels once considered “unbreakable.”
📈 Technical Analysis
• Main Trend: Strong bullish momentum; price remains above all short- and mid-term EMAs (EMA20, EMA50, EMA100).
• Key Resistance: 4190 (new high), 4210, 4250.
• Short-Term Support: 4168, 4150, 4125.
• RSI (H1/H4): Staying in the overbought zone (> 60) with no clear bearish divergence yet.
• Volume: Increasing alongside breakout — confirming genuine buying power from the market.
💡 Outlook
Gold is currently in a powerful breakout phase, and the new record at 4190 could just be the start of another bullish leg if the 4168–4150 zone holds firm.
However, a short-term technical pullback remains possible as RSI readings stay elevated.
Traders should prioritize buy-on-dip strategies and avoid FOMO entries at highs without confirmation signals.
🎯 Trading Plan
🔺 BUY XAU/USD : 4168–4165
🎯 TP: 40 / 80 / 200 pips
🛑 SL: 4162

Setting new highs, it is right to go long on the pullbackI reminded everyone yesterday that once the W-shaped formation is confirmed and structural support is provided for the bulls, the upward trend will continue. The final result is in line with our expectations again. Gold is still fluctuating upward. If this trend continues, it is expected to reach 4210-4230.
As the price of gold continues to rise and returns to a unilateral upward trend, the short-term highs and support are also moving up. From the perspective of the big cycle trend, the current daily MA5 moving average and the 4H middle track have also come to around 4088-4090, which is also the position that short-term bulls need to focus on defending. Before failing to effectively fall below this position, we can still maintain the bullish trend unchanged, and any decline can be regarded as an opportunity for bulls to enter the market.
Judging from the hourly chart, the current gold price has reached the 42,000 integer mark. The continuous upward fluctuation has caused the current technical indicators to enter the overbought risk zone. Do not blindly chase the rise in the short term and be alert to the market's potential correction demand. The short-term support can be seen at 4180-4165. If gold subsequently falls back to this short-term support, we can consider continuing to go long on gold.
OANDA:XAUUSD
Is Gold XAUUSD due for a Retrace? VWAP & Volume Profile Plan🏆 Gold (XAUUSD) Market Update 🏆
Gold (XAUUSD) has rallied strongly and is now pushing into new highs 📈. In my view, price looks overextended — when applying the VWAP indicator, we can clearly see that price has stretched three deviations away from VWAP ⚖️.
I’m also analyzing the Volume Profile to identify value areas that could serve as key support zones on any retracement 🔍. While my overall bias remains bullish, I’d like to see price return to equilibrium — roughly the 50% retrace of the recent price swing (on the 4-hour timeframe, measured from the order block low) 📊.
Additionally, I’m observing a potential Three-Drive Pattern forming, which could hint at a short-term correction before any continuation higher 🔄.
⚠️ Disclaimer: This content is for educational purposes only and not financial advice.

Gold (xauusd): still bullishHello guys!
Gold (XAU/USD) is showing a strong bullish trend on the 30-minute chart, but we can see that the upward trendline has recently been broken. Despite this, the price is approaching a key support zone between 4,086 and 4,058 (highlighted in blue), which has held as a strong buying area in the past.
Currently, the market could play out in two scenarios:
Blue scenario – A shallow pullback from the current price down to the support zone, followed by a rebound.
Red scenario – A slightly deeper retracement, touching the lower end of the support zone before buyers step in.
In both cases, this support area is likely to act as a strong demand zone, providing a good opportunity to enter long positions . The overall bullish trend remains intact, so the expectation is that after this retracement, the price will continue upward toward 4,180 and beyond.
✅ Key levels to watch:
Support: 4,086 – 4,058
Resistance: near 4,180 (next target)
Trading plan: Wait for the price to approach the blue support area and look for bullish confirmation (reversal candlestick, bullish engulfing, or strong buying volume) to enter long positions.
Disclaimer: As part of ThinkMarkets’ Influencer Program, I am sponsored to share and publish their charts in my analysis.

Gold Is on Fire: Can XAU/USD Hit $4130 Gold’s price is really strong right now. As long as gold stays above $4000, it can move up to $4130. But if gold drops below $4000, it could slow down or even start to fall.
What do you think will happen next, do you think gold will keep going up or fall back down? Have you ever watched gold make a big move before?
If you want to know what to do or have any questions, just ask me! Sometimes a simple question can help you learn something new about trading gold. What do you want to know about gold today?
Mindbloome Exchange
Trade Smarter Live Better

Gold as a Safe Haven Asset During Market Uncertainty1. The Historical Role of Gold as a Store of Value
Gold’s reputation as a safe haven asset is deeply rooted in history. Long before modern currencies were created, gold was used as money due to its rarity, durability, and universal acceptance. Empires and civilizations—from the Romans to the Chinese—recognized its intrinsic value. Unlike paper currencies, which can lose value due to inflation or political manipulation, gold has maintained its purchasing power over centuries. This enduring legacy has built investor confidence, making gold the ultimate hedge against economic collapse or monetary instability.
2. Gold’s Relationship with Inflation and Currency Devaluation
One of the key reasons investors flock to gold during uncertainty is its ability to preserve value during inflationary periods. When central banks print excess money or economies experience hyperinflation, the real value of currency declines. Gold, on the other hand, cannot be printed or artificially inflated. Its supply grows slowly through mining, keeping its scarcity intact. Historically, during times of high inflation—such as the 1970s oil crisis—gold prices surged as investors sought protection from declining fiat currency values.
3. Gold’s Performance During Financial Crises
Gold tends to perform strongly during financial market crises. For instance, during the 2008 Global Financial Crisis, stock markets around the world plummeted, yet gold prices surged from around $700 to over $1,200 per ounce in the following years. Investors shifted their capital from volatile equities and collapsing real estate markets into gold as a safer store of wealth. Similarly, during the COVID-19 pandemic in 2020, when uncertainty and market panic dominated, gold reached a record high of over $2,000 per ounce, reinforcing its role as a safe haven asset in times of chaos.
4. Gold’s Role in Portfolio Diversification
In investment strategy, diversification is key to managing risk. Gold often acts as an effective hedge because it has a low or even negative correlation with traditional asset classes like equities or bonds. When markets are in turmoil, stocks often decline, but gold tends to rise or remain stable. By including gold in a portfolio, investors can reduce volatility and overall risk exposure. Institutional investors, mutual funds, and even central banks include gold as a strategic component to ensure portfolio stability during downturns.
5. Gold as a Hedge Against Geopolitical Risk
Geopolitical instability—such as wars, trade conflicts, or political crises—creates uncertainty in global markets. During such times, currencies fluctuate, stock indices decline, and investor confidence weakens. Gold often becomes the preferred asset during these events because it is not tied to any one government or economy. For example, during the Russia-Ukraine conflict in 2022, global demand for gold increased as investors sought refuge from potential currency devaluation and market disruptions. Its universal acceptance makes it a neutral and borderless asset that retains value regardless of political boundaries.
6. Central Bank Policies and Their Impact on Gold
Central banks play a major role in influencing gold prices. When central banks adopt expansionary monetary policies—such as lowering interest rates or increasing money supply—gold prices often rise. Low interest rates reduce the opportunity cost of holding non-yielding assets like gold, making it more attractive to investors. Additionally, when central banks themselves buy gold, it signals trust in its long-term value. In recent years, emerging economies like China, India, and Russia have increased their gold reserves to diversify away from U.S. dollar dependence, strengthening gold’s status as a global reserve asset.
7. Investor Psychology and Market Sentiment
Gold’s appeal is not just economic—it’s psychological. During times of fear or uncertainty, investors instinctively move toward tangible assets that they can trust. Gold’s physical nature and intrinsic value give it emotional security that paper assets lack. This “flight to safety” effect means that when news of market instability spreads, investors collectively buy gold, driving up its price. This psychological factor reinforces the cycle of gold appreciation during uncertain times, as more people seek safety in an asset they perceive as stable and permanent.
8. Gold vs. Other Safe Haven Assets
While gold is the most well-known safe haven asset, others—like the U.S. dollar, Swiss franc, or U.S. Treasury bonds—also attract investors in crises. However, gold holds unique advantages. Unlike currencies, which can be manipulated through monetary policy, gold’s value is independent of any central authority. It is also free from credit risk, meaning it cannot default like bonds. Furthermore, unlike real estate or commodities like oil, gold is highly liquid and portable. This makes it an ideal asset for immediate protection and long-term wealth preservation during global financial stress.
9. Technological and Industrial Demand Supporting Gold Prices
Beyond its financial role, gold has growing industrial and technological applications, especially in electronics, renewable energy, and medical devices. Its conductivity and resistance to corrosion make it a critical material in high-tech industries. This real-world demand adds a fundamental layer of value to gold, ensuring that its price is not solely dependent on investor sentiment. Jewelry demand—especially from countries like India and China—also supports its global market stability. Together, these factors create a strong baseline for gold prices, even when financial markets are calm.
10. The Future Outlook for Gold as a Safe Haven
Looking ahead, gold’s role as a safe haven is expected to remain strong. In a world marked by rising geopolitical tensions, digital currency volatility, and potential economic slowdowns, investors will continue viewing gold as a stabilizing force. The rise of digital gold and gold-backed exchange-traded funds (ETFs) has made it easier for retail investors to participate in the gold market. Moreover, as global debt levels rise and faith in fiat currencies weakens, the demand for gold is likely to persist. Even in an increasingly digital economy, gold’s timeless appeal as a tangible, limited, and universally trusted asset ensures its continued relevance.
Conclusion
Gold’s reputation as a safe haven asset is well-deserved and time-tested. It offers protection against inflation, currency devaluation, market volatility, and geopolitical instability. Its scarcity, universal acceptance, and psychological comfort make it a unique hedge in uncertain times. Whether held by individuals, institutions, or central banks, gold continues to shine as a reliable symbol of stability and security.
In a global economy where uncertainty is the only constant, gold stands as a timeless reminder that true value endures beyond market cycles and monetary systems. For investors seeking long-term security amid financial turbulence, gold remains the ultimate safeguard of wealth.

GOLD Intraday Chart Update for 15 Oct 25GOOD Morning Traders,
As long as GOLD sustains above 4080 FMP Level it will remains bullish however the only way to join Trend Rally is following Psychological Levels with 3080 chain
Major Support zone for the day is located @ 4130-4150 below this zone GOLD will move Towards 4100 or even 4080
Above 4150 Psychological Level GOLD Next Target will be 4230 FMP Level or even 4250
Disclaimer: Forex is Risky

XAUUSD – Continues to set ATHXAUUSD – Continues to set ATH, prioritize buying according to POC 4,146–4,148 🟡
Gold continues to create higher highs after a strong rally in the Asian session; the upward channel structure remains intact. On H1, POC ~4,147–4,148 is the nearest support; above is the resistance cluster according to FE 1.618 ~4,186 and the sell zone 4,221–4,240.
Key levels
Support: 4,146–4,148 (POC) • 4,140 (short-term invalid).
Resistance/targets: 4,166 • 4,186 (FE 1.618) • 4,188–4,200 • 4,221 (sell scalping) • 4,240 (sell zone).
Trading scenario
Buy 1 – POC pullback
Entry 4,146–4,148 | SL 4,140 | TP 4,166 → 4,188 → 4,200 → 4,245.
If it pulls back to POC and H1 shows a confirmation candle/mid-trendline support, prioritize buying.
Buy 2 – Shallow retest
If the price only dips ~4,160–4,162 and then bounces back above POC, consider adding buys with SL 4,152, TP as above.
Sell reaction (higher risk)
Entry 4,240 | SL 4,250 | TP 4,222 → 4,200 → 4,188 → 4,160.
Only activate when there is a clear rejection signal at 4,221–4,240; this is a counter-trend trade.
Invalidation & management
Buying bias weakens when H1 closes below 4,140 or breaks the lower channel edge.
After TP1, move SL to entry; avoid chasing price in the 4,18x–4,20x area when volume is thin. 🎯
Quick context
The upward momentum is maintained thanks to expectations of the Fed ending QT/loose conditions soon and safe-haven flows; however, the 4,221–4,240 area may create short-term reactions before the uptrend extends.
Trade well with this scenario!

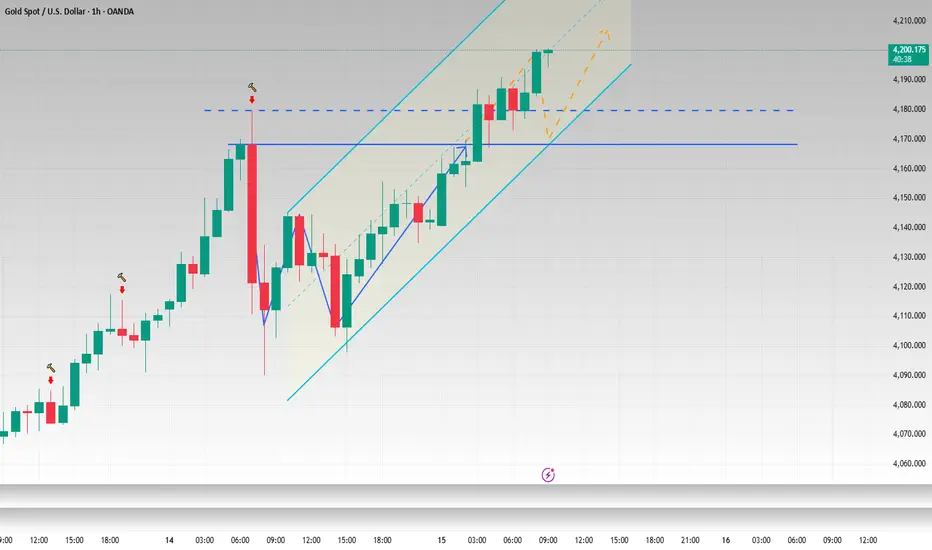
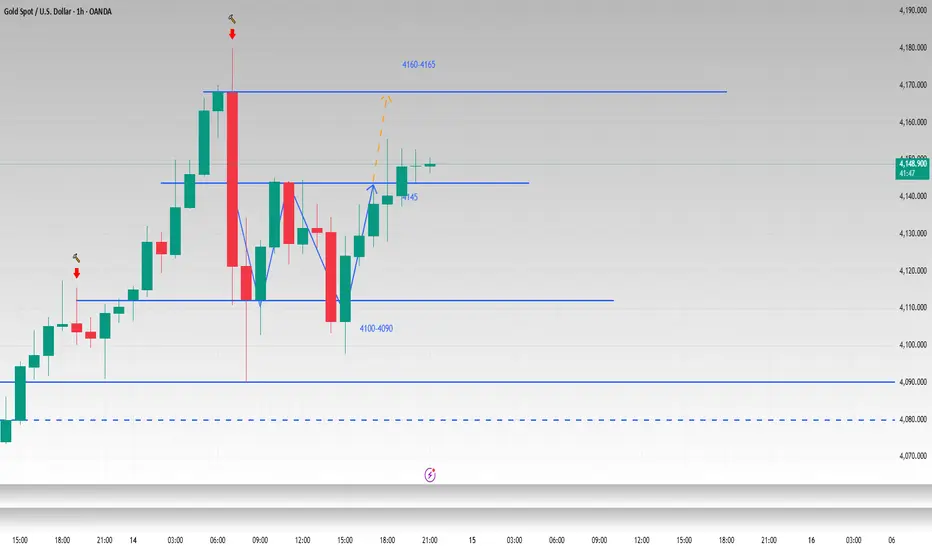
W pattern is established and the bullish pattern remain unchangeI have said before that gold is in a fluctuating upward state whether viewed from the weekly or daily charts, and there is no reversal signal. I mentioned in my previous post that from the hourly chart, gold has the prototype of a W shape, and the neckline is at 4145. In the evening of the US session, gold successfully broke through the neckline and touched around 4155. Although the bullish momentum of gold has stagnated slightly after a slow rise, I am still optimistic that gold will reach 4160-4165. If it falls back to around 4145-4135 again, we can still consider trying to go long on gold.
OANDA:XAUUSD
Gold rebounds, uptrend intact1. Market Overview
After a brief dip to $4090, gold (XAU/USD) quickly rebounded strongly to around $4125, showing that buying pressure is still dominant.
Safe-haven demand remains solid as the USD stabilizes and U.S. Treasury yields ease slightly.
However, traders are now more cautious after the previous sharp volatility, keeping gold in a short-term accumulation phase around $4110–$4130.
2. Technical Analysis
• Near Resistance: $4132 – $4140
• Strong Resistance: $4155 – $4168
• Near Support: $4105 – $4090
• Deep Support: $4078 – $4060
• RSI (H1): 58 – Neutral, slightly bullish bias
• EMA20 (H1): $4110 – Trending upward, acting as dynamic support
• Price Structure: Higher low on H1 → confirms continuation of the bullish trend
3. Outlook
Gold remains in a strong bullish structure, and the recent decline is seen as a technical pullback for reaccumulation.
If the price holds above $4110, gold is likely to continue rising toward $4140–$4155 in the next sessions.
Conversely, a break below $4090 would signal a deeper correction toward $4075.
4. Trading Strategy
🔺 BUY XAU/USD
Entry: 4110 – 4105
🎯 TP: 40 / 80 / 200 pips
🛑 SL: 4100
🔻 SELL XAU/USD
Entry: 4150 – 4155
🎯 TP: 40 / 80 / 200 pips
🛑 SL: 4159

Gold weekly forcast with buy and sell levels Las week was the 16th week in a row that we made a profit 1650 pips from entry
full disclosure i closed at 600 pips
This analysis is based on the provided 1-hour XAUUSD (Gold Spot / U.S. Dollar) chart, which shows price action up to approximately October 11, 2025, 16:40 UTC+1. The chart includes Fibonacci Retracement levels applied to a recent strong down move (from 4058.111 down to 3943.547) and identifies potential entry/exit zones.
## Current Market Context (1-Hour Timeframe)
**Price Action:**
The chart shows a significant price drop from a recent high of approximately $4,058, sharply correcting to a low around $3,943. Since hitting the low, the price has been recovering, and the recent candles show strong bullish momentum attempting to push through resistance levels related to the retracement.
**Fibonacci Retracement:**
The retracement is drawn from the swing high (1 or 100%) at **$4,058.111** down to the swing low (0 or 0%) at **$3,943.547**. The current price is hovering between the 50% and 61.8% retracement levels, fighting to hold above the 50% level.
**Key Levels (Based on Fib Retracement):**
| Fib. Level | Price (USD) | Significance |
| :---: | :---: | :--- |
| 100% (High) | $4,058.111 | Major resistance, swing high. |
| 78.6% | $4,08.594 (Typo in OCR, likely $4,038.594 based on visual) | Strong resistance zone. |
| **61.8%** | **$4,014.347** | **Crucial reversal/continuation level (Golden Ratio). The price is currently near this level.** |
| **50.0%** | **$4,000.829** | **Psychological and technical midpoint ($\mathrm{$4,000}$).** |
| 38.2% | $3,987.310 | Minor support after bounce. |
| 23.6% | $3,970.584 | Minor support. |
| 0% (Low) | $3,943.547 | Major support, swing low. |
---
## Buy Levels (Bullish Bias)
A bullish scenario requires the current upward momentum to continue, breaking through the immediate resistance barriers.
**1. Immediate Confirmation Buy (Aggressive/Trend Following):**
* **Target Buy Zone:** **Above $4,024** (Marked as "Buy 4024" on the chart).
* **Rationale:** This area lies just above the 61.8% Fibonacci level ($4,014.347) and likely represents a small resistance zone or previous pivot point. A decisive close above $4,024 signifies strong control by buyers and targets a move toward the 78.6% retracement.
* **Potential Targets:** $4,038.594 (78.6% Fib), followed by $4,050 and the old high at $4,058.111.
**2. Retracement Buy (Conservative/Pullback):**
* **Target Buy Zone:** Near **$4,008** (Previous resistance/support area, near the 50% Fib or labeled Sell level). If the price holds above the 50% Fib ($4,000.829) after touching $4,024 and corrects back down.
* **Rationale:** Buying the retest of the $4,000–$4,008 psychological and technical support region, confirming the breakout above the 50% level.
---
## Sell Levels (Bearish Bias)
A bearish scenario involves the price failing to sustain the current rally and rejecting the key Fibonacci resistance levels, leading to a continuation of the prior downtrend.
**1. Immediate Confirmation Sell:**
* **Target Sell Zone:** **Below $4,008** (Marked as "Sell 4008" on the chart).
* **Rationale:** Failure to hold the 61.8% Fib and a break below the $4,008 level (which is slightly above the $4,000 psychological level/50% Fib) would confirm a rejection of the recovery attempt.
* **Potential Targets:** $3,994, $3,987.310 (38.2% Fib), and $3,970.584 (23.6% Fib).
**2. Continuation Sell (Strong Breakdown):**
* **Target Sell Zone:** A confirmed break and close below the **$4,000.00** psychological level, or specifically below the **38.2% Fib ($3,987.310)**.
* **Rationale:** A move below $3,987 would indicate sellers are aggressively resuming control, likely targeting the low established at $3,943.547.
---
## Technical Outlook Summary
| Scenario | Trigger | Immediate Resistance/Support | Key Target |
| :--- | :--- | :--- | :--- |
| **Bullish** | Sustained close **above $4,024**. | $4,038 (78.6% Fib) | $4,058 (Recent High) |
| **Bearish** | Confirmed move **below $4,008** (and 61.8% Fib). | $4,000 (50% Fib Support) | $3,987 (38.2% Fib) / $3,943 (Swing Low) |
$4,008 and $4,024 appear to be the crucial short-term flip zones determining the next major directional move on this 1-hour chart. The current price is consolidating just around the 61.8% retracement level, making the next few candles critical for confirming direction.

Gold’s Bull Run Continues – Target $4,080+Gold is clearly maintaining strong bullish momentum above $4,000. The market has maintained its upward trajectory since rebounding from the $3,900–$3,920 support zone. This zone acted as a solid demand area, leading to consistent higher highs and higher lows — a clear indication that buyers are dominating.
The recent price action shows a clean breakout above the $3,980–$4,000 resistance area, which has now turned into a new short-term support. The chart also marks a “Weak High” near the current level, suggesting that a minor pullback or consolidation could occur before another bullish push resumes. This retracement could test around $4,010–$4,020 before aiming higher.
The next major resistance levels are visible at $4,060, $4,075, and potentially $4,080–$4,100, which could be the next targets if bullish momentum continues. As long as gold stays above $4,000, the overall market bias remains positive. A sustained break below this zone might trigger a deeper correction toward $3,960 or even $3,940, but that currently looks less likely given the strong bullish structure.
In summary, the short-term outlook remains bullish with expectations of a possible brief dip before continuation toward $4,080+. The trendline support and consistent break of minor resistances confirm strong buyer confidence in the market.
Strong bullish trend continues
Key resistance: $4,072 → $4,132 → $4,150
Support to watch: $3,976 → $3,925
🔹 Buy Zone:
A potential buy zone lies between $4,010 – $4,025, where a short retracement is expected before the next upward move. This area aligns with minor structure support and trendline confluence, making it ideal for re-entry or fresh long positions.
🔹 Buy Trigger:
A strong buy trigger would be a bullish 1-hour candle closing above $4,045, confirming momentum continuation toward the next resistance targets at $4,065, $4,075, and $4,080+.
Note
Please risk management in trading is a Key so use your money accordingly. If you like the idea then please like and boost. Thank you and Good Luck!

Gold Analysis: Will Buyers Push the Price to 4,150?Hello everyone, Kilian here!
XAUUSD is currently trading within a well-defined ascending channel, with price action consistently respecting both the upper and lower boundaries of the channel. This stability indicates that the market is following a sustainable uptrend, and it’s no surprise that investors remain confident in the strength of the buyers.
Price Action and Growth Potential
Recently, price action has clearly shown that buyers are in control. The strong bullish momentum could lead to a significant breakout, potentially breaking through the resistance zone that has been hindering the price's upward movement. If this happens, XAUUSD could continue its uptrend, with a retest of the support level before advancing further.
A successful retest would further strengthen the bullish trend and potentially spark a powerful move toward the 4,150 target, which aligns with the upper boundary of the ascending channel.
Potential Risks and Key Factors to Watch
However, we cannot overlook the possibility that the price might fail to break through the strong resistance zone. If this occurs, it could signal that bullish momentum is weakening. In this case, there might be a retracement, with the next target being the support zone at the lower boundary of the channel.
Tips for Traders
As always, the most important thing in trading is to confirm your setups and manage your risk properly. Whether or not this scenario plays out, being prepared for every situation will help you minimize risks and optimize your profits.

Gold hits new high at $4180, correction risk rising1. Market Overview
During the mid-day session on October 14, gold prices (XAU/USD) continued their upward momentum, reaching $4180/oz, setting a new all-time high.
The main drivers remain expectations of a Federal Reserve policy easing and strong safe-haven demand amid rising geopolitical tensions.
However, after breaking above $4175 and testing $4180, the market is showing signs of mild profit-taking, indicating that bullish momentum is temporarily slowing.
2. Technical Analysis
• Strong Resistance: $4180 – $4192
• Near Support: $4165 – $4158
• Deep Support: $4142 – $4130
• RSI (H1): 81 – Clearly overbought
• EMA20 (H1): $4158 – Acting as dynamic support
• Candlestick Pattern: Consecutive long upper wicks near $4175–$4180 → signal short-term correction pressure.
3. Outlook
Gold continues to hold a very strong bullish trend, but the risk of a technical correction is rising as the market becomes heavily overbought across multiple timeframes.
The $4180–$4192 zone now serves as a key short-term resistance area that may trigger selling pressure.
If the price fails to close an H1 candle above $4180, a pullback toward $4165–$4155 is likely.
Conversely, a break above $4192 with strong volume could push gold toward $4205–$4215 in the short term.
4. Trading Strategy
🔺 BUY XAU/USD: $4158 – $4155
🎯 TP: 40 / 80 / 200 pips
🛑 SL: $4152
🔻 SELL XAU/USD: $4190 – $4193
🎯 TP: 40 / 80 / 200 pips
🛑 SL: $4196

XAUUSD: Scalp trading plan for today's trading sessionOANDA:XAUUSD unexpectedly had a sharp pullback after reaching the 4179 high, this is not surprising because such sharp corrections often occur during the recent uptrend.
Right now we will look for strong support zones to seek rebound buy setups while the market is highly volatile.
According to my monitoring of the CME Options market, today we will have the following potential support zone:
The Margin Zone at contains heavy liquidity (calculated based on the Options market).
Margin zone resistance:
Strong support:
The strong support at overlaps the Margin Zone. Therefore, this may be where price heads and bounces.
Sell scalp at resistance:
Resistance:
Victor Dan @ ZuperView

Gold 1H – Price Reaction Ahead of U.S. Retail Sales & Fed RemarkXAUUSD – Intraday Trading Plan | by Ryan_TitanTrader
📈 Market Context
Gold is trading around the $4,110 mark, consolidating after a strong impulsive rally earlier this week.
Traders are now shifting focus to U.S. Retail Sales data and a series of Federal Reserve remarks due later today — both key drivers that could influence near-term expectations for the next rate decision.
After last week’s soft inflation signals, gold initially extended higher, but rising Treasury yields and cautious sentiment ahead of today’s macro releases have slowed momentum.
Any hawkish Fed tone or stronger consumer spending data could weigh on XAUUSD, triggering a liquidity sweep from the premium zones before the next accumulation phase begins.
🔎 Technical Analysis (1H / SMC Style)
• Structure shows a confirmed BOS on lower timeframes, signaling the end of the previous impulsive leg.
• Price currently sits within a Mitigation Zone (4117–4110), reacting to prior imbalance after a clean sweep of internal liquidity.
• The Premium Liquidity Zone (4217–4215) aligns with a Rejection Block and is likely to act as a short-term Sell Zone.
• Below, the 4056–4058 area marks a Buy-Side Support, overlapping with a previous ChoCH and internal discount OB.
• Expect a short-term sell reaction from premium zones before a possible bullish mitigation bounce off support.
🔴 Sell Setup: 4217–4215
SL: 4224
TP targets: 4200 → 4175 → 4160
🟢 Buy Setup: 4056–4058
SL: 4050
TP targets: 4070 → 4090 → 4100+
⚠️ Risk Management Tips
• Wait for M15 ChoCH / BOS confirmation before executing either setup.
• Be cautious during Fed remarks — volatility spikes are common around liquidity levels.
• If price reacts impulsively from 4217 with displacement, partial shorts are favored.
• Conversely, if 4056 holds and forms clean bullish structure, it could serve as the base for the next expansion leg.
✅ Summary
Gold is likely to engineer a liquidity grab in the premium zone (4217–4215) before retracing into the mitigation area near 4056–4058, where smart money may accumulate long positions.
The day’s direction will hinge on how markets interpret upcoming U.S. Retail Sales data and Fed tone — expect volatility and false breaks before the true directional move forms.

Gold Next Move : 4222? NEW ATH CONTINUOUSLY ?Gold Currently Runs On The Bullish Channel
We Are Considering Bullish Setup On RBS Pull Back Buy Zone
Area To Buy 4060 / 4050
Pullback Buy
Target Bullish Setup 4220 - 4250
Lets Gooo NEW ATH GOLD

Gold 1H – Potential Liquidity Sweep Before Fed SpeechesXAUUSD – Intraday Trading Plan | by Ryan_TitanTrader
📈 Market Context
Gold remains steady near $4,065, as traders eye upcoming U.S. PPI data and Fed officials’ speeches later today for new guidance on the inflation outlook.
The recent rise in Treasury yields has slightly capped gold’s upside momentum, but underlying safe-haven demand persists amid ongoing geopolitical and economic uncertainty.
If the PPI print shows softer inflation, gold could attract renewed buying; however, a hotter reading may spark another liquidity sweep lower before any sustained rally.
🔎 Technical Analysis (1H / SMC Style)
• ChoCH confirmed at 4060+, showing potential exhaustion in the current short-term uptrend.
• Price tapped the premium zone (4080–4078), aligning with previous liquidity and imbalance — ideal for a short-term sell setup.
• A BOS formed at 4017, opening the way for retracement toward the discount zone (3999–3997).
• The 3997–3999 area is a strong demand zone, overlapping with a prior ChoCH and liquidity void — a potential reversal area for bulls.
• Expect a liquidity grab at 3990 before a bullish reaction if structure holds.
🔴 Sell Setup: 4080–4078
SL: 4087
TP targets: 4040 → 4015 → 4000
🟢 Buy Setup: 3999–3997
SL: 3990
TP targets: 4035 → 4060 → 4100+
⚠️ Risk Management Tips
• Wait for M15 ChoCH / BOS confirmation before triggering entries.
• Avoid over-leverage during Fed speech hours — price may fake out around liquidity levels.
• If price sweeps 4080 liquidity and rejects impulsively, partial short entries are favored.
• Conversely, if 3997 holds firm with strong bullish structure, watch for re-entry confirmation to ride the next expansion.
✅ Summary
Gold is currently playing within a premium-to-discount framework, as smart money may engineer a sweep of 4080 liquidity before driving price down toward 3997–3999 to collect buy-side orders.
After that, a strong bullish reaction is expected from the demand zone if macro conditions (like soft PPI or dovish Fed tone) support it.
Stay patient — structure confirmation is key before entering either direction.

Gold rebounds – Market eyes the $4090–$4100 target📊 Market Overview:
After hitting a new record high at $4,078/oz, gold briefly pulled back to $4,067 before rebounding to $4,075, showing strong buying interest 💰.
Risk aversion remains elevated amid ongoing US–China trade tensions and geopolitical uncertainty.
🧭 Technical Analysis:
• Trend: Strong bullish on H1–H4
• EMA: Price remains above EMA20–50 cluster → short-term uptrend intact
• Resistance: $4,078 – $4,095
• Support: $4,060 – $4,048
• Candle pattern: Bullish rejection candle near $4,067 confirms active buyers
• Momentum: RSI near 68 – strong, not yet overbought
💡 Outlook:
Gold is retesting the $4,078 peak; if an H1 candle closes firmly above it, the next target lies at $4,090–$4,100 🎯.
Otherwise, a short-term pullback toward $4,060–$4,050 could occur before another rally attempt.
________________________________________
🔺 BUY XAU/USD
Entry: $4.069 – $4.072
🎯 TP: 40 / 80 / 200 pips
🛑 SL: $4.066
