GOLD Hello friends
Given that the price has reached the ceiling and recorded a new ceiling, we can expect a price correction. In this correction, we have identified important supports for you and it is expected that it will be able to succeed in setting a new ceiling.
*Trade safely with us*
Goldlong

Breaking Resistance: Gold Eyes $4,500 by Year-EndLooking at this weekly chart of Gold (XAU/USD), we can clearly see the explosive price action that has been building up. The price has been climbing steadily, with the 33-period EMA providing strong support along the way. The breakout above the resistance zone is a strong signal that the bullish momentum is gaining strength.
However, the price is now approaching a key resistance level around $4,049, which could act as a significant hurdle. If this level holds, we might see some consolidation or a potential pullback before the next move up.
Keep an eye on how the price interacts with the resistance — a break above could signal further upside, while failure to break could lead to a retest of lower support levels. It’s a crucial moment for Gold, and any confirmation above this zone could trigger a strong continuation of the uptrend.

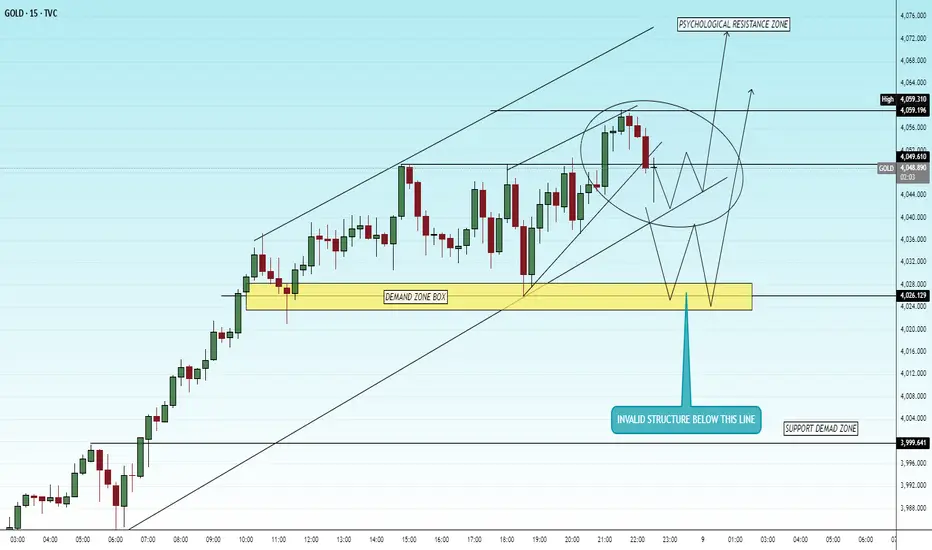
XAUUSD 15m – FOMC Setup AheadTVC:GOLD
Structure | Trend | Key Reaction Zones
Price still maintaining a descending channel structure.
Sitting near psychological and demand support zone (4030–4025).
FOMC volatility expected — final structure below 4025 could trigger continuation down, else a short-term bullish correction may occur.
Market Overview
Gold has been under intense selling pressure before the FOMC event, forming multiple lower highs within a bearish channel. The zone around 4030–4025 remains a key area where liquidity may sweep before a potential retracement toward upper levels if the market rejects strongly from this zone.
Key Scenarios
✅ Bullish Case 🚀 → Bounce from 4030–4025 → 🎯 Target 4068 → 🎯 Target 4085 → 🎯 Target 4100
❌ Bearish Case 📉 → Break below 4020 → 🎯 Target 4005 → 🎯 Target 3980
Current Levels to Watch
Resistance 🔴: 4068 / 4085
Support 🟢: 4030 / 4020
⚠️ Disclaimer: This analysis is for educational purposes only. Not financial advice.
4050-4030 oscillation, bullish trend remains the main trendGold is currently still in a bullish upward trend. Our core trading strategy remains unchanged, and the key points I reminded you of earlier this morning must be carefully considered. Judging from the trend, gold in the US market is basically oscillating back and forth in the range of 4050-4030. I mentioned before that gold has repeatedly tested 4030. Once it falls below, gold may test the support range of 4020-4010 below in the US market. This has been marked in the chart. I believe brothers can see it very clearly. At the same time, we should still take precautions on the upside. As time goes by, we can pay moderate attention to the short-term channel pressure around 4065. Once gold stabilizes above 4050, it will definitely touch around 4065. On the downside, we continue to monitor a break of 4030. If, while waiting for gold to fall back to the support range, it first rises and hits the channel resistance, you can retest gold shorts based on market trends. If you have any questions, you can leave me a message for help. If you think Allen's analysis is helpful to you, you can give it some encouragement by clicking the like button.

ANFIBO | XAUUSD - Buy and Win [10.8.2025]Hi traders, Anfibo's here!
XAUUSD Analysis – Daily Trading Plan
Technical Outlook:
> SUPPORT KEY / BUY ZONES : 4026 - 4000 - 3942 - 3926 - 3909 - 3900 - 3890
> RESISTANCE KEY / SELL ZONES : 4086 - 4139
Trading Plan for Today:
>>> SELL ZONE:
ENTRY: 4082 - 4092
SL: 4102
TP: 4026 - 4000 - 3942 - 3926
>>> BUY ZONE:
(1) ENTRY: 4025 - 4027
SL: 4019
TP: 4086 - 4139 - ATH
(2) ENTRY: 3885 - 3900
SL: 3880
TP: 3940 - 3970 - 3995 - ...
Risk Management:
- Maintain a minimum Risk:Reward ratio of 1:2.
- Manage position sizing carefully; avoid overtrading at psychological highs.
- Monitor U.S. economic data and geopolitical news closely, as these could act as catalysts for corrective moves.

Gold hits record high, momentum stays strong💹 Market Overview
Gold (XAU/USD) has just reached a new all-time high at $4021/oz, reflecting strong safe-haven demand and optimism over upcoming Fed rate cuts.
During the Asian session, price consolidated around $4017–$4020, showing limited profit-taking pressure and strong bullish dominance.
📊 Technical Analysis
- Resistance: $4025 – $4035 (next psychological level)
- Support: $4005 – $3990 (potential short-term buying area)
- EMA50 (H1): trending firmly upward around $4008
- Volume & Momentum: steady buying inflow, no bearish divergence
- Candle Structure (H1): forming higher lows → confirming bullish control
🔎 Outlook
Gold remains in a powerful breakout phase, with momentum suggesting a potential extension toward $4030–$4050 if no strong selling pressure appears.
However, watch for a possible technical pullback near $4000–$4005 before the next move up.
💰 Trading Strategy
🔺 BUY XAU/USD: $4008 – $4012
🎯 TP: 40 / 80 / 200 pips
🛑 SL: $4005

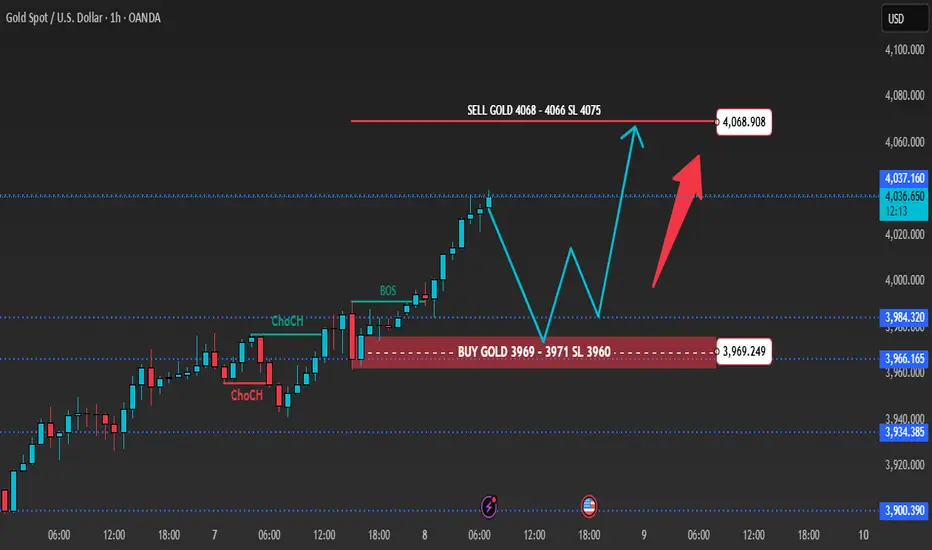
Gold 1H – Bulls Seek Re-Entry Before Fed Minutes💎 XAUUSD – Intraday Trading Plan | Ryan_TitanTrader
📈 Market Context
Gold extends its advance above $4,030 as traders position ahead of this week’s FOMC minutes and key U.S. inflation expectations data. The metal remains supported by persistent geopolitical risk and renewed central-bank demand, while Treasury yields hover near monthly lows.
However, sentiment is mixed after the IMF warned of slower global growth, keeping the dollar steady and prompting potential short-term corrections before continuation.
🔎 Technical Analysis (H1/H4)
Price structure shows a clean Break of Structure (BOS) to the upside following a higher-low formation. The market is currently reacting near premium liquidity at 4068–4066, where a rejection could trigger a retracement toward the discount buy zone at 3969–3971 before resuming the bullish leg.
🟢 Buy Zone: 3969–3971 (Discount Demand / FVG) – potential re-entry area for continuation buyers.
🔴 Sell Zone: 4068–4066 (Premium Liquidity) – possible engineered sweep zone for short-term sellers.
🔑 Key Levels
• BUY Zone: 3969–3971 (main support 3960)
• SELL Zone: 4068–4066 (liquidity pool)
• Psychological Resistance: 4070
• Intraday Pivot: 4035
💡 Trading Scenarios & Plan
🟢 BUY ZONE: 3969–3971
SL: 3960
TP: 3980 – 3990 – 4005 – 4020 – 4035+
🔴 SELL ZONE: 4068–4066
SL: 4075
TP: 4050 – 4035 – 4020 – 4000
⚠️ Risk Management Notes
Expect liquidity sweeps near 4068 before the U.S. session. Wait for lower-timeframe confirmation (ChoCH / BOS) before entry.
Volatility may spike around the Fed minutes, so partial profits and tight stop management are advised.
✅ Summary
Gold remains structurally bullish above 3960, with intraday retracements likely before continuation.
Ryan_TitanTrader anticipates buy reactions around 3970 and short-term rejections at 4068, aligning with the current SMC structure and macro catalysts ahead of FOMC updates.
🔔 Follow Ryan_TitanTrader for live setups, liquidity plays, and real-time gold structure updates!
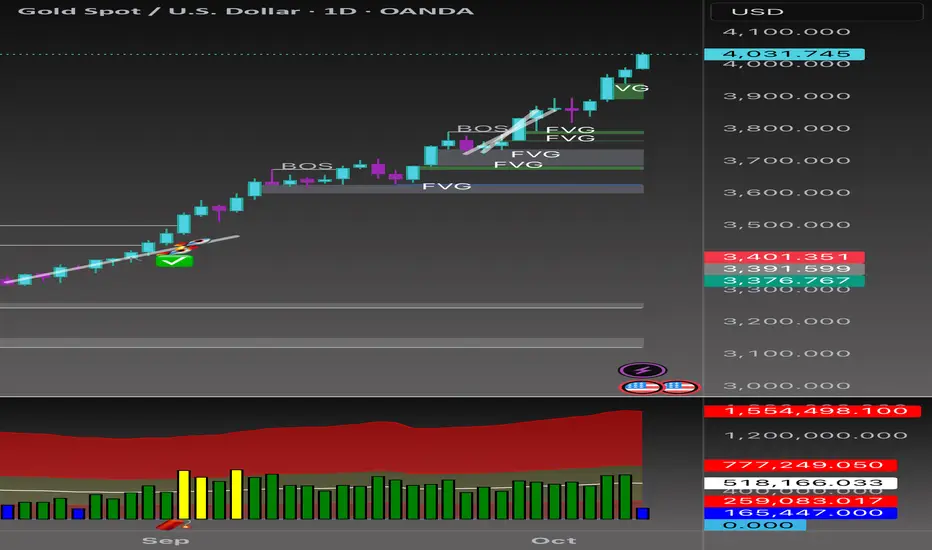
Beyond the Chart - GOLD Market Technical Analysis🟡 OANDA:XAUUSD – Gold Breaks 4,000 💥 | Continuation Update
A few weeks back, I shared my bullish outlook on Gold right from the 🚀 zone, supported by rising volume (🧨) and clean structure. That setup played out perfectly.
Now, after breaking the $4,000 all-time high, price has formed multiple Fair Value Gaps (FVGs) and keeps rejecting from them strongly confirming buyer dominance. Volatility remains high, and the trendline from my previous post is still guiding the move.
As long as price stays above the 3,950–3,980 area, I expect bullish continuation targeting the 4,080–4,150 zone next.
Bias: 🔼 Bullish
Setup basis: Trendline + FVG rejections + Volume confirmation
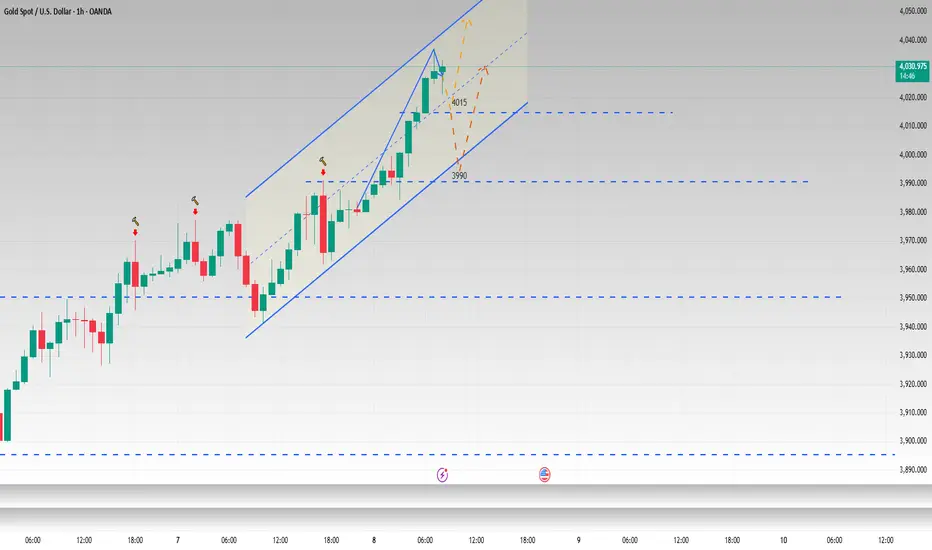
4015 can go long, 3990 is bullish if not brokenAs expected, gold continued its strong upward momentum, breaking through the 4,000 mark in the Asian session and nearly reaching 4,040. But from the news point of view, gold has now come to a critical moment. According to information revealed by U.S. Senator John Thune, the Senate will vote again on two short-term appropriations bills on the 8th and discuss the progress of the government shutdown. This will be the Senate's sixth attempt to pass a temporary spending bill to end the federal government shutdown. The previous government shutdown sparked market panic, leading many investors to flock to the gold market. If the government can be reopened this time, it will effectively alleviate risk aversion and cause gold prices to correct. On the contrary, the impact of continued closures and geopolitical factors may even cause gold to rise again.
Judging from the current gold trend, a new upward channel has been formed. Our trading strategy still focuses on long gold and short gold as a supplement. Then we should first focus on the small support of 4015-4010. When it falls back to here for the first time, we can try to go long with a light position. If it breaks, stop loss in time and pay attention to the important support of 4000-3900 to go long on gold. But it is worth noting that we must be wary of the possible rise and fall of gold today. The first reason is whether the US government shutdown issue can be resolved. The second reason is that China’s holiday is about to end. As a major gold holder, once it returns, the impact on the market will definitely be significant. On the upside, focus on the channel resistance level of 4050-4060. If gold rises near this resistance level, consider shorting it appropriately based on market conditions.
For more real-time updates, please follow my profile
"Gold 'Buy the Dip' Opportunity Targeting the $4,000 Level"
Technical Analysis
This is a classic bullish continuation setup. Here's a breakdown of the key elements:
Prevailing Trend: The chart shows a strong bullish impulse wave, indicated by the series of large green candles. This establishes the short-term trend as upward.
Corrective Pullback: After reaching a local high (around $3,980), the price is currently in a corrective phase, pulling back towards a potential support level. This is normal and healthy price action in an uptrend.
Support Zone: The red rectangle you've highlighted from approximately $3,950.00 to $3,956.00 is a well-defined area of potential support. This zone represents a previous level of consolidation and the base of the last major push upwards, making it a likely area for buyers to step back in.
Trade Idea: The projected path you have drawn suggests an expectation that the price will dip into this support zone, find buying pressure, and then continue its upward trajectory. This is often referred to as a "buy the dip" strategy.

Gold Price Analysis – Gold Retracement Setup $3,955 TargetGold remains in a bullish structure, holding above the ascending trendline. Price has recently faced rejection near $3,956, which marks the weekly high, and a short pullback is expected before the next leg up. The ideal buy zone lies between $3,905–$3,890, aligning with previous structure support and the trendline base. A bullish reaction from this zone could push price toward $3,956, and if momentum continues, an extended move toward $3,990 is possible. The stop-loss should be placed below $3,885 to protect against false breaks, keeping the bias bullish as long as price stays above $3,890.
Note
Please risk management in trading is a Key so use your money accordingly. If you like the idea then please like and boost. Thank you and Good Luck!

Still Bullish on Gold.Gold has broke $4,000... I extended the regression channel lines and it is still trading within our trend. Expected TP is $4050 provided the momentum stays bullish throughout the week; then wait for a new entry.
Use trailing stop losses to manage position and secure some profits incase of reversals.

ANFIBO | XAUUSD - Fibo 2.618 at $4000 is coming soon [10.7.2025]Hi traders, Anfibo is here!
XAUUSD Analysis – Daily Trading Plan
Overall Picture:
It appears that gold OANDA:XAUUSD is moving exactly according to the two projected waves outlined in yesterday’s plan. The market continues to demonstrate strong bullish momentum, steadily seeking new all-time highs .
The current uptrend shows no significant signs of weakening, with safe-haven demand still dominating price action. However, the $4,000/oz level remains a key psychological resistance, which also aligns with the Monthly Fibonacci extension target. As price approaches this zone, a technical correction or profit-taking phase is highly likely to occur.
The degree of this potential correction will depend heavily on macroeconomic data and geopolitical developments, so it’s essential to closely monitor and reassess the market as new information unfolds.
Technical Outlook:
Primary Trend: Strong bullish momentum on both Daily and Monthly timeframes.
> SUPPORT KEY / BUY ZONES : 3942 - 3926 - 3909 - 3900 - 3890
> RESISTANCE KEY / SELL ZONES : 3970 - 3975 - 3984 - 3999
Trading Plan for Today:
>>> SELL ZONE:
ENTRY: 3995 - 4005
SL: 4010
TP: 3900 - 3800 - ...
>>> BUY ZONE:
ENTRY: 3885 - 3900
SL: 3880
TP: 3940 - 3970 - 3995 - ...
Risk Management:
- Maintain a minimum Risk:Reward ratio of 1:2.
- Manage position sizing carefully; avoid overtrading at psychological highs.
- Monitor U.S. economic data and geopolitical news closely, as these could act as catalysts for corrective moves.
Conclusion:
Gold continues to follow the planned technical path, reaffirming the strength of its bullish structure. The $4,000/oz zone will serve as a key psychological milestone — a level where temporary corrections or consolidations are likely before another potential leg higher.
For now, the strategy remains clear: prioritize the bullish side, and closely observe price reactions around $4,000 to adjust accordingly. In this market, “following the trend” remains the wisest approach.
GOODLUCK GUYS!

Gold Price Analysis – Bullish Above $3910Gold price is currently showing a mild correction after testing the upper trendline of the ascending channel. The chart suggests a possible short-term pullback toward the $3925–$3913 zone, which aligns with the 0.382–0.618 Fibonacci retracement levels. As long as price holds above $3910, the bullish structure remains intact, and a rebound toward $3976 and possibly $4016 can be expected. A break below $3900 would weaken bullish momentum and could extend the decline toward $3875 support.
Support: $3925 / $3910 / $3875
Resistance: $3976 / $4016
Bias: Bullish above $3910; correction possible before next leg up.
Note
Please risk management in trading is a Key so use your money accordingly. If you like the idea then please like and boost. Thank you and Good Luck!

Gold climbs as buyers stay in control.📊 Market Overview
Gold (XAU/USD) extended its rise during the European session, breaking above the short-term resistance at $3,952 and is now trading around $3,963. The rebound from $3,940 support shows that technical buying remains strong, as traders expect the Fed to keep rates lower for longer.
🔍 Technical Analysis
• Immediate resistance: $3,965 – $3,970
• Major resistance: $3,980
• Support: $3,945 – $3,950
• EMA 50 (H1): trending upward, signaling short-term bullish momentum
• RSI (H1): around 63, showing room for further upside before overbought levels
If gold holds above $3,952, the short-term uptrend remains valid, with upside targets at $3,970–$3,980. However, a rejection candle near $3,970 may trigger a short correction back toward $3,950.
💡 Outlook
Short-term trend: Mildly bullish, but traders should watch for reaction near $3,970, a key level that could decide whether gold extends higher or retraces.
🎯 Trading Plan
🔺 BUY XAU/USD
• Entry: $3,955 – $3,952
• TP: 40/80/200 pips
• SL: $3,949

Gold can be considered to be bought at 3935-3945If you agree with this point of view, please follow and like it, the gold strategy will continue to be updated!
The price of gold has successfully broken through the $3,900 mark and is gradually approaching $4,000. This upward trend is completely in line with my recent predictions. I am not surprised and I have always maintained a long position in trading.
The main reasons for the surge in gold prices are still the same: global economic slowdown, geopolitical conflicts, rising market expectations for further interest rate cuts by the Federal Reserve, and intensified concerns about a prolonged shutdown of the US government. These are the main factors driving gold prices higher.
From a technical perspective, gold has continued to rise for 7 consecutive weeks on a weekly basis, and the price at the daily level has been stably running above the major moving averages. The medium- and long-term bullish trend of gold remains unchanged. This is the idea I have always adhered to. In the short term, gold is showing signs of fatigue after its recent surge. Historically, gold prices often retreat after rapid surges, entering a new range of fluctuations. This is the optimal time to trade. Once you've mastered the buying and selling points, both long and short trades can generate profit.
Strategy: Buy gold in the 3935-3945 area, target 3960-3970, focus on the new high above, if it breaks through, look to 3990.
The above ideas are personal opinions and are time-sensitive. The real-time strategy may change flexibly based on market trends.

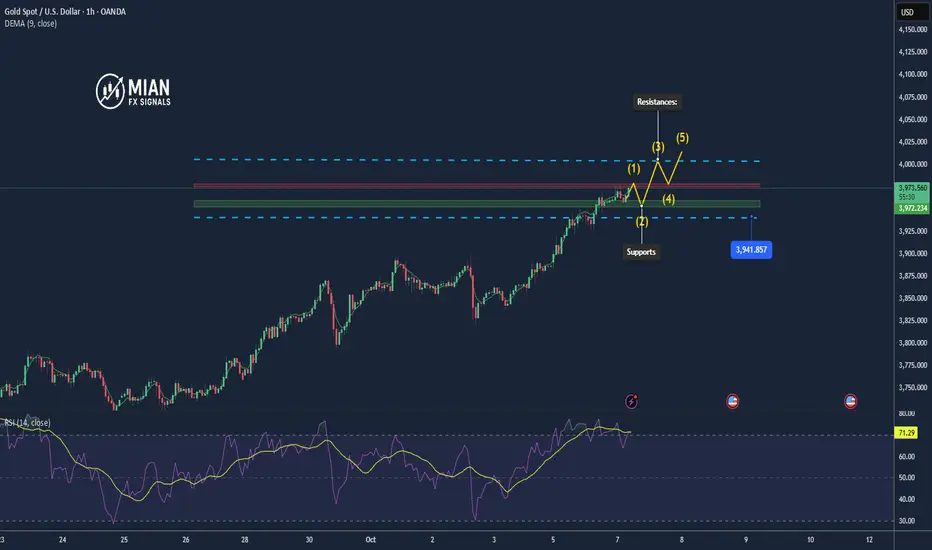
Gold steady around $3,970 – Short-term correction risk📊 Market Overview
Gold (XAU/USD) is trading around $3,965–$3,970 after setting a new all-time high at $3,977. Buying pressure remains dominant, yet momentum is slowing as the U.S. Dollar Index rebounds to 100.5 and the 10-year Treasury yield ticks higher.
Overall sentiment stays bullish as traders anticipate Fed rate cuts and remain cautious over geopolitical risks.
📈 Technical Analysis
• Trend: Strong uptrend, but RSI (H1) > 70 → short-term correction risk.
• EMA50 (H1): Still sloping upward, confirming medium-term bullish bias.
• H1 candle shows a long upper wick near 3978, signaling profit-taking pressure.
Resistances:
1️⃣ $3,975 – $3,980 (ATH zone, strong supply)
2️⃣ $3,988 – $4,000 (psychological extension)
Supports:
1️⃣ $3,960 – $3,953 (immediate reaction zone)
2️⃣ $3,945 – $3,938 (EMA50 H1)
3️⃣ $3,920 – $3,915 (medium-term support)
💡 Outlook
Gold remains in a firm uptrend but faces heavy resistance around $3,975–$3,980. A short-term pullback toward $3,950–$3,945 is likely before the next upward leg.
If price breaks and closes above $3,980 (H1), the uptrend may extend toward $4,000–$4,020.
🎯 Suggested Trading Strategies
🔻 SELL XAU/USD: 3403–3406
🎯 TP: 40 / 80 / 200 pips
🛑 SL: 3409
🔺 BUY XAU/USD: 3955–3952
🎯 TP: 40 / 80 / 200 pips
🛑 SL: 3949
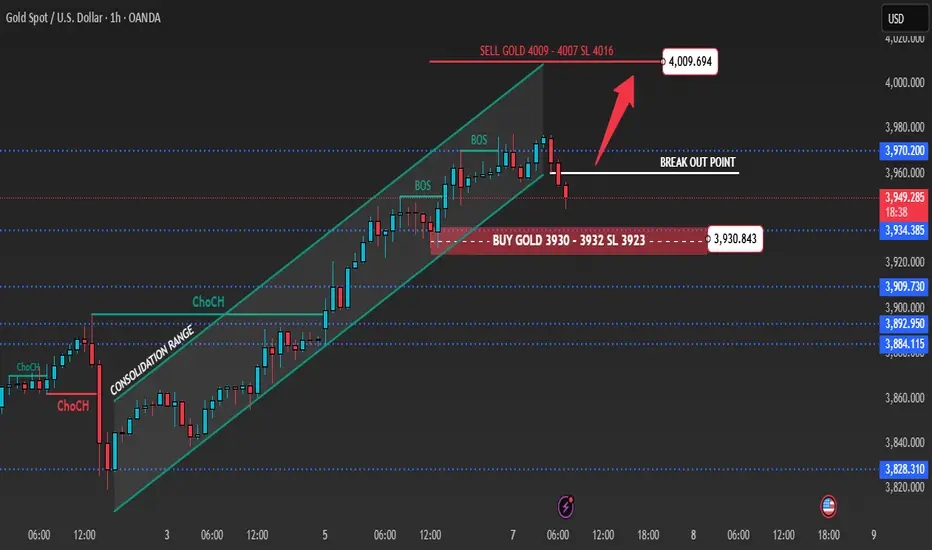
Gold 1H – Pullback Expected Before Key CPI Data💎 XAUUSD – Intraday Trading Plan | Ryan_TitanTrader
📈 Market Context
Gold is stabilizing below the $4,000 mark as traders await this week’s U.S. CPI data and fresh remarks from the Federal Reserve. After a strong multi-week rally, the metal is showing early exhaustion near premium liquidity zones, where engineered pullbacks often occur before continuation.
While the mid-term bias remains bullish, several analysts — including those from Citi and UBS — caution that gold could face short-term corrections if the dollar regains strength. The market continues to price in around a 65% probability of a December rate cut, keeping volatility elevated and sentiment uncertain.
🔎 Technical Analysis (H1/H4)
Price has slipped slightly below the ascending channel after consecutive BOS signals, indicating a potential short-term retracement before resuming the uptrend.
🟢 Buy Zone: 3932–3930 (Breakout & FVG zone) – an ideal discount area where buyers may re-enter the market.
🔴 Sell Zone: 4009–4007 (Premium liquidity) – a key region for short setups if price rejects strongly.
🔑 Key Levels
• BUY Zone: 3932–3930 (main support 3923)
• SELL Zone: 4009–4007 (liquidity reaction area)
• Psychological Resistance: 4000
💡 Trading Scenarios & Plan
🟢 BUY ZONE: 3932–3930
SL: 3923
TP: 3945 – 3955 – 3965 – 3975 – 3980+
🔴 SELL ZONE: 4009–4007
SL: 4016
TP: 3995 – 3980 – 3975 – 3965 – 3955
⚠️ Risk Management Notes
The 4000–4010 region acts as a high-liquidity magnet, where false breakouts and engineered sweeps may occur before reversals.
Wait for lower-timeframe confirmation (BOS or rejection candle) before entry.
Avoid overleveraging ahead of CPI — expect volatility spikes and rapid shifts in sentiment.
✅ Summary
Gold remains structurally bullish but vulnerable to intraday retracements near 4009–4007. Ryan_TitanTrader anticipates potential buy reactions from 3932–3930 and short-term rejections near 4009–4007. Holding above 3923 keeps the bullish outlook intact with upside targets toward 3970–3980.
🔔 Follow Ryan_TitanTrader for real-time updates, live setups, and advanced SMC insights as gold reacts to CPI data this week!
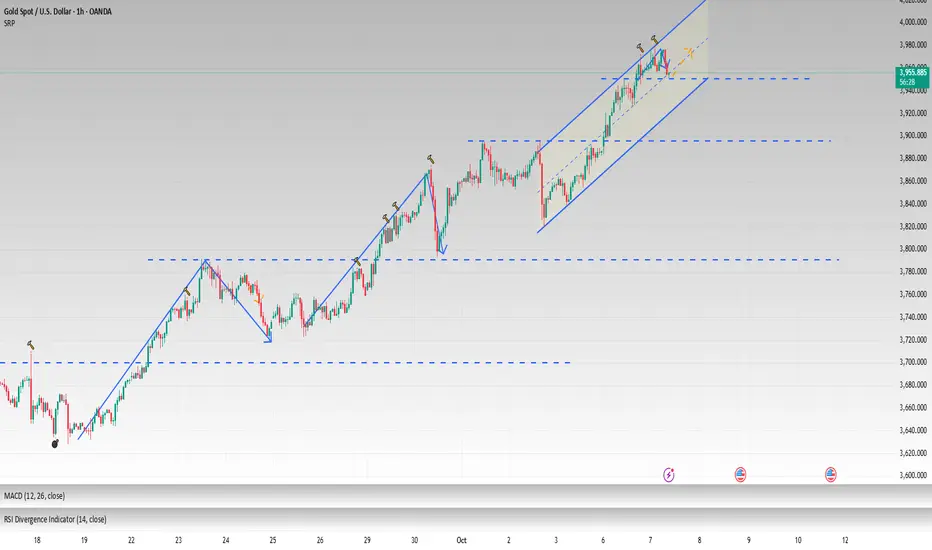
The most accurate analysis on the entire network do you follow As the US government shutdown continues, many central banks continue to increase their gold holdings. Coupled with Trump's new tariffs and geopolitical implications, the market continues to release bullish signals, contributing to a pattern of gold prices hitting new highs. Yesterday, gold in the US market tested the resistance of 3960-3970 as expected and then fell back to around 3945. Those brothers who followed the trading strategy and went short must have made good profits.
As time goes by and the price of gold continues to rise, the short-term lows are also moving higher. Gold continued to rise in the Asian session today, reaching a high of around 3977 before falling back. In the short term, pay attention to the support level below 3955-3940. If it falls back for the first time during the day, you can consider going long on gold.
In addition, observing previous gold price trends, we can see that every time gold breaks through a new high, it will experience a pullback of approximately $70-80 to accumulate momentum after hitting channel resistance. According to this trend pattern, combined with the rising channel of our chart, we can find that the next suppression point is at 3985-4000.
Overall, gold remains bullish in the medium to long term, but may experience short-term technical adjustments. The core trading strategy remains primarily long gold, supplemented by short positions. If the price falls back to the 3955-3940 range for the first time during the day, you can consider buying gold in batches according to the strength of the pullback, with the target at 3985-4000. After the resistance level is reached and under pressure, you can consider shorting gold appropriately based on the market trend.
ANFIBO | XAUUSD Weekly Plan [10.6 - 10.10.2025]Hi traders, Anfibo is here!
XAUUSD Analysis – Daily Trading Plan
Overall Picture:
Gold’s bullish trend remains extremely clear, reflecting the market’s strong confidence in this safe-haven asset amid ongoing global economic and geopolitical uncertainties. The continuous series of new ATHs highlights that buyers are firmly in control of the market.
However, from a technical perspective, the $4,000/oz level stands out as a significant psychological round-number resistance. This zone also coincides with the Monthly Fibonacci extension target, making it highly likely that profit-taking will emerge once price approaches this level. Any reaction here will largely depend on external factors and key news events, which must be closely monitored.
Technical Outlook:
Primary Trend: Strong bullish momentum on both Daily and Monthly timeframes.
Momentum: Still positive, though $4,000 may trigger short-term corrections.
> SUPPORT KEY / BUY ZONES : 3800- 3787 - 3750 - 3723 - 3713 - 3703
> RESISTANCE KEY / SELL ZONES : 3825 - 3835 - 3865 - 3880
Trading Plan for Today:
>>> SELL ZONE:
(1) ENTRY: 3969 - 3973
SL: 3976
TP: 3900 - 3890
(2) ENTRY: 3995 - 4005
SL: 4010
TP: 3900 - 3800 - ...
>>> BUY ZONE:
ENTRY: 3885 - 3900
SL: 3880
TP: 3940 - 3970 - 3995 - ...
Risk Management:
- Maintain a minimum Risk:Reward ratio of 1:2.
- Manage position sizing carefully; avoid overtrading at psychological highs.
- Monitor U.S. economic data and geopolitical news closely, as these could act as catalysts for corrective moves.
Conclusion:
Gold remains in a powerful bullish cycle with no signs of cooling down yet. However, the $4,000/oz mark is a critical psychological and technical barrier where corrective pullbacks are likely to occur. Traders should continue to favor long setups but remain vigilant around this zone, closely observing price reactions to refine their strategies.
WISH EVERYONE A PROFITABLE NEW WEEK!

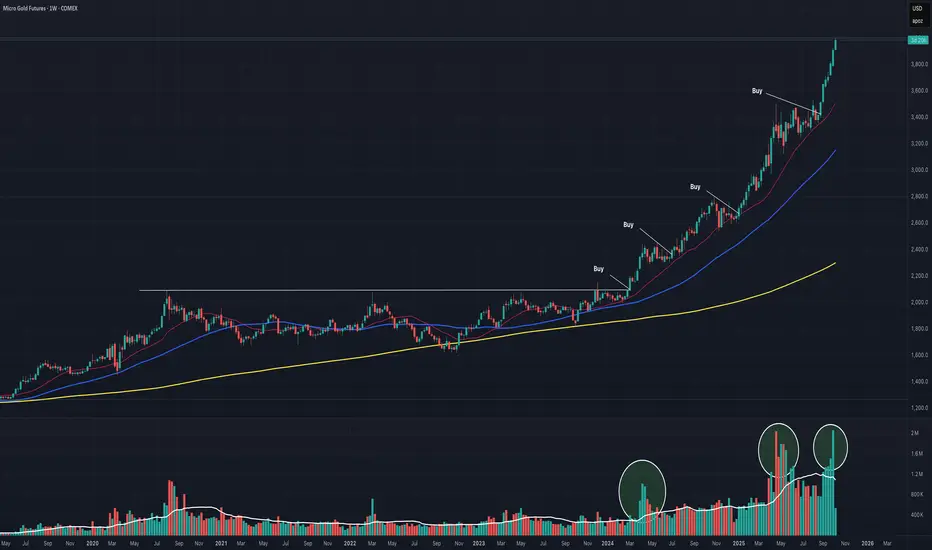
Gold’s Epic Breakout | Parabolic Curve with Flag & Pennant SetupWhat a run for Gold (GC1!) — a powerful move years in the making.
After a long, flat base from Sept 2020 to March 2024, gold finally broke out and has been trending with incredible momentum ever since. If you missed the initial breakout, there were multiple clean reentry setups along the way — offering low-risk, high-reward opportunities.
Each pullback to the 10- or 20-week line formed classic bull flags and pennants, providing continuation entries within a larger parabolic curve structure.
The overall pattern shows acceleration — each base gets shorter, steeper, and accompanied by expanding volume, the hallmark of a strong parabolic trend.
So while the macro trend is parabolic, the buy points were tactical — small, high-probability continuation setups that allowed traders to compound gains without chasing.
Gold Bullish Momentum: Layering Longs For Maximum Gain!🏆 XAU/USD | The Gold Robbery Heist Plan (Swing/Day Trade)
🎯 Plan Setup (Bullish)
Entry (Layering Style):
Using the Thief Layer Strategy 🕵️♂️ → Multiple Buy Limit layers
$3625
$3630
$3635
$3640
(Add more layers based on your own strategy & risk appetite)
Stop Loss (Thief SL):
@3610 (Adjust based on your own strategy & risk ⚠️)
Take Profit (Escape Point):
Target resistance zone @3690 🚪💰
⚡ Note: This is a flexible thief-style plan — adjust SL/TP levels as per your personal money management and execution style.
📊 Why This Plan? (Thief’s Market Analysis)
🔎 Real-Time Market Data (10 Sept 2025)
Price: $3,643.71
24h Change: +0.48%
Range: $3,620.90 – $3,644.56
🧠 Retail Sentiment (Contrarian Signal)
Long: 37%
Short: 63%
➡️ Retail crowd is heavily short → Contrarian bullish setup.
🏦 Institutional Sentiment (Commitment of Traders)
Net Long: +249,530 contracts
Long: 315,796
Short: 66,266
➡️ Institutions are firmly positioned long ✅
🌡️ Fear & Greed + Volatility
Neutral (shifting from Greed)
VIX <14 (52-week low) → Calm market backdrop
📉 Macro & Fundamentals
US jobs data: Weak (22K vs. 75K expected)
Fed rate cut probability: 99.4% (September meeting)
Central bank gold demand + geopolitical tensions supportive
Upcoming CPI/PPI = key catalyst
📐 Technical View
Price holding above $3,625 support
Ascending channel continuation
Overbought zone = caution for short pullbacks
🗝️ Key Takeaways (Thief OG Notes)
USD weakness + Fed dovish tilt = Gold tailwind
Retail shorts = bullish contrarian setup
Institutions backing the move higher
Short-term overbought → manage exits smartly
🔥 Related Markets to Watch
OANDA:XAGUSD (Silver)
TVC:DXY (US Dollar Index)
SP:SPX (S&P 500)
TVC:US10Y (US 10Y Treasury Yield)
BITSTAMP:BTCUSD (Bitcoin correlation check)
✨ “If you find value in my analysis, a 👍 and 🚀 boost is much appreciated — it helps me share more setups with the community!”
#XAUUSD #Gold #Forex #SwingTrade #DayTrading #TechnicalAnalysis #Fundamentals #ThiefStrategy #TradingPlan #GoldBulls #MacroAnalysis #MarketSentiment

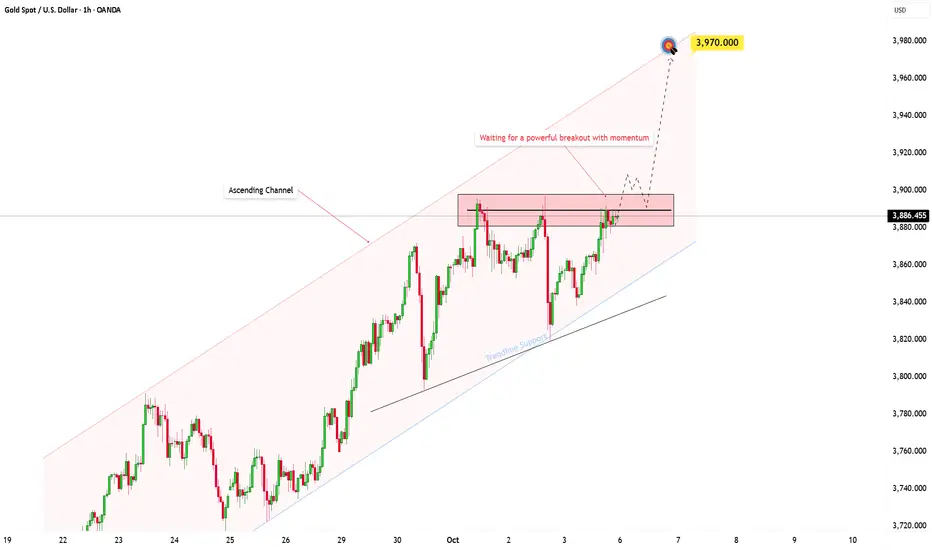
The Gold Bulls Take Control!Hi everyone, Kilian here!
Let’s talk about XAUUSD.
Gold is showing a clear and structured bullish trend right now. The price continues to move within a well-established ascending channel, and the price action has consistently respected both the upper and lower boundaries. This suggests that the buying pressure remains strong.
The next logical step for me is a break above the current resistance zone. If we see that breakout, I expect the price to pull back briefly to test the support level before continuing its upward movement. A successful retest of support would solidify the bullish structure and set the stage for a move toward the 3,970 level, aligning with the upper boundary of the channel.
However, if the resistance proves too strong and the breakout doesn’t happen, this could signal a weakening of the bullish momentum. In that case, we could see a deeper pullback toward the lower boundary of the ascending channel, offering another potential entry point.
It’s crucial to always confirm your setups and manage risk properly. Be prepared for both scenarios, and best of luck with your trades!