The correction is over; buy gold on pullbacks.#XAUUSD TVC:GOLD OANDA:XAUUSD
With the White House website indicating the ongoing US government shutdown, the normal release of key data such as ADP and NFP may be affected. The news briefly boosted gold prices, leading to a technical rebound in Asian trading.
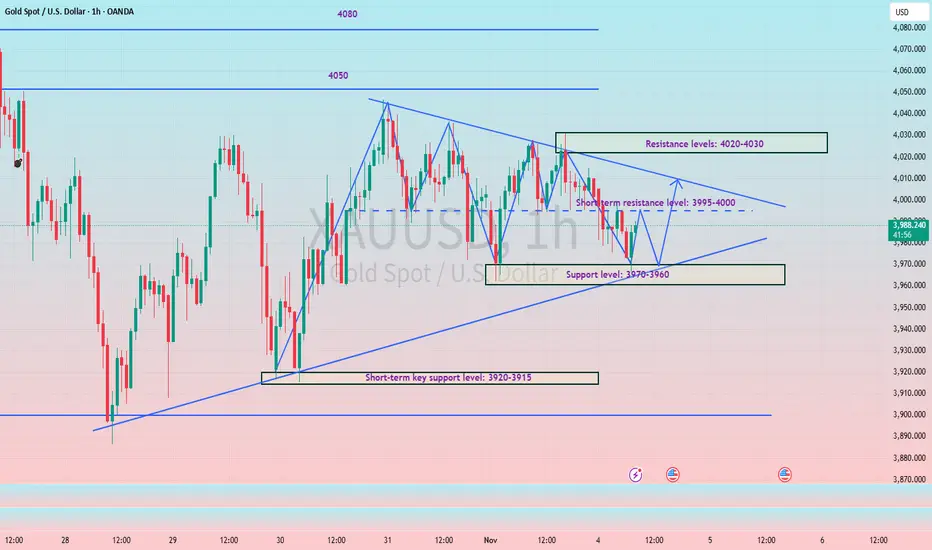
From the daily chart, the short-term resistance is still around 3980-4000, which is also where the 4H middle line is located. For the bulls to make a full comeback, they need to break through this resistance range and hold above 4000. The current slow and volatile upward trend in gold prices indicates that the bulls still have room to maneuver. In the short term, one can try to continue to be bullish on gold by using the middle line of the hourly chart as a defense. Conservative traders can wait for a pullback to 3970-3955 to try to go long on gold.
Goldlong

Gold – Buy around 3960, target 3980-4000Gold Market Analysis:
Gold rebounded sharply yesterday after touching 3930. The expected rebound followed by a further decline didn't materialize; instead, it underwent a significant correction and consolidation at higher levels. The daily candlestick pattern closed positive again, indicating significant buying and selling pressure due to the alternating bullish and bearish candles. Finding the right rhythm during short-term consolidation is crucial. Today's strategy for gold is to maintain a bearish overall trend while expecting short-term consolidation, with opportunities for both buying and selling. The 5-day and 10-day moving averages are about to cross, potentially indicating a direction today. Note the upcoming Non-Farm Payrolls (NFP) data; a large one-sided trend is unlikely. We anticipate needing the NFP to provide direction. Our target direction is a breakout from the short-term consolidation. Today, focus on the 3990 level during the Asian session; a break above this level would trigger a new buying opportunity, forming a large V-shaped pattern on the 4-hour chart. For the Asian session, look for two buying opportunities: a slight dip to the 3965-3960 area, and a pullback after breaking 3990. Gold's consolidation will likely be volatile; chasing the market today requires confirmation of signals to avoid losses. Our strategy for gold remains to follow the trend and trade based on understanding the market.
Support levels are 3965 and 3956, with strong support at 3930. Resistance is at 3990, with strong resistance at 4020. The key level for market strength/weakness is 3990.
Fundamental Analysis:
Yesterday's ADP employment data was -2.9, with an expected 2.8, but the result was 4.8. The positive data is bearish for gold, but gold only saw a small rebound, so the reaction was not significant .
Trading Recommendation:
Gold – Buy around 3960, target 3980-4000.

Gold rebounds from 3974, short-term trend turns bullish1. Market Overview:
During the European session, gold dropped sharply from 3985 to 3956 but quickly rebounded after touching the key support area around 3974. The price is now fluctuating near 3980, indicating that dip buyers have re-entered the market after the short-term correction.
2. Technical Analysis:
• Short-term trend: Neutral to slightly bullish
• Resistance levels: 3988 – 3995 / 4010 – 4025
• Support levels: 3974 – 3960 / 3945 – 3930
• The price is currently trading above the EMA20 and EMA50 on the H1 timeframe, and the bullish candle bounce confirms 3974 as a short-term support.
• If the price sustains above 3975, the upward move could extend toward 3995 – 4010.
3. Outlook:
Gold is currently sideways in accumulation mode between 3950–3990. Buyers are regaining control, but a clear breakout above 3988 is needed to confirm further upside momentum.
4. Suggested Trading Strategy:
🔺 BUY XAU/USD
Entry: 3975–3978
🎯 TP: 3990 / 4005 / 4020
🛑 SL: 3960
🟢 Strategy: Buy continuation as long as price holds above 3975
________________________________________
🔻 SELL XAU/USD (only if price fails to break 3988–3995)
Entry: 3988–3995
🎯 TP: 3970 / 3956 / 3935
🛑 SL: 4005

US Employment Data Positive for GOLD Prices. Can GOLD reverse?GOLD is declining in falling channel pattern however seems to be taking support at the marked trendline.
US Employment data came just in where number of jobs added was better than expectations which would mean a stronger labour market and inflation might stay elevated which is good for GOLD/SILVER due to safe haven demand in the long term.
Keep an eye on GOLD prices.

XAUUSD - Time to buy...XAUUSD was in a short term downtrend for a few weeks but has now shown some clear bullish movements ahead. XAUUSD (Gold) has broken out of a downward trend channel that was acting as strong resistance, The price is very likely to head to the next resistance level which is market as the take profit zone (green line). Time to buy!

Gold – Technical Outlook🔴 Bearish Scenario (Downtrend)
Pivot Level: 4000
If price trades below 4000, continuation to the downside is expected.
🎯 First target: 3930 (support zone)
If 3930 breaks → full bearish extension towards:
🎯 Next targets: 3895 – 3865
🟢 Bullish Scenario (Uptrend)
If price breaks and holds above 4000, upside momentum will strengthen.
🎯 First target: 4030 (resistance zone)
If 4030 breaks and holds on the 1H or 4H timeframe → strong bullish continuation towards:
🎯 Next targets: 4081 – 4133

GOLD falling in a parallel channel formation Gold price has been falling since yesterday as expectations of December rate cut fades away. It is forming a parallel falling channel pattern and has recently bounced from the lower zone.
Keep an eye on it as volatility is expected to stay and there will be ample opportunities to capture movements. Follow me for live updates.
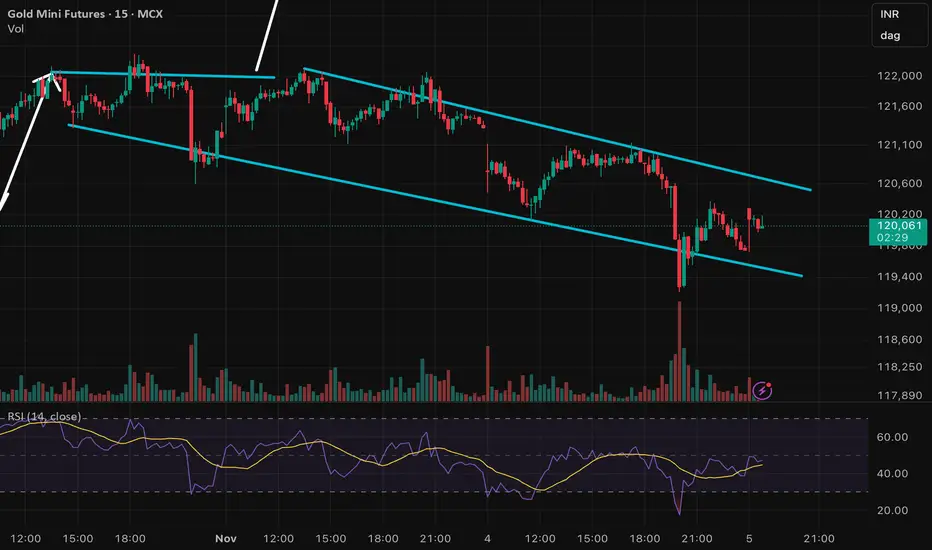
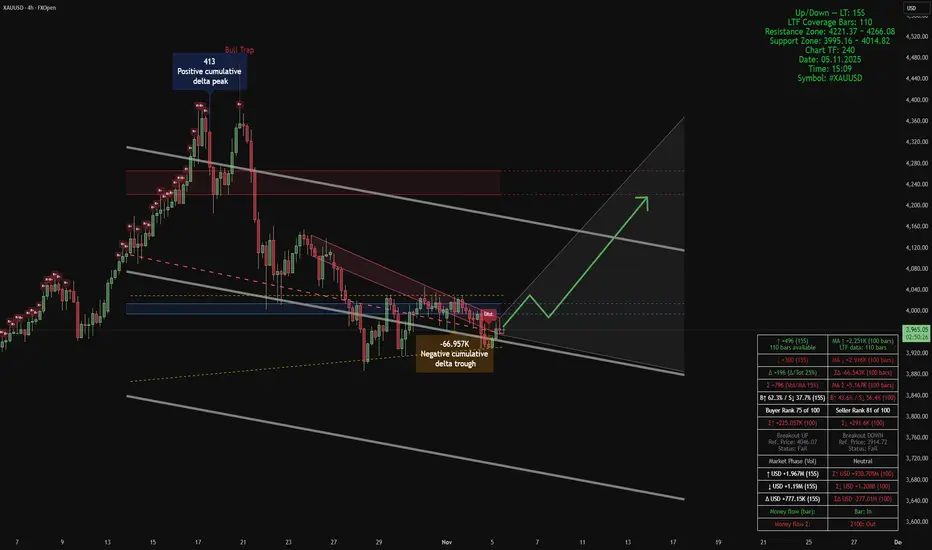
Chart Analysis (XAUUSD, 4H), Smart Volume–Structure Matrix Smart Volume–Structure Matrix | Smart Money Flow & Dynamic Blocks
This chart combines four complementary analytical modules, each providing a unique perspective on market structure and smart money flow:
- Smart Money Support/Resistance: Identifies buy/sell volume-based zones of accumulation or distribution.
- ATAI Volume (Breakout/Phase/OB-OS): Detects directional volume pressure, market phases (Accumulation/Distribution), and overbought/oversold extremes.
- Smart Money Dynamics Blocks (Pearson Matrix & P25 HL2): Measures price correlation and regression-style parallel bands.
- Volume Pressure (Wings & Angles): Calculates normalized momentum angles using ATR to assess directional bias.
Together, they form a multidimensional framework for detecting smart money flow, trend shifts, and potential reversals.
Chart Analysis (XAUUSD, 4H)
Price is trading within a compressed descending channel between red dynamic resistance lines and the lower P25 HL2 band. It is currently consolidating near the Smart Money support zone around 3995–4015. The 4221–4266 range marks the key resistance where a breakout could confirm a mid-term trend reversal.
Volume analysis shows a cumulative delta trough forming at the lower boundary — a sign of seller exhaustion. The ATAI module shows improving buyer ratio and declining sell pressure, suggesting an early phase of re-accumulation. Pearson Blocks indicate an R+ alignment near support, confirming correlation with recent bullish microstructure.
Main Bias: Bullish Reversal.
- Trigger 1: 4H close above the blue pivot line (mid-range) and breakout from the descending wedge.
- Trigger 2: Positive delta confirmation and buyer ratio ≥ 55% on LTF.
- Targets: 4060–4080 → 4140 → 4210–4260 (structural resistance target).
- Invalidation: 4H close below 3995 (breakdown under lower HL2 band).
Alternative Scenario: Short-term continuation of bearish pressure if breakout fails and new delta low forms. In that case, pullbacks toward the blue pivot will act as short-selling opportunities down to the lower band.
Risk Management: Place stops below the last swing/HL2 band with ATR buffer. Scale out at each target and move stops to breakeven after the first objective.
Summary: Confluence of Smart Money Support, Delta trough, R+ Pearson, and HL2 band contact creates a high-probability reversal setup with favorable risk-to-reward. Confirmation requires breakout and positive delta shift. Structural target remains 4210–4260.
ANFIBO | XAUUSD - Sideway Channel H1 [10.29.2025]Hi traders, Anfibo's here!
XAUUSD Analysis – Daily Trading Plan
Overall Picture:
At present, OANDA:XAUUSD is moving sideways within a well-defined H1 channel, showing signs of short-term consolidation after recent volatility. The market is currently lacking a clear directional bias, as both buyers and sellers are testing the upper and lower bounds of this intraday structure. Such conditions often favor range-trading strategies, where precision and timing become crucial for capturing short bursts of momentum.
In this context, our plan today remains straightforward and tactical — trade directly off the trendlines of the channel. In other words, we will look to buy at the lower boundary of the range and sell near the upper boundary, while also being prepared to switch positions if a breakout occurs in either direction.
Trading Plan for Today:
>>> SELL ZONE:
ENTRY: 4060 - 4080
SL: 4090
TP: 4000 - 3955
>>> BUY ZONE:
ENTRY: 3940 - 3950
SL: 3930
TP: 4000 - 4045 - 4070
Risk Management:
- Stick to small-to-medium positions within the range; increase size only on confirmed breakouts.
- Keep stops tight, as sideways phases tend to trigger false signals.
- Maintain Risk:Reward ≥ 1:2 and avoid overtrading in choppy conditions.
- Reassess bias once the H1 channel is clearly broken.
Conclusion:
Gold is currently in a sideways consolidation phase within its H1 channel, awaiting fresh catalysts to determine direction. Until a decisive breakout occurs, the most effective approach is range trading — buying near support, selling near resistance, and reacting dynamically to any confirmed breakout.
The plan today is simple yet strategic:
“Buy at the trendline, sell at the trendline — and flip when the channel breaks.”
Patience and discipline will be key to capitalizing on this quiet yet potentially explosive setup.
GOODLUCK GUYS!

XAUUSD H4 | Bullish Bounce Off Key SupportGold (XAU/USD) is falling towards the buy entry, which is an overlap support that aligns with the 61.8% Fibonacci retracement and could bounce from this levle to the upside.
Buy entry is at 3,969.18, whic is an overlap support that aligns with the 61.8% Fibonacci retracement
Stop loss is at 3,794.07, which is an overlap support that lines up with the 78.6% Fibonacci retracemnt.
Take profit is at 4,070.26, which is a pullback resistance that lines up with the 38.2% Fibonacci retracement.
Stratos Markets Limited (tradu.com ):
CFDs are complex instruments and come with a high risk of losing money rapidly due to leverage. 68% of retail investor accounts lose money when trading CFDs with this provider. You should consider whether you understand how CFDs work and whether you can afford to take the high risk of losing your money.
Stratos Europe Ltd (tradu.com ):
CFDs are complex instruments and come with a high risk of losing money rapidly due to leverage. 70% of retail investor accounts lose money when trading CFDs with this provider. You should consider whether you understand how CFDs work and whether you can afford to take the high risk of losing your money.

XAUUSD Bullish Flag: Breakout Above 4,150 Toward 4,400Gold (XAUUSD) ripped higher from late August and topped just below 4,400 before slipping into a tidy pullback. Price is now hovering near 3,940 with momentum cooled and volatility contracting—classic flag behavior after a vertical pole. Structure remains bullish on higher timeframes, even as the short-term trend corrects. The 20-day average near ~4,085 is capping price, while immediate demand sits around 3,930.
The primary path is continuation: a daily close above 4,150 would clear the flag top and the MA20, opening room for a run back into the 4,380–4,400 supply zone. If momentum builds, expect a retest of the mid-October high at 4,400; interim buoyancy above ~4,100 would support a grind toward 4,340 before the final push. Accumulation near 3,930–3,950 is higher risk, and should be reserved for clear reversal signals.
If buyers fail to defend 3,930–3,920, the setup breaks. A daily close below 3,920 invalidates the flag and puts 3,780 (near the MA60 ~3,773) on the map, with rallies likely to be sold beneath 4,040–4,085 until structure repairs. Clean line in the sand for longs sits just under 3,920, with protective stops around ~3,900.
This is a study, not financial advice. Manage risk and invalidations

Gold has unfinished business at the top.Gold will start its bullish move from the 3,840 zone if it doesn’t begin from the current price around 3,934. There’s still unfinished business at 4,438.6 that the market needs to complete. CMCMARKETS:GOLD


Gold vs SPX Head and ShouldersDoes anyone else see a MASSIVE H&S in this chart?
It seems insane to think this could ever hit the measured move ($44).
Regardless, if this breaks above the descending line.. GET INTO GOLD!

SELL XAUUSD (GOLD) - Great trade opportunityGOLD (XAUUSD) has been in a downtrend lately and has been showing many signs of more bearish movements ahead. Gold is currently in a clear downtrend channel shown on the chart, it has also broken a powerful support level and recently broken the yellow trendline which acted as the last support level near the current price. Gold is likely to hit the next support zone which is shown as the take profit level on the chart. Time to sell!

GOLD | Daily Analysis #4 - 4 November 2025Hello and Welcome back to DP;
Review and News Coverage:
Wow — what a strong downside move! I hope you all managed to capture some profits from this fall. But is it over yet? Personally, I don’t think so. We might see another leg down, possibly tomorrow, due to the upcoming high-impact news releases.
The key events to watch are:
• NFP (Non-Farm Payrolls)
• ISM PMI
Both of these are known to bring significant volatility to the market, so stay alert and manage your risk carefully.
1H Time Frame Technical Analysis:
As shown on the chart, price broke the uptrend and fell through the 3927 area. I believe the price could continue lower, potentially reaching 3914, which aligns with a strong demand zone where buyers may step in.
That’s it for today — the rest of the details are clearly illustrated in the chart.
Summary:
Key Levels:
Support: 3914 (demand zone)
Resistance: 3927 (previous support turned resistance)
Outlook: Possible further decline before rebound (Looking For Buy)
Key Events: NFP & ISM PMI (expect high volatility)
Disclaimer:
This content is for informational purposes only and does not constitute financial or investment advice. © DIBAPRISM
Amir D.Kohn

XAU/USD: Possible up-move after the trapBulls may attempt to bring the price back into the blue ascending channel after the current drop. A rebound from the trap level could trigger a corrective move toward the upper boundary, testing the previous structure around Target 1. The key question — whether this recovery is just a pullback or the start of a renewed uptrend.

How to keep up with the rhythm of triangle pattern consolidation#XAUUSD OANDA:XAUUSD TVC:GOLD
Gold prices stalled at higher levels yesterday, mainly due to Federal Reserve officials' cautious stance on a December rate cut, which boosted the dollar and dampened enthusiasm for gold's rise. Judging from the current trend, the market is in a converging triangle pattern. The daily MA5 is around 3987, and the MA10 is around 4021. It can be seen that the range between these two points is very small, indicating that the market is also preparing to break out and choose a major direction. Once the gold price breaks out of the triangle pattern and chooses a direction, the daily chart's trendline will widen. Therefore, the key resistance level to watch is 4020-4030, while the key support level is 3970-3960. The European session is expected to trade within a range in the short term. Before a successful breakout, pay attention to the resistance level of the middle band on the hourly and 4-hour charts at 3995-4000. If the price touches the resistance level on the first attempt and fails to break through, a small short position can be considered.
Gold may reverse up if support ~3,950–3,970 USD/oz holds📊 Market Overview:
Gold is trading around ~3,980 USD/oz in the Asian session after declining from ~4,020 and dipping near ~3,975. On the H4 timeframe the selling pressure remains as no strong bottom has yet been confirmed around the support zone. Meanwhile, economic data and USD/crude oil swings continue to exert pressure.
📉 Technical Analysis:
• Key support: ~3,950–3,970 USD/oz (previous bounce zone).
• Immediate resistance: ~4,020–4,040 USD/oz.
• The EMA 50 is around ~3,990-4,000, acting as interim resistance.
• If price closes H4 below ~3,950 → likely target ~3,900. If it holds above ~3,970 and rallies, target ~4,040.
• Recent H4 candles show a potential hammer/pin-bar at the support zone, but we need confirmation via a strong H4 close.
📌 Outlook:
The medium-term bias remains neutral to slightly bearish until support ~3,950-3,970 holds and price closes above ~4,000 on H4. If the support breaks, deeper declines are probable. If support holds and we see volume/momentum pick up in EU/US session, a recovery may kick in.
💡 Suggested Strategy:
🔺 BUY XAU/USD
Entry: 3,972 – 3,969
🎯 TP: 40 / 80 / 200 PIPS
❌ SL: 3,966
🔻 SELL XAU/USD
Entry: 4019 – 4022
🎯 TP: 40 / 80 / 200 PIPS
❌ SL: 4025

Can gold prices go long amid a narrow stalemate?#XAUUSD TVC:GOLD OANDA:XAUUSD
Gold prices continued to fluctuate narrowly throughout the evening⚖️, with the hourly and 2-hour moving averages converging in the 4010-4005 range, as both bulls and bears awaited a clear directional decision from the market.📊
However, from a technical perspective, gold prices have failed to break below the 4-hour moving average support at 3995 and the daily MA5 at 3985📈. These are crucial short-term support levels🚀, and the fact that gold prices haven't broken them confirms strong buying support below💪. This suggests that any short-term decline should be viewed as a technical correction rather than a market reversal.🤔
Therefore, although the short-term direction is not yet clear, considering the support formed by the 4-hour moving average and the daily MA5, I remain bullish and await a breakout from the consolidation pattern in gold prices🐂.
There may not be much clear information tonight, so let's take a look at the performance of gold prices in the Asian session👀. In summary, the current trend is still in an upward channel. As long as the 3995-3985 level holds, I will maintain a bullish view. On the upside, pay attention to the short-term resistance at 4020-4030🤩.

Above 4000, continue to be bullish on gold.#XAUUSD OANDA:XAUUSD TVC:GOLD
Gold prices fell after opening lower in Asian trading today, but rebounded after touching the key support zone of 3960-3950 and then entered a narrow range of fluctuation. Judging from the current trend, gold is still in an upward channel, and the price is still stabilizing above the daily MA5. Therefore, as long as it does not break below the daily MA5 of 3985, we can continue to maintain a bullish view.
Observing the 1H and 4H charts, we can see that the moving average support is basically maintained in the 4010-4000 range. If the gold price retraces to this range in the short term, we can consider going long on gold. Meanwhile, the first resistance level to watch is 4035-4045, which is both the rebound high point that gold prices repeatedly tested last Friday and the location of the daily MA10 moving average. Only by breaking through and stabilizing above this level will gold prices further test the upper resistance of 4050, or even higher.

XAU/USD – Wedge Compression Signaling Potential Bullish BreakoutXAU/USD – Wedge Compression Signaling Potential Bullish Breakout
Description:
Gold (XAU/USD) has been consolidating after a sharp decline from the $4,280–$4,300 resistance area, which formed a clear double-top reversal pattern — signaling short-term bearish pressure. Following this correction, the market has now developed a descending wedge formation, typically seen as a bullish reversal structure when accompanied by volume buildup and repeated support rejections.
Currently, the price is trading around the $4,010–$4,020 zone, sitting just above dynamic trendline support. A break and close above the $4,030–$4,100 supply area (highlighted in purple) would confirm a shift in market structure, potentially opening the way for a bullish leg toward $4,200 and beyond. Traders should watch for a breakout retest scenario, as a pullback to $3,960 could provide an ideal (demand re-entry zone) for continuation buyers.
On the downside, a failure to defend the $3,960 support level may expose the market to deeper liquidity sweeps near $3,886, where larger buyers could step in again to fuel a stronger upside move.
From a broader perspective, this price action reflects (accumulation behavior) following aggressive distribution earlier in the month. Momentum divergence and narrowing volatility hint that bulls are preparing for control — aligning with possible risk-off sentiment in global markets that typically benefits gold.
Bias: Bullish above $3,960 | Targets: $4,100 – $4,200 | Invalidated below: $3,886
Technical Outlook: Wedge Compression | Breakout Anticipation | Structure Shift Confirmation Pending

GOLD | Daily Analysis #3 - 3 November 2025Hello and Welcome Back to DP,
Reviews and News Coverage:
Last week chart represented major moves and volatility. In this Week we should expect following economic calendar events :
- Monday, Nov 3: ISM Manufacturing PMI
- Wednesday, Nov 5: ADP Non-Farm Employment Change AND ISM Services PMI
- Friday, Nov 7 (Tentative): Unemployment Rate & Average Hourly Earnings
Political Angle:
The ongoing U.S. government shutdown negotiations and fiscal uncertainty may increase safe-haven demand for gold. Any escalation or delay in funding could trigger a risk-off tone and push XAU/USD higher.
1H Technical Analysis:
Gold has broken its major downtrend line, signaling a potential shift from bearish to bullish bias on the intraday time frame. The price is currently trading around $4,016, consolidating just below a short-term resistance zone.
Immediate Resistance: $4,024, So a breakout here could open the door toward $4,046, then $4,083.
The next stop if pass 4024, aligns with markup.
Immediate Support: $3,998 → $3,970 zone.
If this support breaks, the next downside target is $3,947 – $3,915 region.
Momentum remains cautiously bullish after breaking the descending trendline.
The structure of higher lows indicates accumulation, but the $4,024–$4,046 resistance area must be cleared with strong candle closes to confirm continuation.
If gold rejects from $4,024 again, expect a retest of the trendline support near $3,970–$3,950.
Trading Plan Ideas:
Bullish bias above $4,024 → potential upside toward $4,046 → $4,083.
Bearish correction if price breaks below $3,998 → next supports $3,970 → $3,947 → $3,915.
Watch for volume confirmation at $4,024 or $3,970 before entry.
Disclaimer:
This content is for informational purposes only and does not constitute financial or investment advice. © DIBAPRISM
Amir D.Kohn
