Gold Double Top ATHThe all-time high forecast earlier this year by Goldman Sachs was 3,700 with an exhaust level of 3,880. I believe we will see a double top formation around 3,871 and 3,880. I do think we will see resolve before a government shutdown and this is a buy the rumor sell the news event on most USDATA coming this week. Good luck!
-This is not financial advice
Goldlong

#$XAUUAS Uptrend Hello traders friends
My forecast on #XAUUSD
I think continue to wait for gold buying power to 3900 and creating new ATH
Best regards, Honeytrading

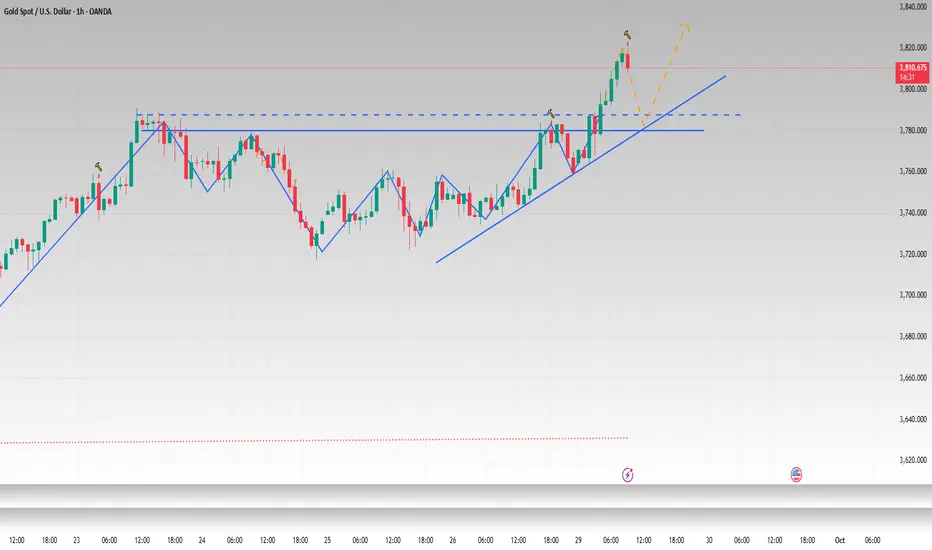
4 Hour Strong - Gold Next Level - DroidTradingGold Buying Level
Every Price Mention Possible Entry Zone.
If Tapped Take Entry as per your Risk - SL previous Candle low , Calculate SL right know.
3801 retest Level want Bullish Candle Closing - Target ( 3840-50 or 3885-90 ).
Keep SL, Book Your Daily Target
Gold shatters 3800 — momentum is alive🚀 XAUUSD – Daily Plan
New ATH Above 3800 & FOMO Buying Still Driving the Market | MMFLOW TRADING
📊 Market Context
Gold has once again surged to a new all-time high above 3800 USD/oz, with bullish momentum still intact.
Concerns over a potential US government shutdown and renewed tariff discussions have weighed on the dollar.
Market expectations of imminent Fed rate cuts continue to underpin gold.
Fed speeches and incoming US data remain short-term catalysts for volatility, but the broader bias stays bullish.
🔎 Technical Analysis (H1/H4)
Primary Trend: Strongly bullish – confirmed by Break of Structure (BOS) + Market Structure Shift (MSS).
OBB Buy Zone: 3787 – 3784, aligning with the 0.5–0.618 Fibonacci retracement, offering strong demand support.
Sell Liquidity: Clustered around 3840–3843 (FE 1.618), where short-term profit-taking or liquidity traps are likely.
🔑 Key Levels
Resistance / Sell Zone: 3840 – 3843
Support / Buy Zone: 3787 – 3784 (OBB)
📈 Trading Scenarios
✅ BUY SETUP
Buy Zone: 3787 – 3784 (OBB)
SL: 3779
TP: 3795 → 3800 → 3810 → 3820 → 3830
✔️ SELL SETUP (Liquidity Trap / Short-term Countertrend)
Sell Zone: 3840 – 3843 (FE 1.618)
SL: 3848
TP: 3830 → 3820 → 3810 → 3800
📌 Notes
Focus remains on buying dips in line with the dominant uptrend.
Short-term sells are only tactical plays within the liquidity zone (3840+).
Risk management is essential, as extended FOMO flows may drive price beyond targets.

Market just swept stoploss – time for the next 1000 pips BUY 📊 Trading Plan for Today
Main Trend: Gold has broken structure (BOS) and built strong bullish momentum. The recent sharp drop was a stoploss sweep – a liquidity grab before the next leg up.
Buy Zone:
CP Order Buy Zone: 3786 – 3784
Stop Loss: 3779
Targets (TP):
Short-term: 3820 – 3840 (Fib 1.0 – 1.272)
Long-term: 3870 – 3880 (Fib 1.618)
💡 Market Psychology
The sell-off flushed weak hands (stop hunts).
Liquidity is collected → 3786–3784 becomes a strategic buy zone.
Holding above this zone may trigger a 1000 pips bullish wave.

Swing trading, holding short positionsI executed the short trade as planned and added to the short position in batches as gold rallied. Current technical analysis is no longer valid; in the short term, gold's price is primarily driven by news events. Please remember, there is no market that only goes up and never goes down. Although most people are bullish at the moment, how many people really dare to chase the long position in an extreme rising market? Gold is currently setting new historical highs, but today gold is facing the end of the monthly line. In addition, the situation in the Middle East has eased. Once bad news comes, those who blindly go long will suffer huge losses. Therefore, in the short term, I am still inclined to short gold at the top. Since we adopt swing trading and have sufficient funds in the account, short-term floating losses are still within our controllable range. During this period, I will flexibly adjust the trading layout according to market trends. If you are currently in trouble with your short position, you can contact me for help.

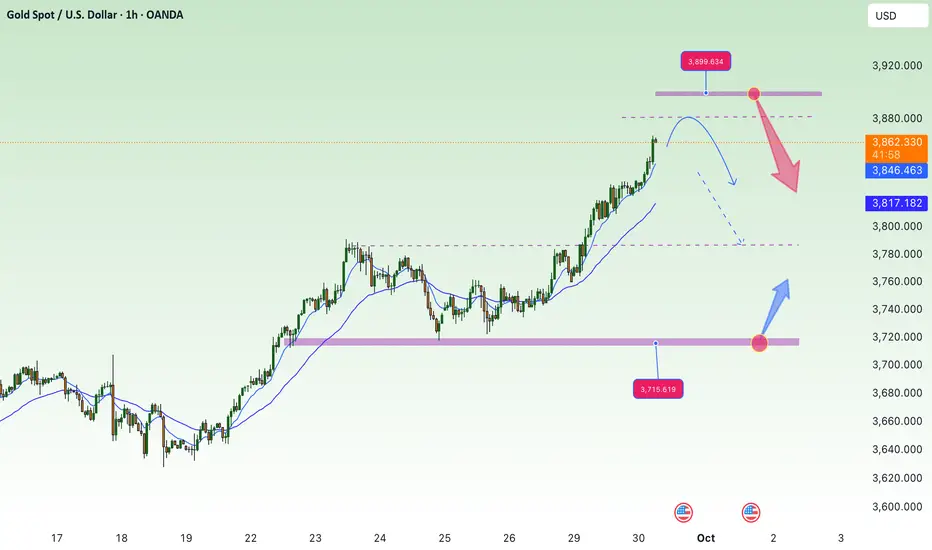
Gold 1H – Will Rejection at 3904 Trigger Deeper Pullback?Gold on the 1H timeframe is approaching a premium supply zone between 3904–3902, where a rejection could spark a short-term retracement. Market structure shows multiple BOS on the way up, but the latest move may invite engineered liquidity sweeps into nearby demand levels. A defined discount demand area rests at 3811–3813, offering potential for continuation if price reacts positively.
From the macro side, today’s headlines highlight steady U.S. dollar strength as traders weigh inflation risks and upcoming Federal Reserve commentary. Meanwhile, geopolitical concerns in energy markets are sustaining safe-haven flows, contributing to intraday volatility in gold.
This setup aligns with a tactical two-sided strategy: fade rejections at premium supply while being ready to scale into dips around the defined demand zone.
________________________________________
📌 Key Structure & Liquidity Zones (1H):
• 🔴 SELL GOLD 3904–3902 (SL 3911): Premium supply area, with downside targets at 3890 → 3870 → 3850.
• 🟢 BUY GOLD 3811–3813 (SL 3804, Demand Zone): Discount demand aligned with BOS, with upside targets at 3840 → 3855 → 3870+.
________________________________________
📊 Trading Ideas (Scenario-Based):
🔻 Sell Setup – Supply Rejection (3904–3902)
• Entry: 3904–3902
• Stop Loss: 3911
• Take Profits:
TP1: 3890
TP2: 3870
TP3: 3850
🔺 Buy Setup – Demand Mitigation (3811–3813)
• Entry: 3811–3813
• Stop Loss: 3804
• Take Profits:
TP1: 3840
TP2: 3855
TP3: 3870+
________________________________________
🔑 Strategy Note
Gold remains volatile as it tests premium supply. Expect engineered sweeps before direction becomes clear. With the dollar firm and Fed commentary pending, intraday setups favor:
• Fading supply rejections at 3904–3902.
• Buying dips into 3811–3813 if liquidity is cleared.

Gold Ascending Triangle Breakout - Targets $3,800+This chart is not only for trading, it’s also for educational purposes and shows a long-term trade setup. You can see how the triangle pattern works here.
On the monthly time frame chart shows a clear bullish structure: a rising lower-trendline (series of higher lows), a flat horizontal resistance across the highs (an ascending-triangle shape) and a breakout candle that closes above that horizontal resistance. That is a bullish monthly breakout => the path of least resistance is upward while the breakout holds. (Market context: gold was hitting fresh lifetime highs around 22 Sep 2025 as Fed easing hopes and safe-haven flows supported the move.
Price structure & pattern (what the chart is telling you)
Pattern: the formation is an ascending triangle — horizontal (flat) highs vs. rising lows. This pattern is bullish because buyers progressively step in at higher prices against a persistent overhead supply line. The measured-move technique for triangles (height of the pattern added to the breakout) is a standard way to estimate a conservative target.
Trend: monthly trend is bullish — higher highs and higher lows inside a rising channel drawn above and below price. The breakout out of the triangle also cleared the upper channel midline, increasing odds of a run to the upper channel boundary.
Confirmation to watch: a monthly close back below the breakout level and the rising trendline would weaken the bullish case.
Practical Measured Target
Using the measured-move method gives a conservative first target:
Example estimate from the chart: take the triangle height ≈ (resistance ~3,450) − (swing low ~3,100) = 350. (3,450 − 3,100 = 350).
Add the height (350) to the breakout level (~3,450) → 3,450 + 350 = 3,800 as the first measured target; extension toward the top of the longer-term channel puts price into the ~3,900–4,000 neighborhood if momentum continues. (This is the standard target method — actual numbers depend on the exact points you measure on the chart).
Key levels
Immediate resistance / near-term targets: 3,700–3,900 (measured target and channel top).
Immediate support (first line): the breakout zone / prior flat resistance (now support) — roughly 3,350–3,450 on the chart.
Secondary support: rising lower-trendline / channel mid — roughly 3,100–3,250.
Strong structural support well below: 2,700–2,800 (major prior lows and horizontal red lines on the chart).
Use these as rules-of-thumb zones: if price reclaims and holds the breakout zone, bulls remain in control; if price closes monthly back below the rising trendline, the bullish pattern has failed.
Macro drivers & why the breakout matters now
Interest-rate expectations and real yields are the dominant macro drivers for gold: falling real yields (and expectations of Fed rate cuts) make gold more attractive, and the 2025 rally has been powered by that dynamic. Central-bank buying, geopolitical uncertainty and demand flows are additional tailwinds.
U.S. dollar: gold usually trades inverse to the DXY. Around the breakout date the dollar was not significantly stronger (DXY in the high-90s), which removes a major headwind for gold’s advance. If the dollar weakens further, that amplifies an upside path for gold; if the dollar rallies strongly, it increases the chance of a corrective pullback.
Scenarios (how to think about probabilities)
Bull case (highest probability while breakout holds): price follows measured-move to the ~3,800 region and then challenges the upper channel toward ~3,900–4,000 as momentum and lower real yields continue.
Base case (consolidation): a breakout retest — price dips back to the breakout zone (~3,350–3,450), finds buyers, then resumes uptrend (this is healthy and common).
Bear case (pattern failure): monthly close back under the rising trendline (and below ~3,100) — that would open a deeper correction toward 2,900–2,700 and reduce the bullish edge.
Trade plan and risk management (long-term investors vs traders)
Long-term investor (multi-year): if you believe in the macro thesis (lower real yields, central bank demand), holding through volatility is reasonable; consider layering in on pullbacks to the breakout zone (~3,350–3,450) with wider stops and position sizing for multi-year exposure.
Tactical trader (swing/position): the conservative trade is to wait for a breakout retest to the former resistance (buy on confirmed support hold). Entry zone: ~3,350–3,450 with a stop below the rising trendline (e.g., below ~3,100 in the chart) and targets at measured-move (~3,800) and then the channel top (~3,900–4,000). If you prefer momentum entries, a clean monthly close above the breakout with continued follow-through on the next monthly candle is a valid trigger, but tighten stops.
Always size positions so a failure (close below the rising trendline) does not blow you out — place stop levels outside normal monthly noise.
Extra checks (what to watch next)
Watch U.S. inflation prints, Fed commentary and the 10-year real yields — those will be the largest macro switches that could change the story.
Watch DXY moves: a durable dollar rally would increase the odds of a deeper retracement.
On the chart: volume/flow confirmation on the breakout (higher volume on breakout is healthier); monthly-MA alignment (longer MAs acting as support) — these help confirm sustainability.
One-line conclusion
Monthly chart shows a classically bullish ascending-triangle breakout with a conservative measured target near ~3,800 and upside extension possible toward ~3,900–4,000 if macro drivers (falling real yields, Fed easing expectations, weak dollar) remain supportive; a monthly close back below the rising trendline (~3,100 area on the chart) would invalidate the bullish scenario.
Note
Please risk management in trading is a Key so use your money accordingly. If you like the idea then please like and boost. Thank you and Good Luck!

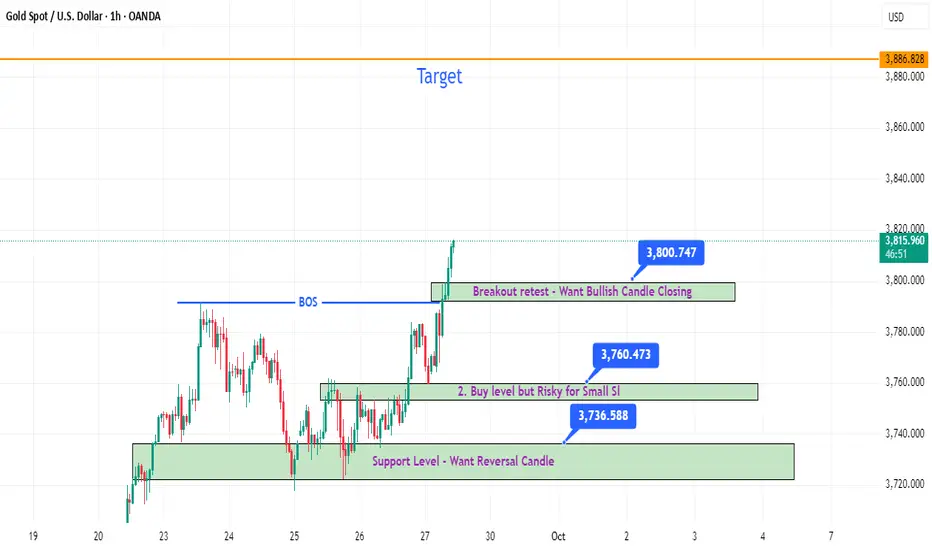
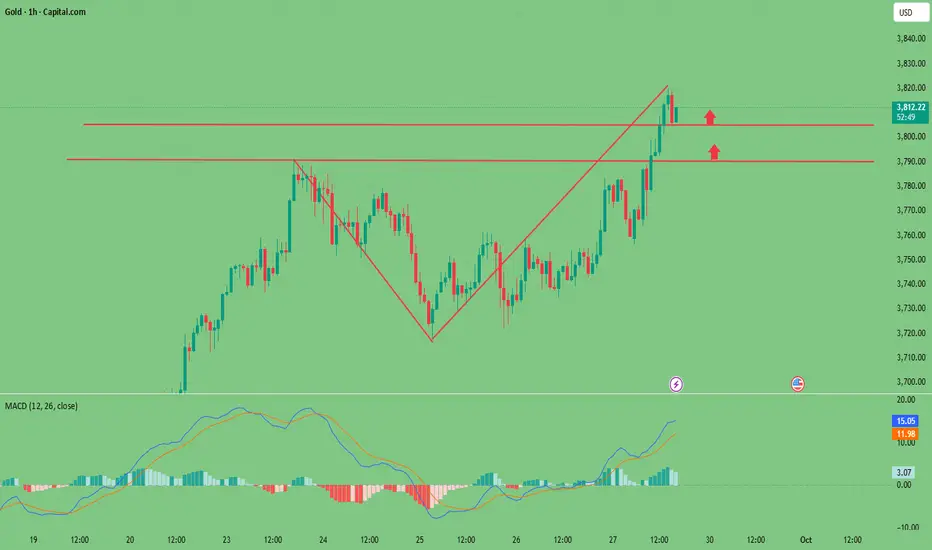
XAU/USD – Bulls Eyeing Breakout Toward 3,820From my point of view, Gold (XAU/USD) is showing signs of strength after rejecting support levels multiple times. The chart highlights a clear horizontal range where buyers have consistently stepped in around the 3,713 – 3,720 zone. This area is acting as a strong base, signaling that demand is present whenever price dips lower.
On the other side, resistance near 3,780 has been tested several times, and each rejection has been weaker than the last – which often signals that sellers are losing control. A breakout above this zone could unleash a strong impulsive rally.

Gold Hits New High at $3831 – Can the Rally Hold?📌 Market Overview
Gold (XAU/USD) surged today, marking a fresh high at $3831/oz, breaking well above previous resistance zones. The rally was fueled by expectations of a potential Fed policy adjustment, a weaker USD, and rising safe-haven demand amid ongoing financial and geopolitical uncertainties.
📊 Technical Analysis
• Key Resistance: 3831 (new high) – 3850
• Immediate Support: 3805 – 3790
• EMA 50 & EMA 200 (H1/H4): Both trending upward, confirming short-term bullish momentum.
• RSI (H1): Approaching overbought territory >70, signaling potential short-term correction.
• Chart Pattern: Strong parabolic rally, though vulnerable to a pullback toward support.
🧐 Outlook
The current uptrend remains supported by safe-haven flows and policy easing expectations. However, with gold posting new highs, profit-taking pressure may emerge near the 3830–3850 zone. A technical pullback to test support is a likely scenario in the short term.
🎯 Trading Strategy
• Cautious BUY: Consider buying on pullbacks toward 3805–3790, SL below 3785.
• Short-term SELL (scalping): Consider selling near 3830–3835, SL above 3840, short TP of 40–80 pips.
• Risk management is essential — avoid FOMO entries at the peak levels.

Bulls continue to increase prices, creating new ATH⭐️GOLDEN INFORMATION:
With little on the US calendar, Fed officials dominated headlines on Monday. St. Louis Fed President Alberto Musalem repeated his hawkish stance, warning that inflation expectations remain elevated despite rising risks of labor market weakness. New York Fed President John Williams noted that policy is restrictive enough to pressure inflation lower, while the labor market shows gradual signs of softening. Meanwhile, Cleveland Fed President Beth Hammack stressed that inflation is still too high and blamed tariffs for stalling the disinflation process.
⭐️Personal comments NOVA:
Markets are positive, rising after expectations of a rate cut in October increased.
⭐️SET UP GOLD PRICE:
🔥SELL GOLD zone: 3900- 3902 SL 3907
TP1: $3890
TP2: $3880
TP3: $3870
🔥BUY GOLD zone: $3819-$3817 SL $3812
TP1: $3828
TP2: $3840
TP3: $3850
⭐️Technical analysis:
Based on technical indicators EMA 34, EMA89 and support resistance areas to set up a reasonable BUY order.
⭐️NOTE:
Note: Nova wishes traders to manage their capital well
- take the number of lots that match your capital
- Takeprofit equal to 4-6% of capital account
- Stoplose equal to 2-3% of capital account
Gold may reach a new high, are you ready to go long?Before updating my views, I would like to remind all my friends again: the market is always full of possibilities. There is no so-called "highest point", only higher possibilities. When the trend is clearly upward, going with the flow is the core strategy to achieve stable profits. Avoid trading against the trend or on an emotional basis, especially in the current volatile market environment. Trading without clear thinking and discipline can easily lead to unnecessary losses. For those who are still on the sidelines and haven't yet developed an effective trading strategy, please follow my channel. We will continue to provide professional market analysis, comprehensive trading plans, and precise buy and sell instructions to help you better grasp the market's rhythm.
Looking back at the performance of the gold market on Monday, gold prices once again saw a strong rise, successfully breaking through multiple key integer levels and continuously setting new highs during the session. The overall trend almost perfectly replicated the strong pattern of last Monday. As I have emphasized many times during the trading session, the current market operating rhythm is highly referenceable, especially the continuity of technical forms and capital momentum is very obvious. Therefore, I recommend investors focus on historical trend similarities and use this as a key indicator for judging the current direction. In fact, last Monday's strategy of mainly buying on pullbacks has been fully verified by the market, and investors holding long positions at low levels have already reaped considerable profits. Looking ahead to today's market, I believe we can still refer to last Tuesday's trend path for positioning. From the current technical perspective, gold remains in a typical upward trend, with moving averages showing a bullish alignment, strong trading volume, and strong buying sentiment. Considering the macroeconomic environment, continued global demand for safe-haven assets, coupled with expectations of looser monetary policies in some economies, further supports the upward trend of precious metals. Therefore, I continue to hold a bullish view on today's gold price. I expect the price to hit a new high and the increase may further expand.
In terms of specific operating strategies, it is recommended that investors establish long positions in batches around 3820, control the position ratio, and avoid entering the market with heavy positions at one time. If there is a brief intraday pullback and the price falls back to the 3810 to 3805 range, it can be seen as an ideal opportunity to increase positions. This area is not only the support level of the previous intensive trading area, but also the golden section position of short-term technical pullback, with strong dual psychological and technical support. Once the price stabilizes and rebounds, the probability of an upward breakout will significantly increase.
It is important to note that although the current trend is strong, no market can rise unilaterally and indefinitely, and more attention should be paid to risk management when volatility intensifies. Be sure to set reasonable stop-loss protection to avoid losses caused by sudden news or drastic fluctuations in liquidity. At the same time, it's important to closely monitor potential influencing factors and adjust your position structure promptly.
In short, in a market with clear trends, maintaining patience and steadfastly executing your established strategy are the keys to success. Let's seize the opportunities presented by this gold rally, trade rationally, and move forward steadily.

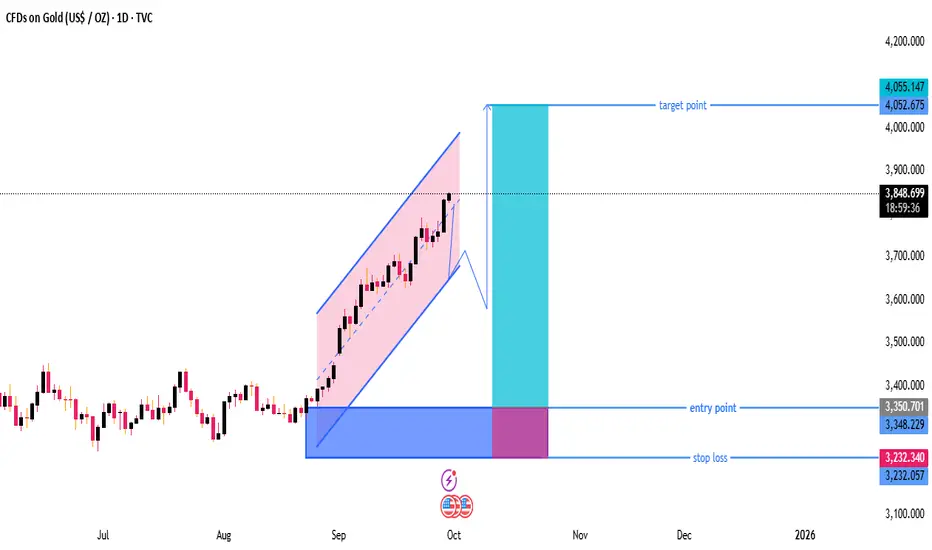
Gold Daily Chart – Buy-the-Dip Setup Towards 4,050 Targethe chart shows XAU/USD (Gold) on a daily timeframe.
Price is currently trading around 3,848, within a rising parallel channel.
A possible pullback from the channel top is indicated before a move higher toward the target.
---
Key Levels & Zones
Entry Point:
Around 3,350 zone marked as the ideal buy area.
This is near the lower support region of previous consolidation.
Stop Loss:
Placed around 3,232, which is below key support.
Good for risk management — avoids staying in trade if price breaks structure.
Target Point:
Around 4,052 – 4,055, aligning with the measured move from the breakout of the channel.
This gives a strong risk-to-reward ratio (roughly 2.5:1).
---
Technical Structure
Trend: Strong uptrend – price respecting ascending channel.
Momentum: Higher highs and higher lows confirm bullish market structure.
Possible Scenario:
1. Short-term pullback expected to lower boundary or breakout retest zone.
2. Continuation move upward toward target (around 4,050).
---
Trading Plan Based on Chart
Wait for Pullback: Don’t buy at current level; price might retrace before next leg.
Enter near 3,350: Ideal long position entry point.
Stop Loss: 3,232 (safe under last swing low).
Target: 4,052–4,055 (previous high / projected channel top).
---
Summary
✅ Bias: Bullish (Buy-the-dip strategy)
📈 Entry: ~3,350
⛔ Stop Loss: ~3,232
🎯 Target: ~4,050
📊 Risk/Reward: Favorable — approx. 1:3
This setup is swing-trade friendly and follows trend continuation logic.
XAUUSDHello Traders! 👋
What are your thoughts on GOLD?
Gold has successfully broken out of its descending channel. After the breakout, price faced resistance and entered a corrective phase.
Price is likely to complete a correction and a pullback to the broken channel.
Once the pullback is complete, gold is expected to resume its bullish momentum.
The next upward move could lead to the formation of new highs.
As long as price holds above the broken channel, the bullish scenario remains valid.
A drop back inside the channel would weaken this setup
What do you think? Will gold continue its rally?
Don’t forget to like and share your thoughts in the comments! ❤️

Gold 1H – Will the Breakout from Range Sustain?Gold on the 1H timeframe has broken out of its previous consolidation range and is now testing a premium supply zone near 3828–3826. The structure shows a clear BOS after the range, supported by strong bullish momentum. However, engineered liquidity sweeps remain likely before the market establishes sustained direction.
From the macro side, today’s headlines highlight persistent inflation worries and a stronger U.S. dollar as traders anticipate upcoming remarks from Federal Reserve officials. Geopolitical tensions in energy markets have also underpinned safe-haven flows, adding volatility to gold price action.
This alignment of macro drivers and technical liquidity pools suggests two tactical scenarios: fading rejections at supply while preparing to buy dips into the defined demand zone.
________________________________________
📌 Key Structure & Liquidity Zones (1H):
• 🔴 SELL GOLD 3828–3826 (SL 3835): Premium supply zone with upside liquidity sweep potential, offering downside targets at 3810 → 3790 → 3775.
• 🟢 BUY GOLD 3757–3759 (SL 3750, Demand Zone): Discount demand area aligned with BOS, with upside targets at 3765 → 3780 → 3795+.
________________________________________
📊 Trading Ideas (Scenario-Based):
🔻 Sell Setup – Supply Rejection (3828–3826)
• Entry: 3828–3826
• Stop Loss: 3835
• Take Profits:
TP1: 3810
TP2: 3790
TP3: 3775
🔺 Buy Setup – Demand Mitigation (3757–3759)
• Entry: 3757–3759
• Stop Loss: 3750
• Take Profits:
TP1: 3765
TP2: 3780
TP3: 3795+
________________________________________
🔑 Strategy Note
Gold remains volatile after breaking out of consolidation. Expect engineered sweeps into both supply and demand zones before directional clarity develops. With macro headlines keeping the dollar firm and inflation risks alive, traders should watch for sharp intraday reversals:
• Fade supply rejections if momentum stalls at 3828–3826.
• Buy dips into demand if liquidity is swept cleanly around 3757–3759.
The broader narrative supports a two-sided strategy until the Fed provides clearer guidance.

Gold Buy Setup – Buy the Dip Towards 3868 Target1. Trend:
Price is in a clear uptrend within a rising channel (highlighted in pink).
Currently, price is at the upper boundary of the channel, showing a potential short-term pullback before continuing higher.
2. Key Levels:
Entry Point: Around 3,766 – 3,765 (blue zone).
Stop Loss: Around 3,748 (below the channel support).
Target Point: 3,868 (top blue line).
3. Chart Pattern:
Price has formed a bullish flag/channel.
The projected move suggests a pullback to support (blue entry zone), then a bounce to the target area.
4. Risk-to-Reward Ratio:
Risk: ~18 points (from 3,766 entry to 3,748 stop loss).
Reward: ~100 points (from 3,766 entry to 3,868 target).
R:R ≈ 1:5.5, which is very favorable.
---
Trading Idea
Bias: Bullish (Buy setup)
Plan:
Wait for price to drop near 3,765 entry zone.
Place stop loss just below support at 3,748.
Target the upper zone around 3,868.
---
Summary
This chart shows a buy-the-dip strategy within an uptrend.
The plan is to enter near the channel support, with a tight stop loss, aiming for a continuation of the bullish move toward the target.
✅ Strong R:R setup
✅ Trend-following trade
⚠ Risk: If price breaks below 3,748, trend may reverse or consolidate deeper.

The 3800 mark has been broken, is it time to buy gold?In this round of rise, risks and opportunities coexist. As long as you follow the trend and plan your positions reasonably, it is not difficult to make profits from trading. Friends who encounter trading difficulties and trading losses should not panic. I have prepared detailed trading plans in the channel.
History often repeats itself, and the market keeps repeating itself. It was predicted in last week’s opinion that the key turning point may be this week. Sure enough, today's market opened with an uptick, with prices rising to around 3785 before gathering momentum. During this decline, I successfully took a short position and took profit. Gold prices subsequently stabilized in the 3770 area, allowing bulls to break through the 3800 mark and continue their upward trend.
What is strikingly similar to last week is that the same integer thresholds were completed on Mondays, and the market has been rising for several consecutive Mondays. In this case, after seeing the bulls stabilize, I did not hesitate to go long in the 3790 area. As for whether the gold bulls can be as rapid as last week, we still have to focus on whether the 3800 points in the New York session can be successfully stabilized!
XAUUSD Has Left the buildingOn the way up, we first found support at the L-MLH (1).
Then the Centerline stepped in as resistance (2), but it eventually couldn’t hold price down.
Eating through the Centerline like a mouse through cheese, price found support again at (2) before blasting upward to the U-MLH — and quickly through it.
Once again, the U-MLH turned from prior resistance into fresh support.
From there, price mirrored (2), moving sideways before blasting off to the moon! 🚀
I’m surprised that WL1 offered no resistance at all.
Now that we’ve left WL1 behind, WL2 is the next target.
Watching the show patiently.

Gold at Key Decision Zone: Breakout or Breakdown?Hello guys!
Let's analyze Gold!
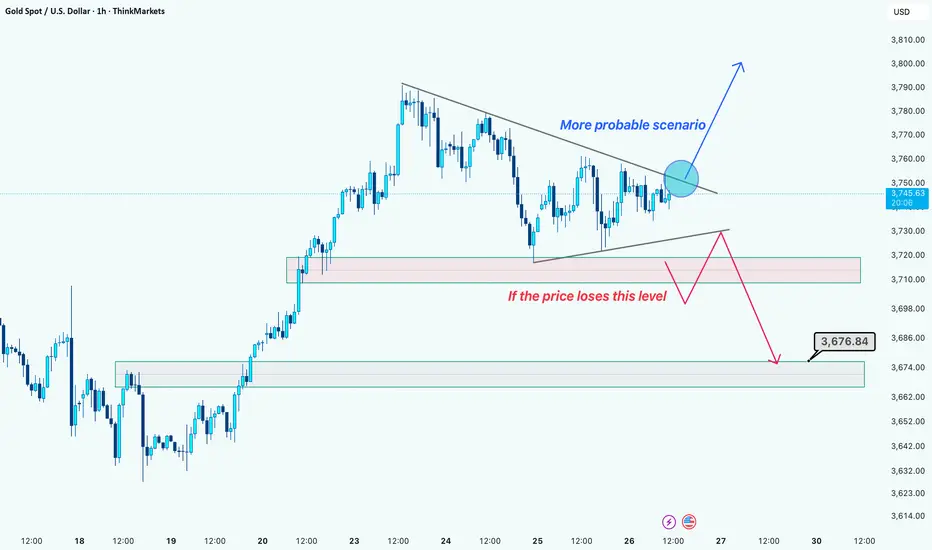
🔸 Current Market Structure
Price is consolidating inside a symmetrical triangle after a strong bullish run.
Momentum remains positive, but sellers are defending the upper trendline.
Key short-term support is around 3,720 – 3,710 zone.
🔺 Bullish Scenario (More Probable)
If price breaks above the triangle resistance, we could see continuation toward 3,770 – 3,790 levels.
Structure favors buyers as long as price holds above 3,720.
🔻 Bearish Scenario (Alternative)
If the price loses the 3,710 support zone, sellers may take control.
Downside targets:
First support: 3,690 – 3,680 zone
Key target: 3,676 area
🔹 Conclusion
More probable scenario: A bullish breakout continuation.
Risk to watch: If the support fails, the price could quickly revisit 3,676.
Best approach: Wait for a confirmed breakout before entering.
Disclaimer: As part of ThinkMarkets’ Influencer Program, I am sponsored to share and publish their charts in my analysis.

5 Mistakes Even Veteran Traders Make!Whether you're new or experienced, you can still fall into these 5 DEADLY mistakes. I'm here to point them out!
Mistake #1: Not understanding what you’re trading.
You’re trading forex, right? But do you know what pips or lots are? How currency pairs move? Or how news impacts them? Too many people dive in just because they see others profiting, without knowing what they’re betting on. That’s the difference between investing and gambling.
Don’t jump into the ocean without knowing what’s underwater.
Mistake #2: Not managing your money.
Most traders obsess over making money but forget how to protect it. It’s human nature—everyone wants fast cash! But if you trade big without control, one bad move can wipe out a month or even a year’s gains. Remember, keeping your capital safe is priority number one; profits come as a result.
As long as you’ve got the forest, you won’t run out of firewood.
Mistake #3: No clear trading plan.
Are you entering trades based on feelings? Exiting because of a “hunch”? That’s not trading—it’s playing the lottery! A trading plan is your compass, your map to stay on track. It needs clear entry points, stop-loss levels, and profit targets. Most importantly, you MUST stick to it!
Sticking to strategy doesn't make us invincible, but it can help us retreat safely.
Mistake #4: FOMO – Fear of Missing Out!
You see prices soaring and chase them, or you copy someone’s trade because they’re showing off profits. Then, when you lose, you blame the market or some “expert,” forgetting it was YOUR choice to trade. Drop this habit! Stop following the crowd and own your trading decisions.
You can’t live by envying someone else’s wallet.
Mistake #5: Trading addiction and chasing short-term wins.
Win one trade, and you want more. Lose one, and you want to “get even” with the market. This traps you in a cycle of overtrading and rash decisions. Profits don’t come from trading a lot—they come from trading RIGHT.
Don’t let emotions take over. Remember, When emotions rise, logic falls.
These 5 mistakes can burn all your money, no matter how much you have. Be honest with yourself and learn from them. I believe if you avoid these traps and stay disciplined, the door to success will open wide.
I’m Anfibo, just sharing what I know about finance.

Gold Price Analysis – XAU/USD Hits New All-Time High at 3812🌍 Market Developments
Gold prices continue to surge, reaching a new record high at $3,810/oz in today’s session. The rally is driven by expectations that the Federal Reserve will maintain a dovish policy stance, a weakening US dollar, and falling US Treasury yields. Safe-haven demand is also supported by ongoing geopolitical tensions and fears of a global economic slowdown.
📈 Technical Analysis
• Key Resistance: 3815 – 3825
• Immediate Support: 3785 – 3770, with deeper support at 3750
• EMA 50 & 100: both trending upward, confirming strong bullish momentum
• H1 and H4 candles show powerful upward momentum, though RSI is approaching overbought territory → possible pullbacks or short-term volatility
💡 Outlook
The primary trend remains bullish, but the sharp rally after setting a new record may trigger profit-taking around the 3815 – 3830 zone. As long as gold holds above 3770, the bullish bias remains intact.
🎯 Trading Strategy Suggestion
🔺 BUY XAU/USD : 3780 – 3777
🎯 TP: 40/80/200 pips
🛑 SL: 3773
🔻 SELL XAU/USD : 3817 – 3822
🎯 TP: 40/80/200 pips
🛑 SL: 3827

3780-3790: A potential price reversal point; buy on dips.On Friday night, we expect gold to hit a new high of 3800-3810 after holding the key support of 3765-3755. At present, gold has broken through the expected target and is expected to move towards 3830.
The current geopolitical situation has worsened, and the new round of tariffs that came into effect on October 1st has continuously stimulated the market's risk aversion sentiment, causing investors to flock to the gold market to seek risk shelter. Today's news needs to focus on the U.S. trading session. Members of the U.S. Congress from both parties are negotiating on avoiding a government shutdown. The U.S. government faces the risk of shutdown. If it is not effectively resolved, this will affect the subsequent release of key data such as NFP CPI.
With the rising gold price, it has broken through previous resistance and reached a new high. The previous high of 3780-3790 has become a key level for a potential trend reversal. During the European session, if gold retraces to this range, we can consider buying gold with a target of 3820-3830.