Gold at Key Decision Zone: Breakout or Breakdown?Hello guys!
Let's analyze Gold!
🔸 Current Market Structure
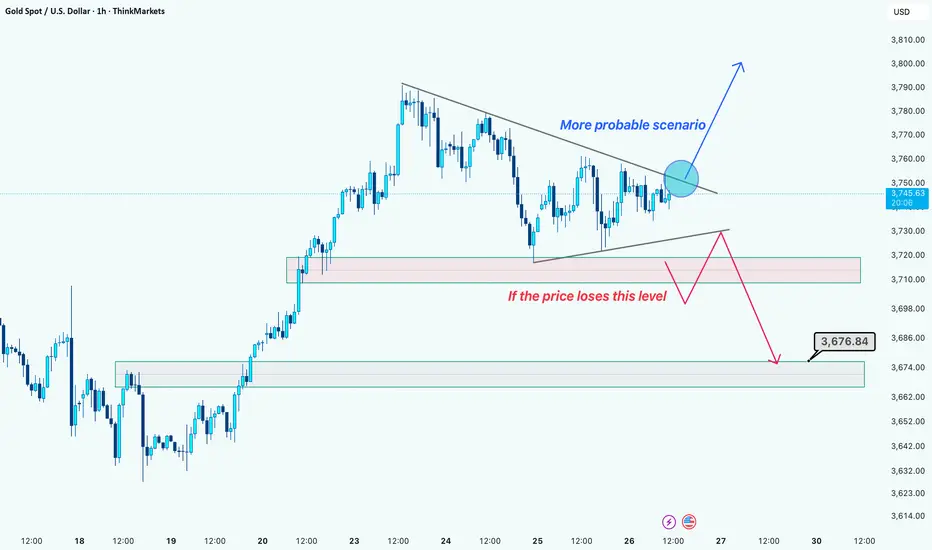
Price is consolidating inside a symmetrical triangle after a strong bullish run.
Momentum remains positive, but sellers are defending the upper trendline.
Key short-term support is around 3,720 – 3,710 zone.
🔺 Bullish Scenario (More Probable)
If price breaks above the triangle resistance, we could see continuation toward 3,770 – 3,790 levels.
Structure favors buyers as long as price holds above 3,720.
🔻 Bearish Scenario (Alternative)
If the price loses the 3,710 support zone, sellers may take control.
Downside targets:
First support: 3,690 – 3,680 zone
Key target: 3,676 area
🔹 Conclusion
More probable scenario: A bullish breakout continuation.
Risk to watch: If the support fails, the price could quickly revisit 3,676.
Best approach: Wait for a confirmed breakout before entering.
Disclaimer: As part of ThinkMarkets’ Influencer Program, I am sponsored to share and publish their charts in my analysis.
Goldlong

5 Mistakes Even Veteran Traders Make!Whether you're new or experienced, you can still fall into these 5 DEADLY mistakes. I'm here to point them out!
Mistake #1: Not understanding what you’re trading.
You’re trading forex, right? But do you know what pips or lots are? How currency pairs move? Or how news impacts them? Too many people dive in just because they see others profiting, without knowing what they’re betting on. That’s the difference between investing and gambling.
Don’t jump into the ocean without knowing what’s underwater.
Mistake #2: Not managing your money.
Most traders obsess over making money but forget how to protect it. It’s human nature—everyone wants fast cash! But if you trade big without control, one bad move can wipe out a month or even a year’s gains. Remember, keeping your capital safe is priority number one; profits come as a result.
As long as you’ve got the forest, you won’t run out of firewood.
Mistake #3: No clear trading plan.
Are you entering trades based on feelings? Exiting because of a “hunch”? That’s not trading—it’s playing the lottery! A trading plan is your compass, your map to stay on track. It needs clear entry points, stop-loss levels, and profit targets. Most importantly, you MUST stick to it!
Sticking to strategy doesn't make us invincible, but it can help us retreat safely.
Mistake #4: FOMO – Fear of Missing Out!
You see prices soaring and chase them, or you copy someone’s trade because they’re showing off profits. Then, when you lose, you blame the market or some “expert,” forgetting it was YOUR choice to trade. Drop this habit! Stop following the crowd and own your trading decisions.
You can’t live by envying someone else’s wallet.
Mistake #5: Trading addiction and chasing short-term wins.
Win one trade, and you want more. Lose one, and you want to “get even” with the market. This traps you in a cycle of overtrading and rash decisions. Profits don’t come from trading a lot—they come from trading RIGHT.
Don’t let emotions take over. Remember, When emotions rise, logic falls.
These 5 mistakes can burn all your money, no matter how much you have. Be honest with yourself and learn from them. I believe if you avoid these traps and stay disciplined, the door to success will open wide.
I’m Anfibo, just sharing what I know about finance.

Gold Price Analysis – XAU/USD Hits New All-Time High at 3812🌍 Market Developments
Gold prices continue to surge, reaching a new record high at $3,810/oz in today’s session. The rally is driven by expectations that the Federal Reserve will maintain a dovish policy stance, a weakening US dollar, and falling US Treasury yields. Safe-haven demand is also supported by ongoing geopolitical tensions and fears of a global economic slowdown.
📈 Technical Analysis
• Key Resistance: 3815 – 3825
• Immediate Support: 3785 – 3770, with deeper support at 3750
• EMA 50 & 100: both trending upward, confirming strong bullish momentum
• H1 and H4 candles show powerful upward momentum, though RSI is approaching overbought territory → possible pullbacks or short-term volatility
💡 Outlook
The primary trend remains bullish, but the sharp rally after setting a new record may trigger profit-taking around the 3815 – 3830 zone. As long as gold holds above 3770, the bullish bias remains intact.
🎯 Trading Strategy Suggestion
🔺 BUY XAU/USD : 3780 – 3777
🎯 TP: 40/80/200 pips
🛑 SL: 3773
🔻 SELL XAU/USD : 3817 – 3822
🎯 TP: 40/80/200 pips
🛑 SL: 3827

3780-3790: A potential price reversal point; buy on dips.On Friday night, we expect gold to hit a new high of 3800-3810 after holding the key support of 3765-3755. At present, gold has broken through the expected target and is expected to move towards 3830.
The current geopolitical situation has worsened, and the new round of tariffs that came into effect on October 1st has continuously stimulated the market's risk aversion sentiment, causing investors to flock to the gold market to seek risk shelter. Today's news needs to focus on the U.S. trading session. Members of the U.S. Congress from both parties are negotiating on avoiding a government shutdown. The U.S. government faces the risk of shutdown. If it is not effectively resolved, this will affect the subsequent release of key data such as NFP CPI.
With the rising gold price, it has broken through previous resistance and reached a new high. The previous high of 3780-3790 has become a key level for a potential trend reversal. During the European session, if gold retraces to this range, we can consider buying gold with a target of 3820-3830.
XAUUSD – Prioritize buying after gold sets ATHXAUUSD – Prioritize buying after gold sets ATH, target 3840
Hello Trader,
Right at the start of the week, gold established a new ATH, affirming that the upward trend remains dominant. The price structure on H1 shows that buying pressure remains quite strong, while adjustments are mainly to balance liquidity. Given the current context, the preferred trading strategy is still to wait for buying opportunities at key support areas, with a target towards 3840.
Fundamental Context
This week, the usual focus would be on the Nonfarm Payrolls (NFP) data. However, the risk of a U.S. Government shutdown might delay this crucial report.
The U.S. fiscal year runs from 10/1 to 9/30. If Congress does not pass all 12 spending bills, agencies without allocated budgets will have to cease operations.
In the absence of significant economic information, gold continues to benefit from safe-haven sentiment and fiscal policy uncertainty.
Technical Perspective
The price has broken out and set an ATH, with the 3837 – 3840 area currently being a strong resistance (Fibonacci + market psychology).
The 3770 – 3773 area is a nearby support, coinciding with the trendline and previous liquidity, suitable for buying.
The MACD on H1 indicates that buying momentum is still maintained, but a correction is needed for the price to balance before breaking higher.
Trading Strategy
Short-term Sell (at resistance):
Entry: 3837 – 3840
SL: 3844
TP: 3830 – 3800 – 3770
Note: This is merely a reactive order at resistance, going against the main trend, so manage risk tightly.
Preferred Buy (trend-following):
Entry: 3770 – 3773
SL: 3766
TP: 3784 – 3799 – 3810 – 3838
Conclusion
This week, gold still prioritizes the Buy strategy at support areas. The main target is towards 3840, a significant resistance area and a benchmark for trend strength. The Sell order is only short-term at resistance, while the main scenario is still to wait for a correction to buy up.
Follow me for updates on short-term scenarios throughout the week, especially as fluctuations from U.S. news and fiscal policy can strongly impact gold.

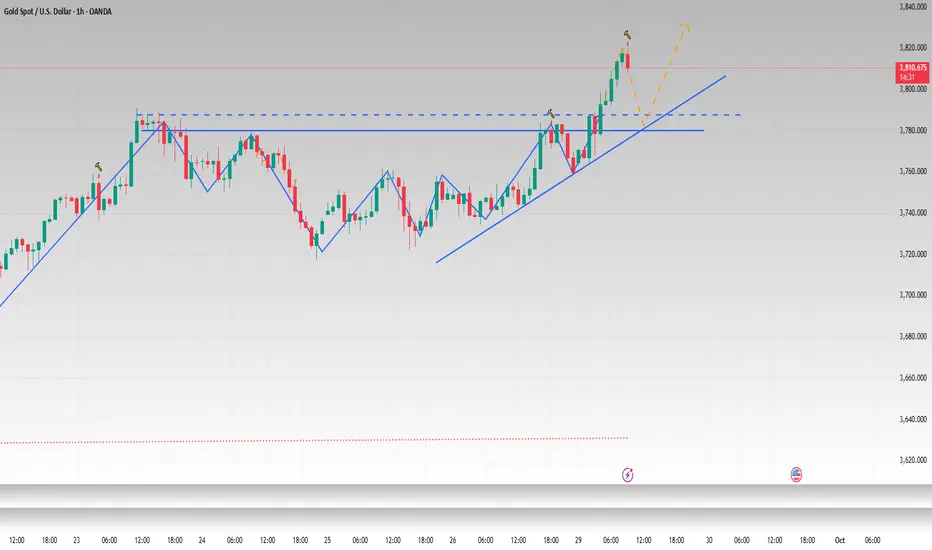
Gold could continue higher!Price had been consolidating, where sellers tried to cap momentum but could only slow buyers down, not reverse them. Buyers steadily building pressure. Eventually, price broke through the flag’s resistance line with conviction, signaling a strong continuation move.
If price retests the broken flag boundary and holds above, that’s your long entry signal, confirming buyers are in full control and preparing for the next impulsive leg higher.
My target would be around 3 800.

1 Hour TF - GOLD Next Buying Level- Droid TradingGold in Consolidation Zone B/W Strong Resistance or OB-FVG
New Buying Level - 3680-85 ( Strong Buying)
Again Tapping 3610-3615 ( Buying Possible After Bullish candle 1 hour Closing Above)
1 hour candle Closing Above Strong Resistance - Buying Possible ( 3670-75 to Target ATH )
Wait for entry, don't in hurry, Keep SL, Book Profit as Your Daily Target
Entry only in Level

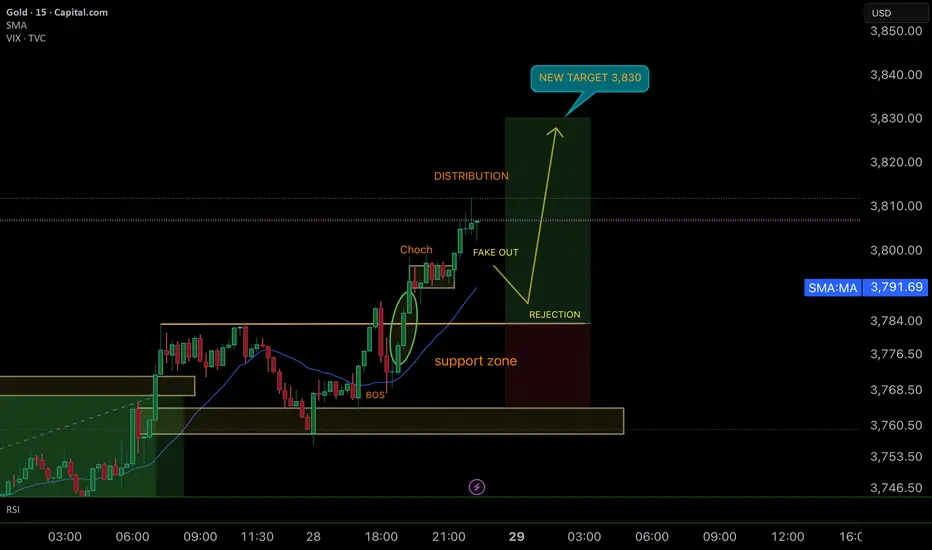
SMART MONEY CONCEPT (SMC)📊 Bullish Analysis – GOLD 15M
🔑 Technical Context
1. Support Zone Exhausted
Price respected the support base and then broke upwards with strength, showing institutional buyers defended the area.
2. BOS (Break of Structure)
The break of the previous bearish structure confirmed the start of bullish momentum.
3. ChoCh (Change of Character)
A clear ChoCh confirmed the shift in direction, validating the intention to reach new highs.
4. Fake Out & Rejection
After distribution, a fake out cleaned liquidity before projecting higher. The rejection zone is the key confirmation for the entry.
🎯 Projection
• Entry: At the rejection after the fake out.
• Target (TP): 3,830 – aiming for new highs (HH).
• Stop Loss (SL): Below support zone to protect invalidation.
📌 Conclusion
Market has consolidated, grabbed liquidity, and is ready to continue bullish momentum towards 3,830. Waiting for confirmation at rejection is key for high-probability setups.
GOOD LUCK TRADERS…. ;)
Gold Bulls Eyeing $3,800+ – Key Buy Areas RevealedGold is currently holding inside a rising channel structure after making an ATH near $3,790. The market has pulled back from the high and is consolidating around key trendline support. The immediate buy area lies near $3,730–$3,740, which also aligns with the trendline support. A deeper dip towards $3,710–$3,715 could offer a stronger buy trigger zone if price retests.
On the upside, gold will likely revisit the $3,790 ATH, and a sustained move above this level may extend towards $3,800–$3,820 in the coming sessions. Overall, the market bias remains bullish as long as price holds above the $3,710–$3,692 support region, with consolidations and pullbacks seen as part of the broader upward trend.
🔑 Key Levels to Watch:
- Resistance: $3,760–$3,765
- Support: Immediate support $3,730 and strong support $3,710–$3,715
📌 Buy Zone & Buy Trigger:
- Buy Zone: $3,720–$3,730
- Buy Trigger: The buy trigger area is $3,760–$3,765, where a breakout above the descending resistance from the ATH would indicate renewed bullish momentum.
Note
Please risk management in trading is a Key so use your money accordingly. If you like the idea then please like and boost. Thank you and Good Luck!

𝐌𝐓𝐗 | Pitstop Zone to Continue the 1,300 Pip Potential Rally1️⃣ Key Levels
• 729 – 737 → Major golden support zone.
• 759 – 760 → Key resistance / breakout trigger.
• 691 – 683 → Strongest potential buy zone of the week.
⸻
2️⃣ Expected Scenarios
• Bearish:
• 4H close below 759 → retest of the 729–737 support zone.
• 4H close below 729 → extension toward 709 → 700 → 691.
• Zone 691–683 is the most important potential reversal area this week, with multiple confluences, possibly triggering a strong rally toward the 3800 high again.
• Bullish:
• 4H close above 760 → continuation toward 780 → 791.
• 4H close above 792 → further bullish momentum targeting 808 → 817 → 830.
⸻
⚖️ Summary
The market is positioned between critical zones:
• Holding above 759–760 confirms strength toward 830.
• Breaking below 729 increases the probability of testing the 691–683 demand zone, which could be the week’s strongest reversal setup.

Gold is Ready For Bull From Trendlines Hello Traders
In This Chart GOLD HOURLY Forex Forecast By FOREX PLANET
today Gold analysis 👆
🟢This Chart includes_ (GOLD market update)
🟢What is The Next Opportunity on GOLD Market
🟢how to Enter to the Valid Entry With Assurance Profit
This CHART is For Trader's that Want to Improve Their Technical Analysis Skills and Their Trading By Understanding How To Analyze The Market Using Multiple Timeframes and Understanding The Bigger Picture on the Charts

Gold XAUUSD Weekly Analysis 28 Sept to 2 Oct 2025Gold is currently trading at a decisive level where the weekly structure is hinting at a potential shift. After a strong bullish run, price tested the 3785–3800 zone but failed to sustain, forming a double top/M pattern and rejecting strongly from this supply area. The rejection has now pushed gold back into the crucial support zone of 3725–3733, which is a make-or-break level for the next swing move. If this support holds firm and we get a strong H4 close above it, buyers could regain momentum, opening the door for a bullish continuation towards 3780–3800, where the previous rejection zone lies. This would keep the broader bullish structure intact. On the flip side, if the market fails to hold this level and breaks below 3725 decisively, we can expect further downside towards the next demand zone at 3650–3660, which served as an earlier accumulation area. Overall, swing traders should treat 3725/33 as the key inflection point: above it, gold looks poised to retest the highs, while a breakdown could trigger a deeper correction into lower support levels.

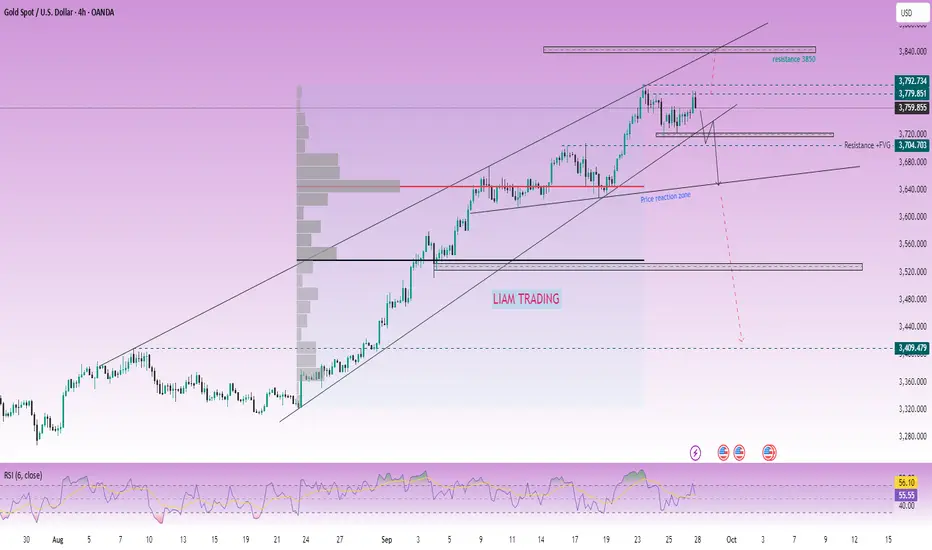
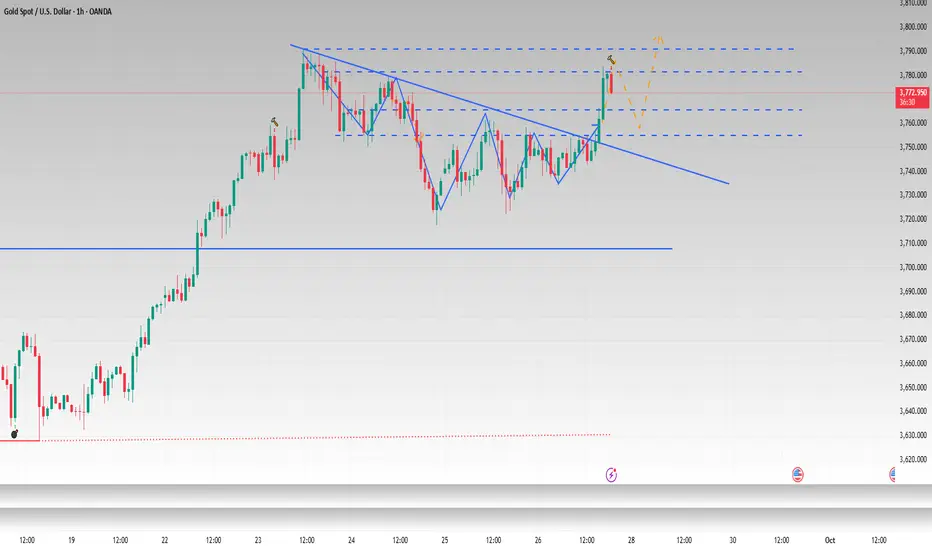
LiamTrading – Mid-term Gold Outlook H4Let's prepare the scenario for the new week, everyone!
In my opinion, gold next week might start to show a mid-term correction phase. However, it is important to note that nothing is absolutely certain on a larger time frame. If you're trading short-term within the day, closely follow price action to ensure higher accuracy.
Gold closed the weekly candle at 3759.85 – a price point clearly reflecting hesitation. The end-of-week session showed resistance to price increases, mainly due to profit-taking pressure, so it's too early to confirm that a downtrend will begin.
The upward price channel is strong, so it's still necessary to think in line with the market's upward trend to ensure the mindset of holding profits remains firm.
The upward structure is still stable, but the RSI has indicated a weakening in buying sentiment. To confirm a mid-term correction, gold needs to break 3720. At that point, a reasonable strategy would be to wait to sell around 3737–3740 (retracing to the trendline), with the target being the support area coinciding with the highest volume profile cluster at 3645.
Conversely, the buying scenario will occur when:
- Price touches the 3735 boundary and shows a candle rejection reaction.
- Or gold breaks above the minor resistance at 3780, then you can buy immediately, with the expectation of heading towards the 3850 area.
Next week, be patient and wait for market confirmation to increase the probability of winning. I will continue to share detailed scenarios in each trading session for everyone to stay updated.
Gold Trade Setup - 27/Sep/2025Hi Traders,
I am biased for further upside in Gold.
The first trade that I will be looking for is from the highlighted zone and the price is already testing it.
If price corrects here , then I will expect it to drop further to the next marked POI.
Please follow me and like if you agree or this idea helps you out in your trading plan.
Disclaimer : This is just an idea. Please do your own analysis before opening a position. Always use SL & proper risk management.
Market can evolve anytime, hence, always do your analysis and learn trade management before following any idea.

Back to 4H Frame – Fed & Inflation Shape Gold PathGold on the 4H timeframe is consolidating near premium supply after multiple liquidity sweeps. Recent U.S. inflation data kept the dollar resilient, while traders anticipate upcoming Fed commentary for clearer policy direction. Price rejected from the 3,795 supply pocket and is now retracing toward discount demand zones. Market structure suggests engineered sweeps below support before bullish continuation into Q4.
________________________________________
📌 Key Structure & Liquidity Zones (4H):
• 🔼 Buy Zone 3,692 – 3,694 (SL 3,685): Discount demand aligned with liquidity grab, ideal for continuation longs.
• 🔽 Sell Zone 3,795 – 3,797 (SL 3,804): Premium supply pocket where liquidity sweeps may trigger short-term rejections.
________________________________________
📊 Trading Ideas (Scenario-Based):
🔺 Buy Setup – Discount Demand Reaction
• Entry: 3,692 – 3,694
• Stop Loss: 3,685
• Take Profits:
TP1: 3,715
TP2: 3,740
TP3: 3,760+
👉 Smart money may engineer a sweep below 3,694 before reversing higher. Watch for bullish rejection patterns at demand.
🔻 Sell Setup – Premium Supply Reaction
• Entry: 3,795 – 3,797
• Stop Loss: 3,804
• Take Profits:
TP1: 3,780
TP2: 3,765
TP3: 3,750
👉 Short-term liquidity scalp opportunity against trend. Valid if price fails to break above breakout point.
________________________________________
🔑 Strategy Note
Bias remains bullish medium-term, but intraday sweeps into demand zones are expected as Fed officials continue to push cautious monetary guidance. Liquidity hunts around 3,795 supply and 3,694 demand will likely define the week’s volatility before a decisive breakout.

XAUUSD 1 HR
- *Entry*: $3,750
- *Target*: Potential target at TP1 ($3,780.59) as per chart markings.
- *Considerations*:
- Recent upward movement.
- *Note*: Trading involves risk. Always consider market conditions and use proper risk management.

Gold 3780 can open short positionsThe gold price has now reached a key suppression point. The importance of this position has been mentioned in the previous trading opinion. A breakthrough will lead to further increases.
Despite this, I think today is not the best time for a breakthrough. There is a high probability that it will encounter resistance at this position and consolidate downwards, which will continue to wash out traders with weak wills. The upward breakthrough node can be paid attention to next week. Therefore, I plan to initiate a short position near 3775-3780.
Trading strategy: sell at 3775-3780.
If you don't have a good trading plan yet, please follow my strategy sharing. I will update my gold trading plan daily for your reference, free of charge, to help you avoid detours and turn losses into profits!
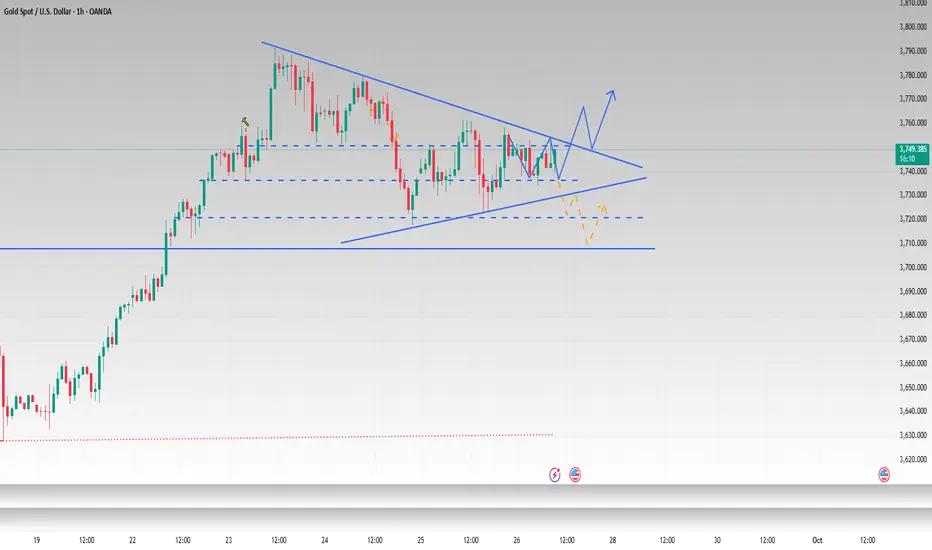
Holding on to 3755, there will be new highsAfter gold broke through the triangle boundary, it meant that the short-term downward adjustment was over. After falling back to 3755, it rebounded again. Everything was in line with our expectations. The morning trend chart also confirmed our advanced trading vision.
In the short term, gold will rise rapidly. Don't chase the rise easily at high levels. It is possible that the main funds want to push up the price to sell. On the upside, pay attention to the suppression brought by the previous highs of 3780-3790. As gold prices rise, short-term resistance also turns into support. Judging from the hourly and 4H charts, the middle track support has also come to around 3755, and the MA5 moving average has also moved up to around 3755. Under multiple conditions, 3755 has become a solid short-term support level. If the support of 3765-3755 can be held, gold may hit a new high and reach 3800-3810. Therefore, if gold rises and reaches 3780-3790 in the evening, I may consider shorting gold with a light position. If gold retreats directly to the 3765-3755 range, we can consider going long on gold to target new highs.
Gold (XAU/USD at Critical Decision Zone - Breakout or Rejection?📊 XAU/USD (Gold) Analysis - Decision Point at 3750–3760
Quick Summary:
Hello, traders! I've been watching the FX:XAUUSD chart for a while now, it clearly observed that TVC:GOLD has been climbing in a well-defined bullish channel, with every dip quickly absorbed by buyers. That larger structure is still intact, reinforced by a sequence of consolidations and breakouts, each pushing price higher and respecting the channel structure.
Right now, however, price action is stalling inside a short-term descending flag pattern just below the 3750–3760 resistance zone which is a textbook bullish continuation pattern.
This level is a true pivot. It has rejected price twice already and lines up with key Fib retracement levels. The market is hesitating here but also strongly rejecting lower prices, as seen in the multiple rejection around the 38.2% fib levels. I believe this is a clear tension building phase for the next major move.
There are two paths i see:
Path A: A confirmed breakout would fuel another impulsive wave higher✅.
Path B: A failure could drag price back toward Fibonacci supports❌.
My base case leans bullish: continuation toward 3790–3820 if resistance gives way. But if rejection holds, we could see a retracement back into 3728 or even 3709–3690 before buyers step back in.
1. Market Structure
Main Trend: Price is moving inside a well-defined ascending channel.
Pattern: Repeated cycle of descending consolidation → breakout → continuation.
Current price is again consolidating in a small descending channel within the bigger bullish structure.
2. Key Levels
Order Block: Around 3752–3760 zone (highlighted in red).
Fib Levels:
0.236 retrace → ~3752 (current resistance)
0.382 → ~3728
0.5 → ~3709
0.618 → ~3690 (stronger support)
Upside Targets: 3790 → 3820 🎯 aligns with Fib extension.
3. RSI & Momentum
RSI at 54.5 — mid-zone, neither overbought nor oversold.
RSI is forming a small wedge/triangle , suggesting potential breakout soon (momentum building).
4. Volume Context
Previous breakouts backed by strong volume surges.
Current consolidation is on reduced volume , which is typical before expansion.
5. Scenarios
🟢Bullish Case
If price clears 3752–3760 order block, breakout confirmation could push towards 3790–3820 (channel top + Fib extension).
🔴Bearish Case
If price rejects order block, we could see pullbacks to 3728 → 3709 → 3690 (layered Fib supports + mid-channel).
A deeper rejection could test the lower channel ~3660–3680.
Patience is the real edge here. Wait for confirmation-discipline and timing always outlast impulse.

Traders Watch Gold Surge Ahead of Fed’s Next MoveGold 1H – Consolidation Before Fed Clarity
Gold on the 1H timeframe is currently trading around 3,746, moving within a well-defined consolidation range. Price action highlights a premium supply zone at 3,775–3,773 and a discount demand zone at 3,723–3,725. The market structure shows earlier signs of BOS and ChoCH, with engineered liquidity sweeps becoming evident. A potential Mitigation → Expansion sequence is in play, where a liquidity grab near discount demand could fuel a bullish leg toward premium supply.
From a macro perspective, today’s headlines underscore the cautious stance across financial markets as investors await the Federal Reserve’s upcoming guidance. Lingering inflationary concerns, coupled with speculation around the timing of future rate cuts, have kept volatility elevated. Meanwhile, geopolitical risks continue to underpin safe-haven demand for gold, adding an extra layer of support at discount levels.
This combination of technical liquidity zones and macro uncertainty sets the stage for tactical plays: fading moves into the supply zone while remaining prepared for dip-buying opportunities at defined demand areas.
________________________________________
📌 Key Structure & Liquidity Zones (1H):
• 🔴 SELL GOLD 3,775–3,773 (SL 3,782): Supply zone coinciding with a buy-side liquidity pool above 3,780, offering downside targets at 3,760 → 3,745 → 3,730.
• 🟢 BUY GOLD 3,723–3,725 (SL 3,718): Discount demand aligned with liquidity grab potential, with upside targets at 3,745 → 3,760 → 3,775+.
________________________________________
📊 Trading Ideas (Scenario-Based):
🔻 Sell Setup – Supply Rejection (3,775–3,773)
• Entry: 3,775–3,773
• Stop Loss: 3,782
• Take Profits:
TP1: 3,760
TP2: 3,745
TP3: 3,730
🔺 Buy Setup – Demand Mitigation (3,723–3,725)
• Entry: 3,723–3,725
• Stop Loss: 3,718
• Take Profits:
TP1: 3,745
TP2: 3,760
TP3: 3,775+
________________________________________
🔑 Strategy Note
With the Fed’s next move looming, traders should anticipate engineered sweeps into both premium and discount liquidity pools before the market establishes clearer direction. The tactical edge comes from aligning intraday setups with liquidity hunts:
• Fade supply at 3,775–3,773 if rejection confirms.
• Buy dips into 3,723–3,725 if liquidity is swept cleanly.
The broader narrative of inflation concerns, dollar sensitivity, and safe-haven flows reinforces the case for two-sided opportunities. Expect gold to remain volatile within this consolidation range, with sharp moves likely as liquidity is targeted ahead of Fed clarity.

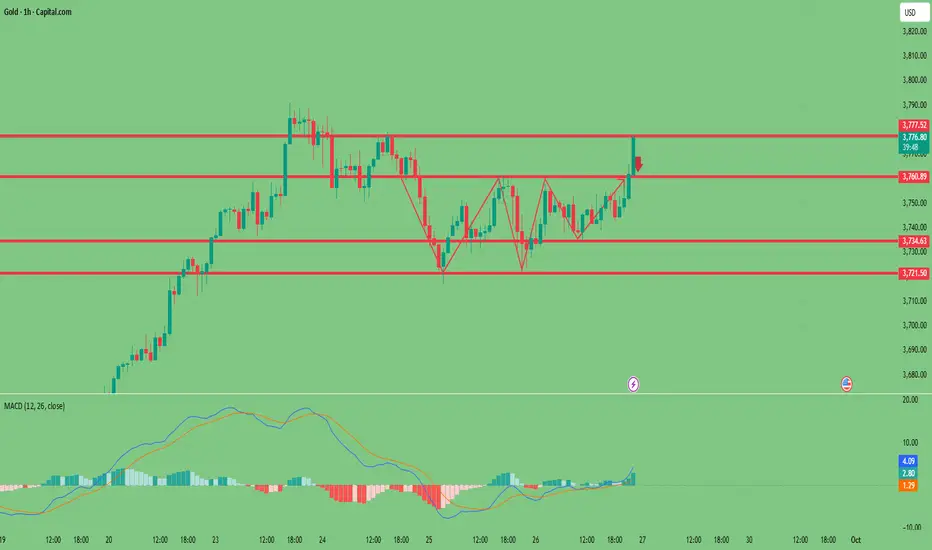
If it doesn't break 3755, we will continue to be bearishYesterday, gold tested the lowest level of 3720 and then began to rebound. In the evening, gold rebounded again to around 3758, but it did not effectively break through the trend suppression, so gold still fluctuated and fell.
Today, gold has traded in a narrow range during the Asian session, with no clear trading direction in the short term. The overall trend is currently consolidating within a triangular pattern. As time goes by, the short-term trend pressure has come to around 3750. The European session will focus on the pressure of 3750-3755. If it fails to break through effectively, gold will continue to fluctuate and consolidate in the short term, and you can consider shorting gold. On the contrary, once 3755 is effectively broken through, it means the end of the short-term downward adjustment. Key support levels are at 3730-3720. For intraday trading, adopt a "buy low, sell high" strategy within the 3750-3720 range, aiming for profit targets of $10-$30, until the triangular pattern is broken. At the same time, it should be noted that 3710-3700 below is still the key support.
1 hour TF Gold Level -DroidTradingWait for Strong Resistance Breakout 3765-70
Strong Buying 3710-15, if Tapped, Also Entry if Retest On Trendline.
Keep SL ,Book your Daily Target
Comment on our Analysis
