TraderTilki Gold Play: Double Sell, One TargetGood morning, Traders
Back again with my gold analysis.
Right now, gold has a clear target at 3700. It’ll either reach it straight from the 3736 level, or after a move up to 3768.
I’m opening a sell from here, aiming for 3700. If price pushes up to 3768, I’ll open another sell there—same target, 3700.
Gold will absolutely hit 3700.
Once it does, I’ll update you again.
My friends, every single like from you is my biggest motivation to keep sharing these analyses.
Huge thanks to all of you who support me with your likes.
Goldlong

ANFIBO | XAUUSD - A psychological zone $3800 ? [09.25.2025]Hi guys! Anfibo's here!
Overall Picture Today:
OANDA:XAUUSD is currently maintaining stability within the H4 bullish channel, reflecting the sustainability of the prevailing uptrend. Although no major breakout has occurred in recent sessions, the technical structure indicates that buyers still hold the advantage. However, the market is showing signs of stalling at a key resistance zone, so short-term trading plans should focus on resistance and support levels to optimize profits.
> SUPPORT KEY LEVELS: 3748 - 3733 - 3703
> RESISTANCE KEY LEVELS: 3768 - 3777- 3788 - 3799
Here's my Trading Plan today:
>>> SELL SCALP:
ENTRY: 3770 - 3765
SL: 3780
TP: 3720 - 3705
>>> BUY ZONE:
ENTRY: 3700 - 3705
SL: 3695
TP: 3760 - 3800
Always set stop-loss and good money management for success!
GOODLUCK GUYS!!!

4 Hour TF - Strong Buying Gold Level - Droid TradingGold Take Support Strongly near BOS , Where FVG or OB Present, Check Chart
Entry (3317-3325)
SL - 3307
Target (3365-3370)
BOOK Profit as your Understanding or Daily Target
Entry with Proper SL, as your Risk, Don't use Complete Fund.

GOLD TREND TODAY - Support and Resistance - Simple Analysis📈 Trend & Market Structure OANDA:XAUUSD
Gold is still in a clear uptrend, respecting higher highs and higher lows on H4.
Recent breakout structures (BOS) confirm bullish order flow, but price is approaching a liquidity zone near $3,800.
On the downside, unmitigated Fair Value Gaps (FVG) and Order Blocks (OB) remain potential buy zones if price retraces.
🔑 Key Levels
Resistance: 3800 – 3830
Support: 3765 – 3760 – 3755
Liquidity Buy Zone: 3715 – 3712
📌 Trade Ideas
🔴 SELL Setup (Countertrend / Scalping)
Entry: 3855 – 3858
Stop Loss: 3863
Take Profit:
TP1: 3850
TP2: 3840
TP3: 3820
TP4: 3800
Open TP: 3780
🟢 BUY Setup (Trend-following / SMC zones)
Entry: 3715 – 3712 (Liquidity + Strong OB)
Stop Loss: 3705
Take Profit:
TP1: 3725
TP2: 3735
TP3: 3755
TP4: 3775
Open TP: 3800
🎯 Strategy Note
Main bias: Look for buys on retracements in line with the uptrend.
Shorts at 3855 – 3858 are countertrend scalps only; use tight stops.
Apply scalping entries once price reacts at the defined S/R levels with confirmation (candlestick rejection, BOS, or volume shift).
Always use SL/TP for risk management.
⚡ Gold remains bullish overall; the plan favors buy opportunities from demand zones, while countertrend shorts should be quick and managed tightly.

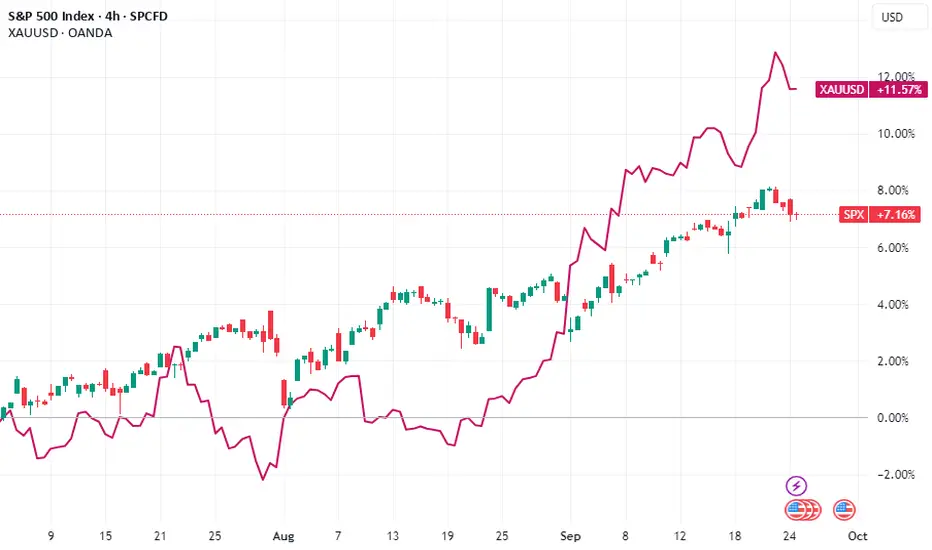
Gold’s Decade Shines Less Brightly for Stocks: The New Rational
Gold’s Decade Shines Less Brightly for Stocks: The New Rationale for the King Metal
For over a decade, the narrative surrounding gold was one of stark contrast to the equity markets. As stock indices, powered by tech innovation and ultra-low interest rates, embarked on a historic bull run, gold was often relegated to the sidelines—a relic for the fearful, an underperforming asset in a world chasing yield. The 2010s were, without question, the decade of the stock market. Gold’s shine, by comparison, seemed dull.
But a perceptible shift is underway. The latest rally in gold, which has seen it scale unprecedented nominal heights, is not the frantic, fear-driven surge of past crises. Instead, it appears to be driven by a more sober, strategic, and perhaps more durable force: the rational calculations of central banks and a fundamental rewiring of the global financial architecture. This new rationale suggests that gold’s resurgence may not spell immediate doom for stocks, as traditional wisdom would hold, but rather reflects a new, more complex macroeconomic reality where the two can coexist, albeit with gold casting a long, less brilliant shadow over the equity landscape.
The Ghost of Gold Rallies Past: A Tale of Fear and Froth
To understand the significance of the current rally, one must first revisit the drivers of previous gold booms. Historically, gold’s major upward moves were tightly correlated with periods of acute stress and negative real interest rates.
The post-2008 financial crisis surge, which took gold from around $800 an ounce in 2008 to over $1,900 in 2011, was a classic "fear trade." The world was confronting a systemic banking collapse, unprecedented monetary experimentation in the form of Quantitative Easing (QE), and rampant fears of runaway inflation and currency debasement. Gold was the safe haven, the hedge against a collapsing system. Similarly, the spike in mid-2020, at the onset of the COVID-19 pandemic, was a panic-driven flight to safety as global economies screeched to a halt.
These rallies shared common characteristics: they were often sharp, volatile, and ultimately prone to significant retracements. When the immediate crisis abated—when inflation failed to materialize post-2008, or when fiscal and monetary stimulus ignited a V-shaped stock market recovery in 2020—the rationale for holding a non-yielding asset weakened. Money flowed back into risk assets like stocks. Gold’s role was binary: it was the asset for when things were falling apart. In a functioning, risk-on market, it had little place.
This created the perception of an inverse relationship. A strong gold price was a signal of market distress, and thus, bad for stocks. But this decade is different.
The New Architects: Central Banks and Strategic Repatriation
The most profound change in the gold market has been the transformation of its largest and most influential buyers: central banks. For years, the narrative was that developed Western central banks, holders of the world’s primary reserve currencies, were gradually diversifying away from gold. The modern financial system, built on the U.S. dollar, Treasury bonds, and other interest-bearing instruments, was deemed superior.
That assumption has been decisively overturned. Since around 2010, but accelerating dramatically in recent years, central banks—particularly those in emerging economies—have become net purchasers of gold on a massive and sustained scale. The World Gold Council reports that central banks have been adding to their reserves for over a decade, with annual purchases hitting multi-decade records.
This buying is not driven by panic. It is a calculated, long-term strategic move rooted in three key rationales:
1. De-dollarization and Geopolitical Hedging: The weaponization of the U.S. dollar through sanctions, particularly against Russia following its invasion of Ukraine, served as a wake-up call for nations not squarely in the U.S. geopolitical orbit. Holding vast reserves in U.S. Treasury bonds suddenly carried a new risk: they could be frozen or seized. Gold, by contrast, is a sovereign asset. It can be held within a nation’s own vaults, is nobody’s liability, and is beyond the reach of any other country’s financial system. For China, Russia, India, Turkey, and many nations in the Global South, accumulating gold is a strategic imperative to reduce dependency on the dollar and insulate their economies from geopolitical friction.
2. Diversification Against Fiscal Profligacy: Even for allies of the U.S., the sheer scale of U.S. government debt is a growing concern. With debt-to-GDP ratios at record levels in many developed nations and little political will to address them, the long-term value of fiat currencies is being questioned. Central banks are increasingly viewing gold as a perennial hedge against the fiscal and monetary policies of their allies—a form of insurance against the potential devaluation of the very government bonds that form the backbone of their reserves.
3. A Return to a Multi-Polar Financial World: The post-Bretton Woods era has been dominated by the U.S. dollar. There are increasing signs that the world is shifting towards a multi-polar system, with the euro, Chinese yuan, and possibly other currencies playing larger roles. In such a transitional period, gold’s historical role as a neutral, trusted store of value becomes immensely attractive. It is the one asset that is not tied to the economic fortunes or policies of a single nation.
This central bank demand provides a powerful, structural floor under the gold price. It is consistent, price-insensitive buying (they are not chasing momentum but executing a strategy) that is largely divorced from the short-term sentiment swings of the stock market. This is the "more rational calculation" that makes the current rally fundamentally different and potentially longer-lasting.
The Interest Rate Conundrum: Gold’s Old Nemesis Loses Its Bite
For years, the primary argument against gold was simple: it offers no yield. In a world of rising interest rates, where investors can earn a attractive, risk-free return on cash or government bonds, the opportunity cost of holding gold becomes prohibitive. The theory held that the Federal Reserve’s aggressive hiking cycle from 2022 onward would crush the gold price.
It didn’t. Gold not only weathered the storm but continued its ascent. This paradox reveals another layer of the new rationale.
While nominal rates rose, real interest rates (nominal rates minus inflation) have been more ambiguous. Periods of high inflation meant that even with higher rates, the real return on cash and bonds was often negative or minimal. In such an environment, gold, as a traditional inflation hedge, retains its appeal.
More importantly, the market’s focus has shifted from the level of rates to their trajectory. There is a growing belief that the era of structurally higher interest rates is unsustainable, given the colossal levels of global debt. Servicing this debt becomes exponentially more difficult as rates rise. Therefore, many market participants are betting that the current rate cycle represents a peak, and that central banks will be forced to cut rates sooner rather than later, regardless of the inflation fight. Gold performs well in a environment of falling rates, and this anticipation is being priced in now.
Furthermore, high rates have begun to expose fragilities in the system, from regional banking crises in the U.S. to debt distress in emerging markets. In this sense, high rates haven't killed gold’s appeal; they have reinforced its role as a hedge against the consequences of high rates—namely, financial instability.
A Less Bright Shine for Stocks: Coexistence in a New Reality
So, what does this new, rationally-driven gold bull market mean for stocks? The relationship is no longer a simple inverse correlation. It is more nuanced, suggesting a future of coexistence rather than direct competition, but one where gold’s strength signals underlying headwinds that will dim the stellar returns equities enjoyed in the previous decade.
1. The End of the "Free Money" Era: The 2010s were built on a foundation of zero interest rates and quantitative easing. This environment was nirvana for growth stocks, particularly in the tech sector, as future earnings were discounted at very low rates, justifying sky-high valuations. The new macroeconomic order—one of higher structural inflation, larger government debt, and geopolitical fragmentation—is inherently less favorable to such valuation models. Gold’s strength is a symptom of this new order. It doesn’t mean stocks will collapse, but it does suggest that the era of effortless, broad-based double-digit annual returns is likely over. Returns will be harder won, more selective, and more volatile.
2. A Hedge Within a Portfolio, Not a Replacement: Investors are now likely to view gold not as a binary alternative to stocks, but as a critical component of a diversified portfolio. In a world of heightened geopolitical risk and uncertain monetary policy, holding a portion in gold provides stability. This means fund flows are not a simple zero-sum game between the SPDR Gold Trust (GLD) and the SPDR S&P 500 ETF (SPY). Institutions and individuals may increase allocations to both, using gold to mitigate the specific risks that now loom over the equity landscape.
3. Sectoral Winners and Losers: A strong gold price is a direct positive for gold mining stocks, a sector that has been largely neglected for years. This could lead to a resurgence in this niche part of the market. Conversely, the factors driving gold—higher inflation and rates—are headwinds for long-duration assets like high-flying tech stocks. The outperformance may shift towards value-oriented sectors, commodities, and industries with strong pricing power and tangible assets. The stock market’s shine may dim overall, but it will create bright spots in new areas.
4. The Signal of Sustained Uncertainty: Ultimately, a gold market driven by central bank de-dollarization and fiscal concerns is a barometer of persistent, low-grade global uncertainty. This is not the acute panic of 2008, but a chronic condition of fragmentation and distrust. Such an environment is not conducive to the explosive, confidence-driven growth that stock markets thrive on. It favors caution, resilience, and tangible value over speculative growth. Gold’s steady ascent is the clearest signal of this psychological shift.
Conclusion: A Duller but More Enduring Glow
The gold rally of the 2020s is not a siren call of an imminent market crash. It is the quiet, determined accumulation of a strategic asset by the world’s most powerful financial institutions. It is a vote of no confidence in the unfettered dominance of the current financial order and a bet on a more fragmented, uncertain future.
For stock market investors, this does not necessarily portend a bear market. Instead, it heralds a more challenging environment where the tailwinds of globalization and cheap money have reversed. The dazzling shine of the stock market’s previous decade is likely to be replaced by a duller, more realistic glow. Returns will be more modest, risks more pronounced, and the need for prudent diversification more critical than ever.
In this new era, gold and stocks will learn to coexist. The king of metals is no longer just a refuge for the fearful; it has become a strategic holding for the rational. Its decade may not shine with the same speculative brilliance as the stock market’s last bull run, but its light may well prove to be more enduring, illuminating a path through a landscape of greater complexity and risk. The lesson for investors is clear: the old rules are changing, and in this new game, gold holds a very strong hand.
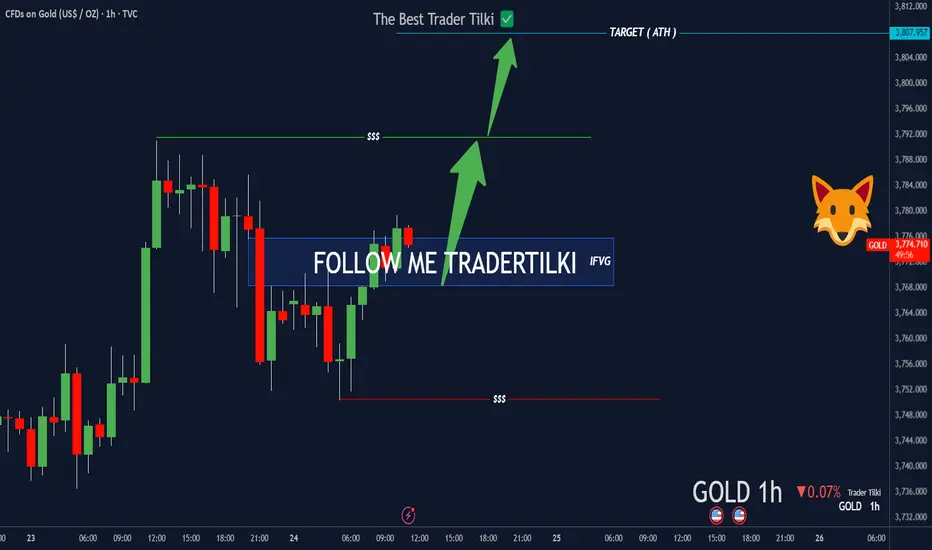
XAUUSD-Gold Game Just Changed: Post-FVG Violation SetupHey Traders,
Gold is currently sitting at 3774. From here, I’m aiming straight for 3807.
Why?
FVG got violated—we now have a clean IFVG.
That’s why my target is locked: 3807.
Set your stop-loss based on your own margin.
I believe we’ll hit that level sooner or later.
Every single like you drop keeps me motivated
to keep sharing these insights.
Big thanks to everyone supporting!

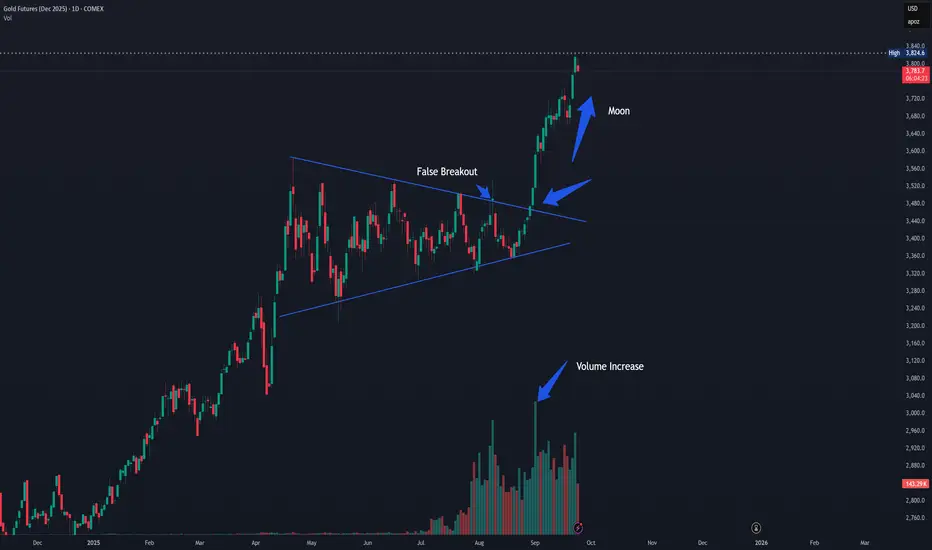
I Should Have Noticed This Pattern (Episode 1)
Just today I zoomed out on my GS chart and noticed for the first time this almost perfect triangle pattern. How did I completely miss this?
-There are many times in my short trading career that I have come across things I should have noticed. Whether it's chart patterns, correlation, volume spikes, or indicators indicating; I kick myself for my neglect!
-Now the least I can do is point out those mistakes and share them with you as I see them, in the hopes that more get noticed in the future.
-This is an example of a symmetrical triangle which is considered the most common type of triangle pattern. Despite the name, the triangle does not have to be symmetrical and like all patterns is evaluated in the approximate. Some imagination is required. Most triangles are a representation of consolidation before continuation, but can sometimes represent a top or bottom before reversal. When price does break out of a triangle, volume should spike and this example clearly shows that. This example also shows a false breakout which would have been discovered when closing for the day back "inside" the pattern. Also like all patterns, the larger the time interval, the more important the pattern. Daily and longer are preferred.
-Again this is what I see after the fact and far too late. I would not enter this trade now. Please let me know if I missed something or if you were able to trade this in real time and there was details that I left out. Also, did anyone make money on noticing this pattern? Am I mistaken in any way?
Gold 3755-3760 Buy TP: 3790The support for gold is 3750-3760. The main direction is still an upward trend. We can trade based on the support position today!
I share a lot of trading signals every day. If you want to follow my real-time signals, you can contact me.

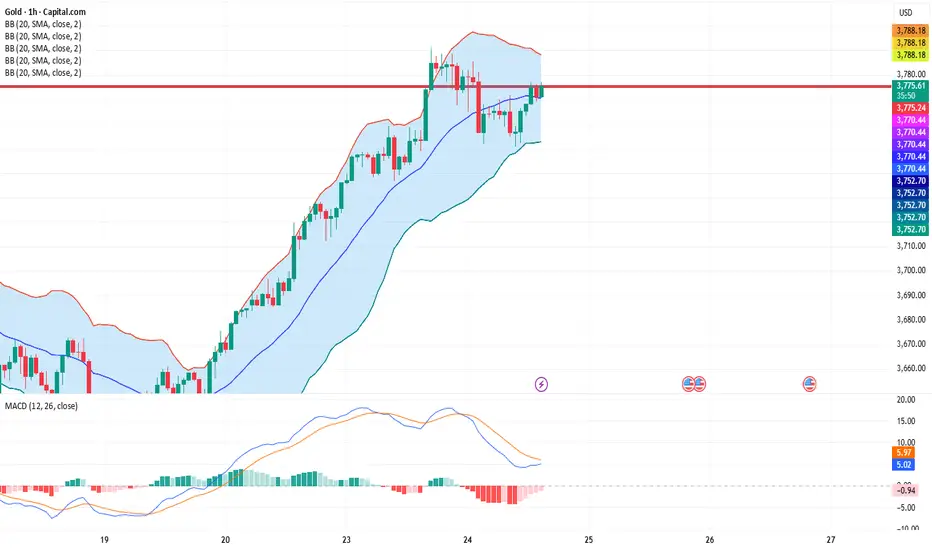
Gold 1H – Inflation Fears & Risk Flows Drive MomentumGold on the 1H timeframe is trading around 3,753 after repeated BOS confirmations, showing strong bullish structure but facing premium resistance. Liquidity remains stacked above 3,787–3,785, while discount demand zones sit lower at 3,725–3,723 and deeper at 3,688–3,686.
Today’s headlines on sticky U.S. inflation expectations and renewed geopolitical tensions in Eastern Europe are fueling safe-haven demand, but intraday structure suggests engineered sweeps into resistance before retracement into demand zones.
________________________________________
📌 Key Structure & Liquidity Zones (1H):
• 🔴 SELL SCALP 3,787–3,785 (SL 3,794): Premium resistance where liquidity sweeps may trigger short-term rejections targeting 3,780 → 3,775 → 3,770.
• 🟢 BUY ZONE 3,725–3,723 (SL 3,718): Pullback entry aligned with BOS structure, offering upside targeting 3,740 → 3,755 → 3,770+.
• 🟢 BUY ZONE 3,688–3,686 (SL 3,680): Deeper discount demand, attractive for dip buys targeting 3,700 → 3,715 → 3,730+.
________________________________________
📊 Trading Ideas (Scenario-Based):
🔺 Buy Setup – Pullback Entry (3,725–3,723)
• Entry: 3,725–3,723
• Stop Loss: 3,718
• Take Profits:
TP1: 3,740
TP2: 3,755
TP3: 3,770+
🔺 Buy Setup – Discount Demand (3,688–3,686)
• Entry: 3,688–3,686
• Stop Loss: 3,680
• Take Profits:
TP1: 3,700
TP2: 3,715
TP3: 3,730+
🔻 Sell Setup – Liquidity Run (3,787–3,785)
• Entry: 3,787–3,785
• Stop Loss: 3,794
• Take Profits:
TP1: 3,780
TP2: 3,775
TP3: 3,770
________________________________________
🔑 Strategy Note
With inflation concerns heating up and geopolitical risks sustaining safe-haven flows, the broader trend remains bullish. Smart money may engineer stop-runs into premium resistance before retracements into discount zones. Focus on buy-the-dip opportunities at well-defined supports, while fading liquidity sweeps cautiously near 3,787–3,785. Expect intraday volatility as markets react to U.S. inflation chatter and risk-off headlines.

If you don't know how to operate, please look here
Six hours ago, I suggested shorting around 3765 to 3770, waiting for support before going long. Based on market trends, this strategy is perfectly sound. The price has now risen to the resistance zone, which is exactly the take-profit point of my long position. I plan to close the long position first, and then go short again in the range of 3775 to 3785. Wait until the price falls back to the lower support level, and then look for opportunities to take back long orders. In today's market, both long and short positions can be profitable.
Those traders who are currently in a difficult situation and have no clear trading direction, please follow me and give me a like. You can leave your questions in the comment section. I will analyze your questions and reply to you. Watch how I help you get out of this predicament. Welcome to join my free base.
LETS GOO GOLD FLY 3830 SOON Gold Have A Super Sharp X Setup
Gold Buy Now Hold Till Physcology Level 3830
Support + RBS + Buy Trendline + Sell TL Breakout
Lets gooo
Good Luck Guys !

Gold holds above $3765, bullish momentum continues📌 Market Overview
Gold is consolidating around $3765–$3768 after reaching another all-time high. Market sentiment remains bullish as expectations of Fed rate cuts persist, the USD weakens, and Treasury yields edge lower.
📊 Technical Analysis
• Near resistance: $3775 – $3785
• Additional (strong) resistance: $3800 – $3815
• Near support: $3755 – $3740
• Additional (strong) support: $3725 – $3710
• EMA 50 (H1): price remains above EMA, supporting the bullish bias.
• Candlestick pattern: rejection candles near $3755 show active buying demand.
• Momentum (RSI H1): stays above 60, no extreme overbought signals yet.
📝 Outlook
The main trend is still bullish, but the $3775–$3785 zone could trigger short-term profit-taking. As long as price holds above $3755, gold is likely to aim for $3800–$3815.
🎯 Trading Strategy
🔺 BUY XAU/USD : $3748 – $3751
🎯 TP: 40 / 80 / 200 pips
🛑 SL: $3743
🔻 SELL XAU/USD : $3781 – $3784
🎯 TP: 40 / 80 / 200 pips
🛑 SL: $3788

Gold (XAU/USD) Cycle & Trend OutlookXAU/USD Update
On the low time frame, Gold is testing the 3,776 resistance zone after a strong rally.
Key levels:
3,776 → local resistance. A breakout and hold above this level would confirm continuation toward higher targets (3,800+).
3,762 – 3,657 → key support range. Holding this zone keeps the main uptrend intact.
Upside scenario: If price breaks and confirms above 3,776, bullish momentum continues, extending the rally.
Downside risk: Failure to hold 3,762 could trigger a pullback toward 3,657. A deeper breakdown below 3,657 would shift momentum bearish, targeting 3,314.
Cycle support: 3,314 is the major cycle trend level that Gold must protect to maintain its broader bullish structure.
📌 Summary
Above 3,776 → bullish continuation with potential new highs.
Hold above 3,762 – 3,657 → main uptrend remains safe.
Below 3,657 → correction risk toward 3,314 cycle level.

Buy gold near 3750, target 3768-3788Gold Market Analysis:
Yesterday's daily gold chart reached 3791. Our buy orders at 3643 and 3788 yielded huge profits. Gold's strength is so strong that it's making us question our own future. We currently don't see a peak. Yesterday's tail-end saw a pullback. The upper shadow on the daily chart is quite long, making it difficult to reach a new high today. The pullback in the Asian session also confirms that a correction will occur today. Yesterday's surge was excessive, requiring a technical correction. The indicators and chart patterns haven't kept pace, leading many investors to speculate on whether a peak has been reached. I believe it hasn't, and there's no definitive signal. A peak requires time and space to fully develop. Today's strategy is to buy and sell, as there's significant room for recovery. Consider buying low in the Asian session. Selling after the pullback is already underway is no longer feasible. We're unsure of the support level it will reach. Chart-wise, 3712 is the limit of this dive. If it unexpectedly breaks, we need to consider whether we've truly sold. Buy gold at 3750 in the Asian session. A break of this level would be unsatisfactory. It's a support level, a candlestick pattern, a point of yesterday's trading, or an indicator. Currently, it appears to be stabilizing. If it approaches the level again during the European and American sessions, buy more. The gold market will likely experience a period of volatility. Don't hold positions for too long. The likelihood of continued unilateral movement is low today. Resistance levels are 3781 and 3791, which are also selling areas.
Support levels are 3750, 3728, and 3712. Resistance levels are 3781 and 3791. The dividing line between strength and weakness is 3750.
Fundamental Analysis:
There are no major fundamentals or data this week, just standard data. Focus on the impact of the Fed's rate cut.
Trading Recommendations:
Buy gold near 3750, target 3768-3788

Gold prices surge! Analysis of intraday gold price trends!Market News:
Spot gold fluctuated at high levels in early Asian trading on Wednesday (September 24), currently trading at $3,762 per ounce, not far from the all-time high reached overnight. Yesterday, gold prices experienced extremely volatile fluctuations, soaring to a record high of $3,791. However, following a speech by Federal Reserve Chairman Powell, the London gold price retreated significantly from this high. However, gold's overall upward trend remained intact, and the price ultimately closed higher that day. Powell's remarks last night largely reiterated his remarks at the press conference following last week's rate cut. He emphasized the challenges facing the Fed in achieving its dual objectives. "Two-way risks mean there is no risk-free path," Powell said. He noted that cutting rates too much, too quickly, could lead to inflation running persistently close to 3%, rather than the Fed's 2% target; while maintaining a restrictive policy stance for too long could lead to unnecessary labor market slack, driving gold prices lower. Investors' focus now turns to Friday's release of the US core personal consumption expenditures (PCE) price index, the Fed's preferred inflation indicator. If data shows easing inflationary pressures, it will strengthen the case for an interest rate cut, positive for gold. Conversely, if inflation remains stubborn, it could shake market confidence in a rate cut, causing short-term volatility in international gold prices.
Technical Analysis:
After three consecutive daily gains, gold prices are trading in the overbought zone at 80, signaling a divergence. This is also why, after yesterday's record high of 3790.97, gold prices retreated sharply to support at 51, driven by both technical and fundamental factors. Currently, after three consecutive daily gains, prices are trading significantly below the 10-day moving average at 3693, with the 5-day and 7-day moving averages at 3722 and 3707, respectively. On the short-term four-hour chart, prices are converging around the 10-day moving average. The RSI indicator has turned downward after overbought levels, and the hourly moving averages are converging, pushing prices back below the middle Bollinger Band. Gold prices could see further correction after their sharp rise, with the 3740/80 range being the initial target for the day.
Trading strategy:
Short-term gold: Buy at 3750-3753, stop loss at 3742, target at 3780-3800;
Short-term gold: Sell at 3782-3785, stop loss at 3794, target at 3650-3630;
Key points:
First support level: 3750, second support level: 3735, third support level: 3712
First resistance level: 3778, second resistance level: 3791, third resistance level: 3808

XAU/USD(20250924) Today's AnalysisMarket Analysis:
Federal Reserve Chairman Powell stated that the policy rate remains somewhat restrictive, but allows the Fed to better respond to potential economic developments; tariffs are expected to have a one-time pass-through effect; and decisions will "never be based on political considerations." Fed spokespersons noted that Powell's comments indicate he believes interest rates remain tight, potentially opening the door for further rate cuts.
Technical Analysis:
Today's Buy/Sell Levels:
3763
Support and Resistance Levels:
3817
3797
3784
3743
3730
3709
Trading Strategy:
If the market breaks above 3763, consider entering a buy position, with the first target price being 3784.
If the market breaks below 3743, consider entering a sell position, with the first target price being 3730.

Gold All Time High Continue – Next Target?Gold is currently trading around $3688, just above the 3675–3680 breakout zone, which has now turned into a crucial support. Price is moving within an upward channel, but the recent breakout above equal highs and the labeling of a “weak high” suggest that buyers may still push towards the 3740–3750 resistance area before facing stronger rejection. A decisive break above the $3,700–3,750 zone would open the way to targets in the $3,800+ region and eventually toward $4,000 if the Fed proves dovish and ETF/central-bank demand remains strong.
However, failure to hold above 3680 would shift momentum back towards the lower channel, where immediate supports lie at 3565, 3530, and 3498. A deeper breakdown below these levels would open the door for further downside towards the 3440–3400 zone. Any surprise hawkish Fed commentary, a meaningful USD recovery, or a quick drop in inflation expectations could trigger sharper mean-reversion.
Buy Zone & Buy Trigger:
- Buy Zone: 3670 – 3680 area
- Buy Trigger: A clean breakout and 4H close above 3700 will be a buy trigger.
Note
Please risk management in trading is a Key so use your money accordingly. If you like the idea then please like and boost. Thank you and Good Luck!

Gold Analysis: Breakout Potential Toward $3,800Gold is trading around $3,715, showing strong bullish momentum after breaking out of the recent consolidation zone between $3,595 – $3,640. Price has respected the ascending channel and is now approaching the $3,725–$3,740 resistance zone, which is a key area to watch. A sustained break above this zone could open the way toward $3,760+ and possibly extend into the $3,800 region if bullish momentum continues.
Gold is consolidating after a strong rally. Holding above the trendline is key—breaking below may lead to a deeper pullback, while a breakout above resistance could push prices toward $3,800. Despite short-term swings, the longer-term outlook stays bullish.
On the downside, immediate support lies near $3,680–$3,660, followed by the support levels at $3,638 and $3,616. Holding above these levels will keep the bullish structure intact.
📌 Sell Zone & Sell Trigger:
- Buy Zone: $3,660 – $3,680 area
- Buy Trigger: A clean breakout above $3,725 – $3,740 resistance → Upside target $3,760 – $3,800.
Note
Please risk management in trading is a Key so use your money accordingly. If you like the idea then please like and boost. Thank you and Good Luck!

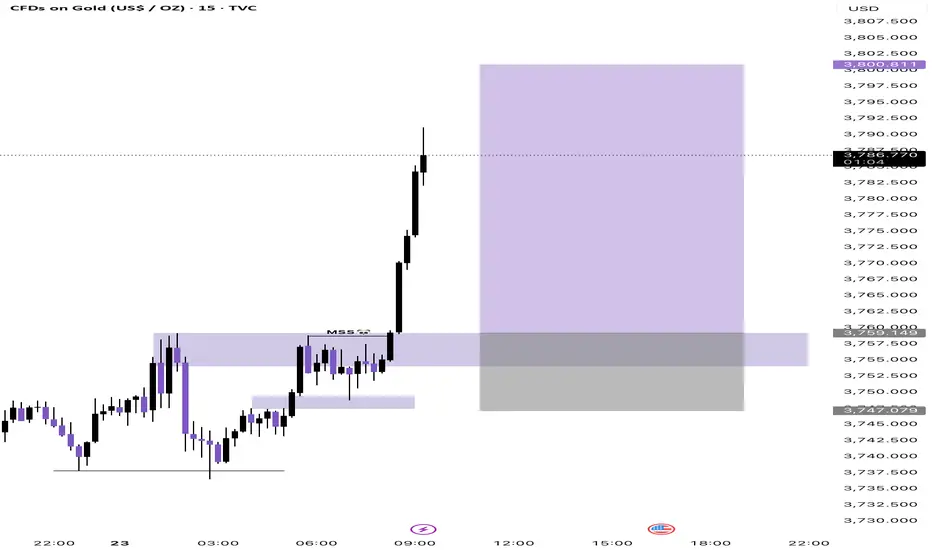
Gold XAUUSD Intraday Setup 23 Sept 2025Gold has shown strong bullish momentum, breaking above multiple resistance zones and forming a clean rally on the 15-minute chart. After this impulsive move, price is currently retracing, and a key support area lies around 3757–3759, which was previously resistance and may now act as support. A potential long setup forms if price taps into this level, offering a buying opportunity with a target at 3800, aligning with the next psychological resistance, while maintaining a protective stop loss around 3747. This setup reflects a classic resistance-turned-support trade with favorable risk-to-reward.

Market fluctuates repeatedly, focusing on Powell's speechLast night, gold still did not provide an opportunity to pull back and go long. Instead, it continued to rise near the end of the trading day. Gold rose again after opening this morning and once approached 3760 before falling back, maintaining a narrow range of high fluctuations during the day. The daily line closed with a positive sign, but the MA5 and MA10 moving averages did not move up accordingly, indicating that yesterday's rise in gold was purely caused by news. At this time, we should be more vigilant about gold rising and falling. Pay attention to the upper pressure of 3760-3770. If gold touches the upper side again in the short term and encounters resistance and pressure, aggressive investors may consider shorting with a light position and waiting for a pullback. The focus below is 3730, which was the trend suppression yesterday and also the dividing point between short-term gains and losses for bulls and bears. A more conservative approach is to wait for a pullback to 3740-3730 before buying gold.

Gold will reach gann number 3729 cant break that number for nowGold will reach Gann number 3729 cant break that number for now. so Sellers can enter around 3729. After fall from 3729 buy the dip and Target for buy will 3988.

Gold ATH , PULLBACK SHARP SETUP TO CREATE NEW ATH AGAIN Gold Buy Reasons
RBS / BRB / FVG / MSS
Gold Buy Zones
3760 , 3754
3750 , 3745
Got It Guys ? Use Proper MM
Good Luck With Your Trading 🤞