Gold spikes to 3760 then pulls back to 3745 📊 Market Overview:
Gold surged to a new ATH at 3760 USD/oz, then dropped quickly to 3735 USD/oz on profit-taking. Currently, it trades around 3745 USD/oz, showing a tug-of-war between buyers and sellers.
📈 Technical Analysis:
🔺 Resistance 1: 3755 – 3760
🔺 Resistance 2: 3775
🔻 Support 1: 3735
🔻 Support 2: 3720
• EMA 50 (H1) still pointing upward → bullish bias intact.
• Last H1 candle with long upper wick → short-term selling pressure.
📝 Outlook:
Trend remains bullish, but 3755–3760 is a key resistance zone. If it fails to break, price may retest 3735 or even 3720.
🎯 Trading Strategy:
🔺 BUY XAU/USD : 3735 – 3738
🎯 TP: 40/80/200 pips
🛑 SL: 3732
🔻 SELL XAU/USD : 3775 – 3780
🎯 TP: 40/80/200 pips
🛑 SL: 3785
Goldlong

ANFIBO | XAUUSD - next ATH ??? [09.23.2025]Sorry guys, I'm very busy today so I can't share my views in detail. I will share my trading plan first, then update the details later ;)
Here's my OANDA:XAUUSD plan today:
>>> BUY ZONES:
ENTRY: 3715 - 3720
SL: 3710
TP: 3740 - 3760 - 3770 - 3800
>>> SELL ZONES:
ENTRY: 3800 - 3795
SL: 3805
TP: 3760 - 3730
GOODLUCK GUYS!!!

Gold prices surge! Analysis of intraday gold price trends!Market News:
On Tuesday, as market expectations for further Federal Reserve rate cuts grew, spot gold prices surged dramatically, reaching a record high. The rise in London gold prices stemmed from a combination of policy, macroeconomic, and geopolitical risk factors, reflecting the market's conflicting mood between exuberance and panic. Amidst rising global risks and uncertainties, international gold is becoming a "must-have" investment for investors. Global central banks continue to increase their gold reserves, coupled with continued inflows into gold ETFs, demonstrating continued strengthening demand for gold as a strategic investment by institutional investors. This trend has been a key driver of international gold prices over the past few months. At the same time, the risk of a potential US government shutdown has risen again. These uncertainties have heightened gold's safe-haven appeal. The war between Russia and Ukraine appears far from over, further driving up gold prices. Several Federal Reserve officials will speak this week, with the market focused on Friday's release of the core PCE price index. A continued decline in inflation data would reinforce expectations of further rate cuts in October and December. A low interest rate environment helps reduce the cost of holding gold, significantly increasing its appeal.
Technical Analysis:
Gold prices maintain a strong bullish trend, with the daily chart maintaining a strong bullish trend and reaching a new all-time high. The continued weakness of the US dollar further boosted buying momentum for gold and silver. On the daily chart, gold broke through 3750, reaching a new all-time high. Yesterday, the price of gold rose by over $75 per ounce. The latest 10-day and 7-day moving averages continue to trend upward, and the price is trading within the upper Bollinger Band. The short-term four-hour moving averages are trending upward, as are the Bollinger Bands. At this rate of increase, gold prices could soon reach 3800. This simplified market trend suggests buying low on pullbacks, with selling at key resistance levels supporting historical highs. Trends are king, and yesterday's continued declines and repeated buying demonstrates our trend-following strategy. Today's target is 3733/26, watch for low-price buying opportunities!
Trading Strategy:
Short-term gold: Buy at 3730-3733, stop loss at 3722, target at 3760-3780;
Short-term gold: Sell at 3780-3783, stop loss at 3792, target at 3650-3630;
Key Points:
First Support Level: 3735, Second Support Level: 3720, Third Support Level: 3703
First Resistance Level: 3766, Second Resistance Level: 3780, Third Resistance Level: 3800

XAU/USD(20250923) Today's AnalysisMarket News:
Federal Reserve Chairman Bostic: There is currently little reason to cut interest rates further, and only one rate cut is expected this year. Musallem: There is limited room for further rate cuts. If inflation risks increase, further rate cuts will not be supported. Hammak: We should be very cautious when lifting policy restrictions. My estimate of the neutral interest rate is on the higher side. Milan: I believe the appropriate interest rate is in the mid-2% range. I do not support adjusting the 2% inflation target at this time.
Technical Analysis:
Today's Buy/Sell Levels:
3726
Support and Resistance Levels:
3790
3766
3751
3701
3685
3661
Trading Strategy:
If the price breaks above 3751, consider buying, with the first target at 3766.
If the price breaks below 3726, consider selling, with the first target at 3701.

Weekly Candle High | Buy on Pullbacks to Support🟡 XAU/USD – 09/22 | Captain Vincent ⚓
🔎 Captain’s Log – Quick Overview
Last week, gold closed around 3,685, paving the way for further advances and the creation of a new ATH.
After the FED cut 25bps, Powell's 'brake' comments tempered the rise, but the overall trend remains bullish.
This morning, prices surged to 3,697.xx, currently adjusting slightly around 3,692 – 3,690 → a sensible strategy: wait for a pullback to continue Buying.
⏩ Captain’s Summary: The gold voyage still heads North, Buying remains the main choice, but wait for a pullback to board.
📈 Captain’s Chart – Technical Analysis
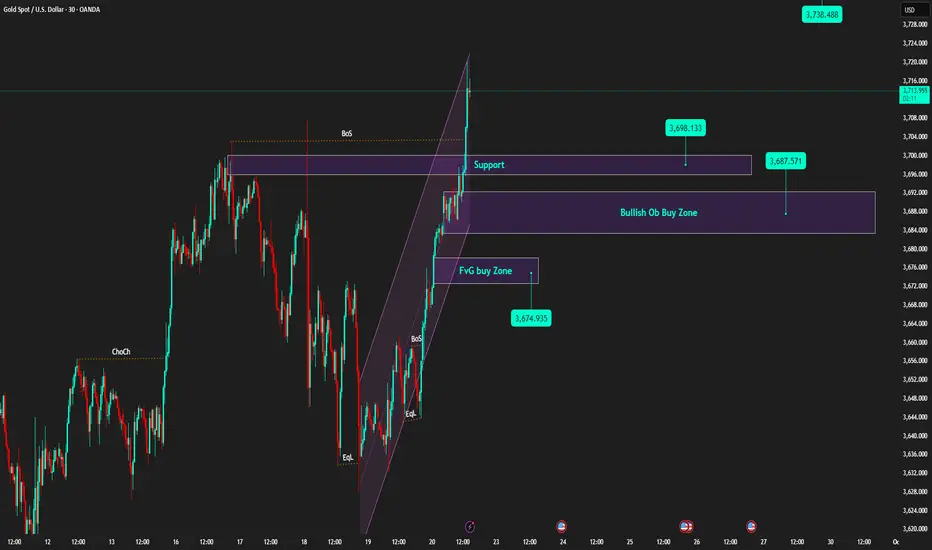
Golden Harbor (Support / Buy Zone):
Thin support: ~3,698 (recently broken old range peak).
OB Dock: 3,687 – 3,690.
FVG Dock: 3,672 – 3,676 (liquidity check on deep adjustments).
Storm Breaker (Resistance / Sell Zone):
3,714 – 3,720 (supply cluster / old ATH – likely to react).
Price Structure:
Continuous BoS series, price breaks out of short-term rising channel and creates higher highs → bullish remains the main trend.
🎯 Captain’s Map – Trading Plan (before US session)
✅ Buy (trend priority)
Buy Zone 1
Entry: 3,698 – 3,701
SL: 3,688
TP: 3,706 – 3,714 – 3,720+
Buy Zone 2 (OB)
Entry: 3,687 – 3,690
SL: 3,680
TP: 3,698 – 3,706 – 3,714 – 3,72x
Buy Zone 3 (FVG)
Entry: 3,672 – 3,676
SL: 3,664
TP: 3,687 – 3,706 – 3,714
⚡ Sell (only scalp when overbought)
Sell Zone (ATH test)
Entry: 3,740 – 3,738
SL: 3,750
TP: 3,730 – 3,720 – 3,695
Captain’s Note ⚓
“The new week opens with a high-closing candle, the gold ship continues its bullish course. Golden Harbor 🏝️ (3,690 – 3,672) is a safe anchorage for the crew to watch for Buys. Storm Breaker 🌊 (3,714 – 3,720) is a wave peak prone to gusts, suitable for Quick Boarding 🚤 short-term scalps. Before the US session, the sea might be choppy – hold the wheel tight and manage volume wisely.”
XAUUSD – Wolfe Waves Forming on H4 ChartHello Trader,
On the H4 chart, gold is forming a fairly classic Wolfe Waves pattern. The fifth wave has completed, and the price is entering the critical resistance zone of 3760 – 3770, which is also a potential Sell Zone. With the current structure, the preferred scenario is a short-term downward correction before the main trend resumes.
Technical Analysis
The price has touched the 2.618 Fibonacci Extension and reacted downward, indicating profit-taking pressure.
The MACD still shows strong previous buying momentum, but the histogram is starting to weaken, aligning with the potential for a corrective wave.
Area 3760 – 3770: a critical resistance zone, coinciding with the fifth wave of the Wolfe Waves.
Trading Scenario
Sell Order According to Wolfe Waves
Entry: 3760 – 3770
SL: 3782 (above resistance zone)
TP: 3710 -3660 -3610 – 3620 (key level Wolfe target)
Sell when price confirms below the trendline
Entry 3727-3730
sl 3735
tp 3715-3700-3686-3665
Short-term Buy Scalping
Entry: 3705 – 3708
SL: 3700
TP: 3720-3730 – 3745- 3766
Note: This is just a short-term retracement strategy, counter to the correction, so risk management is crucial.
Conclusion
Short-term: Prioritize observing reversal signals at 3760 – 3770 for a Sell.
Medium-term: Wait for Buy opportunities around 3564 – 3574 to align with the main trend.
The market is entering a distribution and correction phase, so patiently waiting for candle confirmations at key areas will be key to optimizing entry.
This is the Wolfe Waves scenario I propose for gold during this period. Feel free to refer and adjust according to your own strategy.
Follow me for the fastest updates when the price structure changes.

How Bitcoin Profits Are Fueling Gold's Record Surge
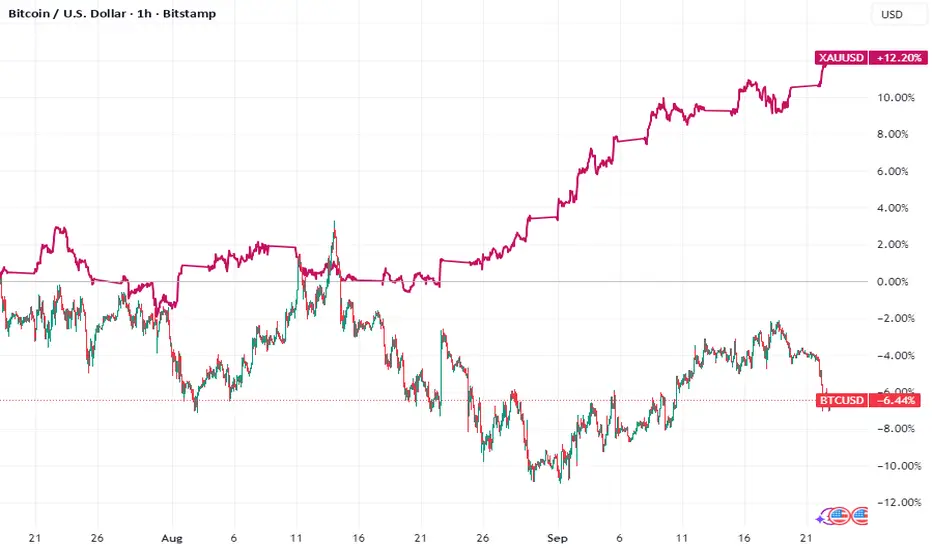
In the intricate dance of global markets, a subtle yet significant choreography unfolded, revealing a profound shift in investor sentiment. As Bitcoin, the volatile flag-bearer of the digital asset revolution, stumbled, a powerful wave of capital appeared to flow into a more ancient store of value. Roughly an hour after Bitcoin’s pronounced drop, gold, the timeless emblem of wealth and stability, surged to notch yet another record high. This sequence of events was more than a random fluctuation; it was a clear signal of a sophisticated market maneuver: a profit rotation from the speculative froth of cryptocurrency into the hard certainty of precious metals.
The divergence highlights a critical test of the "digital gold" narrative that has propelled Bitcoin for years. While safe-haven flows have traditionally sought refuge in bullion during times of uncertainty, the recent price action suggests a more complex, multi-layered dynamic is at play. Investors, having reaped substantial gains from the crypto market, appear to be de-risking and preserving those profits in an asset benefiting from its own powerful macroeconomic tailwinds. This "digital-to-physical shuffle" offers a compelling glimpse into the evolving relationship between these two assets and the strategic thinking of modern investors navigating a landscape of persistent inflation, geopolitical tension, and shifting monetary policy.
Anatomy of the Divergence: Why Bitcoin Stumbled While Gold Rallied
The recent price action did not occur in a vacuum. Bitcoin’s slide was a culmination of factors signaling potential "cycle exhaustion." The drop triggered a brutal leverage washout, with a massive volume of bullish crypto wagers liquidated, hitting smaller tokens particularly hard. This cascade of liquidations suggests that the recent rally was fueled by speculative excess, making it vulnerable to a sharp correction. The narrative of Bitcoin as a stable safe haven has been challenged, as its behavior mirrored that of a high-beta risk asset, sensitive to shifts in market liquidity and sentiment.
Conversely, gold's ascent to a record high is built on a much firmer, multifaceted foundation. The rally is powerfully supported by several key drivers. A primary driver is the aggressive and sustained accumulation by the world’s central banks. For several years running, official sector buying has reached historic levels, with institutions in emerging markets leading the charge to diversify their reserves away from the U.S. dollar and hedge against geopolitical risk. This sustained, large-scale demand creates a strong underlying price support that is independent of speculative flows.
Furthermore, expectations of monetary easing have further fueled gold's appeal. Lower interest rates decrease the opportunity cost of holding non-yielding bullion, making it more attractive to investors. With markets anticipating a cycle of rate cuts, the macroeconomic environment appears highly conducive to further gold upside. Finally, ongoing geopolitical conflicts and stubborn inflation have amplified demand for gold as the ultimate monetary insurance policy. Faced with currency devaluation risks and systemic uncertainty, both institutional and retail investors have flocked to the yellow metal, which has a multi-millennia track record as a reliable store of value. This confluence of factors has propelled gold's rally, leading many market observers to revise their forecasts upward.
The Rotation Thesis: Locking in Digital Profits in Physical Metal
The most compelling aspect of the market action was the timing. The roughly one-hour lag between Bitcoin’s significant drop and gold’s subsequent rally is a tell-tale sign of a deliberate capital rotation. This is not the instantaneous reaction of an algorithmic panic, but the considered move of traders and fund managers observing a trend, assessing the risk-off sentiment, and redeploying capital.
This is not the first time this pattern has emerged. In previous market cycles, steep liquidations in cryptocurrency futures have often been followed by noticeable inflows into gold-backed investment vehicles. The current scenario appears to be a larger, more pronounced version of this dynamic. Traders who have enjoyed Bitcoin's run-up are choosing to lock in those volatile, digital gains by moving them into a more stable asset that is itself in a powerful bull market.
This rotation challenges the simplistic notion that Bitcoin is a direct substitute for gold. While both are seen as hedges against fiat currency debasement, their behavior reveals different risk profiles. Bitcoin's recent performance confirms its status as a high-risk, high-reward asset, often correlated with speculative liquidity and risk appetite. Gold, meanwhile, is reasserting its traditional role as a core wealth preservation tool and a hedge against systemic risk, supported by the immense and steady buying pressure from the world's central banks. The market seems to be making a clear distinction: Bitcoin is for speculation; gold is for preservation.
Broader Implications: A New Dance for Modern Investors
The divergence between gold and Bitcoin carries significant implications for investors and asset allocators. It serves as a powerful reminder that despite the maturation of the crypto market, gold’s role in a diversified portfolio remains unique and irreplaceable. The "digital-to-physical shuffle" is a new market dynamic that investors must understand and navigate.
For institutional players, this rotation represents a sophisticated strategy to manage portfolio risk. After a period of high returns in a speculative asset, rebalancing into a stable asset with strong fundamentals is a prudent move. The rise of regulated investment vehicles for both gold and Bitcoin has made executing such cross-asset strategies more seamless than ever, suggesting this dynamic will become a more common feature of market corrections.
Looking ahead, the outlook for both assets remains complex. Some analysts believe Bitcoin's correction is a healthy cleansing of speculative excess before it continues its upward trajectory. Others argue that Bitcoin's volatility and regulatory hurdles continue to limit its appeal as a true safe haven compared to gold.
What is undeniable, however, is the structural bull case for gold. The powerful trend of de-dollarization and reserve diversification by central banks is not a cyclical fad but a long-term strategic shift. As nations continue to seek a neutral reserve asset to insulate themselves from geopolitical pressures and the weaponization of finance, gold is re-emerging as a tangible monetary anchor.
In conclusion, the recent market events were a masterclass in modern market dynamics. Bitcoin's stumble, met with gold's powerful rally, was not a sign of the crypto market's demise, but rather its integration into a more sophisticated global financial ecosystem. It revealed a class of investors capable of harvesting profits from high-risk digital ventures and strategically redeploying them into the time-tested security of precious metals. While Bitcoin continues its volatile journey toward maturity, the episode was a resounding affirmation of gold's enduring power. In a world of increasing uncertainty, the ancient allure of physical gold is not just holding its own—it is shining brighter than ever.
D
Gold 1H – Fed Signals & Geopolitics Keep Bulls ActiveGold on the 1H timeframe is trading near 3,705–3,710 after a strong BOS, holding inside a rising channel. Liquidity is stacked above at the premium resistance zone around 3,716–3,718, while demand sits lower at 3,687–3,689 and deeper at the FVG zone 3,654–3,656. Recent Fed dovish signals following last week’s rate cut, along with escalating geopolitical tensions, continue to support safe-haven demand. However, upcoming U.S. inflation data and Fed speakers could spark engineered sweeps into premium supply before retracements into discount demand zones.
________________________________________
📌 Key Structure & Liquidity Zones (1H):
• 🔴 SELL ZONE 3,718–3,716 (SL 3,725): Premium resistance where liquidity sweeps may trigger short-term rejections targeting 3,710 → 3,700 → 3,690 .
• 🟢 BUY ZONE 3,687–3,689 (SL 3,680): Near-term demand zone aligned with channel structure, offering a pullback entry targeting 3,695 → 3,700 → 3,715+.
• 🟢 FVG BUY ZONE 3,654–3,656 (SL 3,647): Deeper discount support, attractive for longer setups targeting 3,670 → 3,685 → 3,700+.
________________________________________
📊 Trading Ideas (Scenario-Based):
🔺 Buy Setup – Pullback to Demand (3,687–3,689)
• Entry: 3,687–3,689
• Stop Loss: 3,680
• Take Profits:
TP1: 3,695
TP2: 3,700
TP3: 3,715+.
🔺 Buy Setup – FVG Sweep (3,654–3,656)
• Entry: 3,654–3,656
• Stop Loss: 3,647
• Take Profits:
TP1: 3,670
TP2: 3,685
TP3: 3,700+
🔻 Sell Setup – Premium Liquidity Run (3,716–3,718)
• Entry: 3,718–3,716
• Stop Loss: 3,725
• Take Profits:
TP1: 3,710
TP2: 3,700
TP3: 3,690.
________________________________________
🔑 Strategy Note
The Fed’s dovish tilt and safe-haven flows from geopolitical risks are sustaining bullish momentum, but intraday structure suggests smart money may first engineer stop-runs into premium resistance before retracing toward demand. Maintain buy-the-dip bias at defined support zones, while fading liquidity sweeps near 3,716–3,718 with caution. Volatility could increase as markets await fresh U.S. inflation data and Fed policy remarks.

EURUSD – H1 Trading Scenario
EURUSD is currently testing the rising trendline resistance, which also coincides with a prior liquidity accumulation zone during the previous bearish leg. A reaction from this area is highly likely.
That said, the corrective phase is not yet over, and several Fibonacci retracement levels remain untested. This leaves room to continue expecting further upside momentum.
The plan is to look for buy opportunities at zones where liquidity gaps (FVG) appear, with stops placed at nearby support levels. On the other hand, sell setups will be considered at Fibonacci retracement levels, prioritising short-term profit taking through scalping.
Trading Scenarios
Buy Setup
Entry: 1.1750 – 1.1760
Stop Loss: 1.1720
Take Profit: 1.1785 – 1.1810 – 1.1855
Sell Setup
Entry: 1.1820 – 1.1830
Stop Loss: 1.1860
Take Prfit: 1.1790 – 1.1765 – 1.1730 – 1.1710
You can use this scenario as a reference to shape your own trading plan. Stay tuned for my next updates to catch new setups in real time.

The bullish trend remains strong; look for opportunities to buy Gold fluctuated upward today, reaching a new high driven by multiple factors. It was originally expected that gold would retreat to near the inflection point and then rise, but unfortunately the market did not give it an opportunity and the bears had no choice but to stop their losses. From a technical perspective, the gold price stabilized above the MA5 moving average, the hourly moving average spread out upward in a bullish arrangement, and the Bollinger Bands opened upward, indicating that the market bulls have completely dominated. Gold is currently retreating. The top and bottom conversion position below 3710-3700 is being watched in the NY market. If the support level is not broken after a pullback, we can consider going long on gold, with the target at 3730-3750.

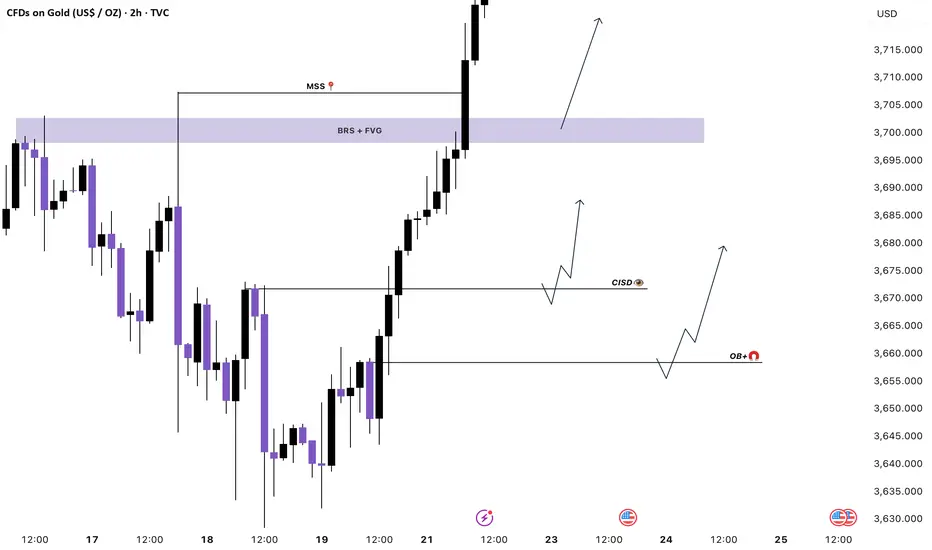
GOLD RETEST OR CONTINUE FLYING ? Gold Basic Buy Zones We Have
BREAKER BLOCK 3702 / 3698
FAIR VALUE GAP ZONE 3712 / 3700
CISD BUY 3671 / 3668
ORDER BLOCK ZONE 3658 / 3648
Follow The Trade , These Are Basic Zones Where Market Go Pullback Buy
Good Luck With Your Trading 🤞
Gold holds firm at $3680 – testing pressure toward $3725 resista📌 Market Overview
Spot gold is trading around $3691/oz, recovering from Asian session lows. Strong USD and high yields keep pressure on, but safe-haven flows are limiting the downside.
📊 Technical Analysis
• Near resistance: $3697 – $3707 (short-term ATH).
• Major resistance: $3725 – $3732.
• Near support: $3680 – $3670.
• Major support: $3658 – $3650.
• EMA50 (H1): price holding above EMA, keeping bullish bias intact.
• Candles: lower wicks near $3680 suggest strong dip-buying interest.
🧐 Outlook
Gold remains in a mildly bullish structure, but $3707 is key resistance. A rejection could push price back, while a breakout may target $3725.
🎯 Trading Strategy
🔺 BUY XAU/USD : $3682 – $3685
🎯 TP: 40 / 80 / 200 pips
🛑 SL: $3675
🔻 SELL XAU/USD : $3725 – $3730
🎯 TP: 40 / 80 / 200 pips
🛑 SL: $3735

ANFIBO | XAUUSD hits new ATH today [09.22.2025]Hi guys! It's me, Anfibo. My latest plan brought good profit with 100 pips Sell entry 3690 - 3700 and 100 pips sell entry 3720. Today is the beginning of the week, and I will think Gold will move in a parallel sideways range as on the chart I drew.
XAUUSD Analysis – Start of the Week
The new week kicks off with gold OANDA:XAUUSD moving sideways after last week’s strong volatility. The market has yet to make a clear breakout, with most major players still observing and waiting for decisive signals from key U.S. economic data due this week. Therefore, the narrow trading range and sideways structure are currently the “playground” best suited for short-term scalp trades.
🔎 Technical Outlook:
> Key Resistance Levels: 3720, 3725, 3745, 3775
> Key Support Levels: 3670, 3660, 3650.
Here's my OANDA:XAUUSD trading plan today:
>>> SELL SCALP:
ENTRY: 3723 - 3728
SL: 3731
TP: 3700 - 3670
>>> BUY SCALP:
ENTRY: around 3670
SL: 3665
TP: 3720 - 3730 - 3745
The current gold market is better suited for scalping strategies – quick in, quick out around well-defined support and resistance zones.
3720 – 3730 remains a “golden zone” for short-term selling opportunities, while 3660 – 3650 serves as the key support block to keep an eye on.
Only if gold clearly breaks above 3775 or drops below 3650 should we consider shifting to a medium-term trend-following strategy.
Well, HAVE A BEAUTIFUL DAY! :)

Gold’s Bullish Run: Ascending Channel Targets $3715Hi guys!
Gold has been showing incredible strength lately. Earlier, it formed a Head and Shoulders pattern, broke out, and hit its target perfectly.
Now
Things are getting even more exciting. We’ve just seen a widening pattern develop , and price has already broken out of it to the upside. That’s another strong signal that bulls are firmly in control.
At the same time, gold is respecting a clear ascending channel, and with momentum pushing higher, the next key target sits around $3715, near the upper boundary of the channel.
As long as price holds above the broken pattern zone, the outlook stays strongly bullish, and dips are likely to be bought up quickly.
Trend: Bullish
Target: $3715
Disclaimer: As part of ThinkMarkets’ Influencer Program, I am sponsored to share and publish their charts in my analysis.

BUYER FOMO BREAK ALL THE RULES📌 GOLD – Trading Plan OANDA:XAUUSD
Follow Signals On weekend Linda published you got SELL PLAN 3720 +120PIPS
Absolutely that up first down after:
1. Market Context (H1)
Main trend: Bullish (following several upward BOS).
The price has just broken the peak and created new liquidity above the 3715 – 3720 zone.
Below, there are CP Orders + FVG at 3693 / 3669 / 3650 → the price may retrace to test demand before continuing to rise.
Above: the 3749 – 3750 zone is a strong resistance, likely to see liquidity sweeps.
2. Main Scenario – BUY with the trend
Entry 1: CP ORDER + Trend Timing
Zone: 3693 – 3695.
Stoploss: 3685.
TP1: 3715.
TP2: 3730+.
R:R ratio: ~1:3.
Entry 2: Deeper CP ORDER
Zone: 3669 – 3670.
Stoploss: 3660.
TP1: 3710.
TP2: 3730+.
R:R: ~1:4.
Entry 3: Final FVG
Zone: 3650 – 3655.
Stoploss: 3640.
TP: 3710 – 3720.
This is the final entry; if it breaks, consider the trend reversed.
3. Alternative Scenario – SELL counter-trend (scalp)
Entry Sell
Zone: 3749 – 3750 (resistance + liquidity).
Stoploss: 3757.
TP1: 3730 – 3735.
TP2: 3695 – 3670 (if selling pressure is strong).
Confirmation required on M5/M15:
MSS down.
Bearish engulfing.
Long wick rejection.
4. Capital Management
Total risk for the day: max 3 – 4% of the account.
Each trade risk 1 – 1.5%.
Prioritize Buy, Sell is just a small scalp.
If the price hits TP1 → move SL to entry, let the rest run.
5. Notes
Main trend: Bullish, don't attempt too many counter-sells.
Only sell when clear signals appear at 3749 – 3750.
The 3693/3669 mark is a key zone → if it breaks strongly, wait for trend confirmation.

Gold XAUUSD Intraday Setup 22.09.2025Gold has recently broken its all-time high and is currently trading at 3711, signaling continued bullish momentum in the market. However, after such a strong breakout, a short-term retracement is likely as price action tends to revisit previous consolidation zones to gather liquidity. I'm now watching the 3693–3696 area closely—a key level where gold previously consolidated before the breakout. This zone is expected to act as a liquidity pocket, where the market may dip briefly to shake out early long positions and trap impatient sellers before resuming its upward trajectory. This kind of move is typical in strong trending markets, where price pulls back to retest former resistance turned support and collect orders before the next leg higher. My plan is to go long in the 3693–96 range, with a tight stop-loss placed at 3685, just below the liquidity sweep zone, minimizing downside risk. The target for this trade is 3725, anticipating that momentum will carry gold to fresh highs once the pullback completes and institutional buying steps back in.

What is the current global gold demand?Despite the record high price, the proportion of gold in total global financial assets is only about 2%. According to the World Gold Council, the amount of gold held by ETFs is still much lower than the peak in 2020.
This shows that there is still a lot of room for growth. The attraction of gold comes from its role as a "safe haven" in the context of rising inflation due to increasingly heavy government debt. The US alone has recorded an additional deficit of 2,000 billion USD this year, bringing the total public debt to over 37,000 billion USD.
Not only with USD, gold has also continuously reached peaks when calculated in Canadian dollars, British pounds, euros, Japanese yen and Australian dollars. Gold is currently trading above 5,000 USD/ounce compared to CAD.
The reason lies not only in global public debt, but also because many investors are beginning to worry that the US Federal Reserve (Fed) is losing its independence in monetary policy. Some experts believe that if the Fed cuts interest rates more aggressively in the coming years, especially when President Trump appoints more members to the council, gold will be strongly supported.

XAUUSD – Daily Trading Outlook
Good day Traders,
Gold opened the Asian session by holding its structure firmly. The 3708 level will act as the pivotal price marker for today:
A sustained break above this resistance would open the way towards 3750, with potential extension to 3780.
Conversely, failure to overcome 3708 and a rejection at this level could trigger a retracement, with 3650 – or even the 355x region – serving as key buying areas.
Fundamental Context
Last week’s corrective move was largely driven by comments from the Federal Reserve Chair regarding interest rate policy. The Fed is reluctant to implement multiple rate cuts, and this week’s PCE data will be critical in shaping expectations.
Trading Scenarios for Today
Buy Setup
Entry: 3650 – 3653
Stop-loss: 3645
Targets: 3662 – 3675 – 3690 – 3706 – 3725
Sell Setup 1
Entry: 3700 – 3703
Stop-loss: 3708
Targets: 3690 – 3675 – 3662 – 3650 – 3633
Sell Setup 2
Entry: 3738 – 3740
Stop-loss: 3746
Targets: 3725 – 3710 – 3700 – 3675 – 3650
Conclusion
For today, the preferred bias remains to buy on dips in line with the broader uptrend, while carefully monitoring reactions at the outlined key levels.
Follow me to receive timely updates as soon as price structure changes.

Analysis of gold price intraday trend!Market News:
In early Asian trading on Monday (September 22nd), spot gold prices saw slight fluctuations and are currently trading at $3,690 per ounce. Last week, after the Federal Reserve unanimously announced its first interest rate cut of the year on Wednesday as expected, the London gold price quickly broke through a record high of $3,700. The ongoing Middle East crisis and the Russo-Ukrainian conflict, now entering its third year, are also supporting gold's upward trend. This rally, which has lasted five consecutive weeks, is primarily driven by three factors: first, the market firmly expects the Federal Reserve to continue cutting interest rates in the second half of this year and even into 2026; second, the ongoing instability in the Middle East and the ongoing Russo-Ukrainian conflict; and third, the continued weakening of the US dollar. Although it rebounded slightly after the Fed's decision, it remains generally weak. The "sell on good news" principle seems to be reassuring. Looking ahead to this week, the market will be expecting a series of key data releases, including the September PMIs for the US, Japan, and Europe on Tuesday, the final US second-quarter GDP and durable goods orders on Thursday, the US PCE inflation report on Friday, and speeches by several Fed officials, particularly the views of new Fed member Milan. These data will directly impact the probability of a Fed rate cut in October, currently priced at 91.9%.
Technical Analysis:
Gold's daily chart showed a correction with consecutive declines. The New York closing price fell below the 10/7-day moving averages, with gold and the US dollar moving in lockstep. Friday's sharp rise saw a strong close in late trading, with the daily chart closing strongly positive. The New York closing price once again crossed above the 103660 MA, and the 7/5-day moving averages remained upward. Technically, the four-hour and hourly charts show gold prices re-entering the upper Bollinger Bands, with the moving averages forming a golden cross and opening upward, and the RSI indicator trading above its mid-axis. Early trading on weekly pullbacks is primarily for buying low, with selling high as a secondary consideration.
Trading strategy:
Short-term gold long at 3672-3675, stop loss at 3663, target at 3700-3720;
Short-term gold short at 3727-3730, stop loss at 3739, target at 3690-3670;
Key points:
First support level: 3675, second support level: 3662, third support level: 3646
First resistance level: 3703, second resistance level: 3716, third resistance level: 3728

XAU/USD(20250922) Today's AnalysisMarket News:
Federal Reserve Board Governor Milan: Expects continued rate cuts in the coming months and will work to convince other policymakers to cut more quickly; Minneapolis Fed President Neel Kashkari: Two more rate cuts this year would be appropriate.
Technical Analysis:
Today's Buy/Sell Levels:
3667
Support/Resistance Levels:
3719
3700
3687
3647
3634
3614
Trading Strategy:
If the price breaks above 3687, consider entering a buy/sell position, with the first target at 3700.
If the price breaks below 3667, consider entering a sell position, with the first target at 3647.

GOLD STILL BULLLISHI am having a two what out zone for continuation on the metal
All features of bullish are visible,,,,
I am bac to calling out set ups for you guys
#LOST BUT FOUND
#GOLD

XAUUSD – Strong Resistance at 3760–3770 Await ConfirmationHello trader,
Gold continues to oscillate within an accumulation zone following its recent recovery. While the overall trend leans towards an increase, a stronger breakout requires clear confirmation at key resistance-support levels.
Strong Resistance: 3760 – 3770, confluence with the Fibonacci extension zone. This is a pivotal level if the price aims to set a new ATH in the mid-term.
Key Level Sell: 3685 – 3695, currently a short-term resistance zone. If the price fails to break through, gold may face downward pressure.
Important Support:
3564 – 3574: mid-term support.
3534 – 3540: deep support zone, aligning with previous liquidity.
MACD H4: Histogram remains weak, momentum is unclear → the market needs further confirmation to clarify the trend direction.
Trading Scenarios
Bullish Scenario
Condition: Price breaks above 3695 and holds.
Entry: Retest 3665 – 3668.
Target: 3680-3698-3715-3730 – 3760 – 3770.
Extension: If successfully surpassing 3770 → expect a move towards 3800+.
Bearish Scenario
Condition: Price fails at 3695 and reverses.
Entry: Sell at 3685 – 3695 when a rejection signal appears.
Target: 3672-3655-3635 – 3600 – 3574.
Extension: If 3574 breaks, the decline may target 3540, or even lower.
Mid-term Scenario
Price may retest 3534 – 3550 to gather liquidity, then rebound according to the larger trend. This will be an attractive long-term Buy zone.
The gold market is at a crucial stage: buyers need to break 3695 to confirm an uptrend, while sellers still have opportunities at the short-term resistance zone. Deep support areas will continue to serve as the foundation for mid-term Buy strategies.
Keep a close eye on the 3695 and 3760 – 3770 zones to determine the next direction.
Stay tuned for the latest scenarios as the price structure evolves.

XAU/USD UpdateXAU/USD Update
We use advanced data that counts the start of the cycle and all important key levels.
On the low time frame, Gold is showing strength after reclaiming the 3,664 – 3,657 zone, turning it into a support.
Key levels:
3,664 – 3,657 → support zone. Holding above this confirms continuation of the uptrend.
3,684 → current resistance being tested. A breakout above this level would confirm bullish momentum and open the way for a move toward higher targets (3,720+).
As long as price stays above the support, Gold remains bullish in structure.
Risk scenario: If price falls back below 3,657, downside pressure may return, with 3,463 as the next major support.
Cycle support: 3,267 is a critical long-term level. Gold must hold this area to maintain the broader green cycle trend.
📌 Summary
Above 3,664 – 3,657 → bullish continuation confirmed.
Break above 3,684 → opens further upside targets.
Below 3,657 → downside risk increases, watch 3,463 as key support.
3,267 → major cycle support for long-term trend.
