Gold - Here we have the textbook breakout!📖Gold ( TVC:GOLD ) currently breaks out:
🔎Analysis summary:
After we saw Gold rejecting the previous all time high multiple times over the past couple of months, we are now witnessing a bullish breakout. If this breakout is confirmed in the near future, Gold will head for another parabolic rally higher, repeating the 2011 blow off top.
📝Levels to watch:
$3.500
SwingTraderPhil
SwingTrading.Simplified. | Investing.Simplified. | #LONGTERMVISION
Goldlong

Gold XAUUSD Intraday Setup 19 SeptGold on the 15M timeframe is showing a short-term bullish structure after forming a series of higher lows, with the price now retesting the ascending trendline support near 3647–3650. This area also aligns with a minor demand zone, suggesting buyers are stepping in to defend it. If the trendline holds, momentum could push the market back toward recent highs, with the first target at 3674 (TP1) and extended target at 3685–3690 (TP2). However, if price closes below 3638, it would signal a break of structure and potential continuation of the bearish leg, so a stop loss below this level is crucial. Overall, the market is offering a favorable risk-to-reward long setup as long as the trendline is respected and no strong bearish candle closes below support.

Can we short sell gold at the current price?Trading ideas review📈
The gold price trend has reversed from a decline to an upward trend, once again reaching around 3670 points, which perfectly aligns with the trading strategy I outlined in my previous article. When the price dipped to 3635 points, I repeatedly warned investors to buy long. When the price fluctuated around 3640 points, I again warned investors who hadn't yet established a position to buy long. The current market has perfectly validated my strategy, and yields are still soaring.
Gold Trend Analysis📈
Following the interest rate decision, gold prices have been trading in a wide range, with both long and short positions seeing profits this week. Gold has now risen to around 3670. Technically, multiple indicators remain bullish. However, due to the proximity of short-term resistance levels, gold's upward movement appears to be struggling, and the market is currently experiencing volatility. Whether gold will rise or fall, a breakout above 3670 is crucial in the short term. If it holds, the upward trend will continue; otherwise, the market will decline.
I took a long position on gold at 3635 and have already closed it at 3670 to take profits.
Today is the last trading day of the week. Due to the uncertainty surrounding the weekend market closure, I will not be conducting any transactions. Have a great weekend, and see you next week!
OANDA:XAUUSD TVC:GOLD

ANFIBO | XAUUSD - What's the next plan today? [09.19.2025]Hello guys! It's me, Anfibo.
My previous OANDA:XAUUSD plan with the Sell entry at 3,670 – 3,674 delivered more than 400 pips in profit, confirming that the market reacted exactly as anticipated.
At present, observing the price structure, gold has completed a 5-wave Elliott impulse and is now transitioning into an ABC corrective phase. This is a classic scenario following a strong impulsive leg, where the market needs to rebalance before determining the next trend.
At the same time, the current price zone is also showing signs of forming a Head and Shoulders pattern, adding another layer of reliable technical confluence. This suggests that downside pressure remains in play, at least until the pattern is fully developed.
Key short-term resistance levels to watch are around 3,690 – 3,700 (maybe we will get a sell signal here)
Meanwhile, immediate support levels can be found near 3,630 – 3,620 – 3,615, with a deeper support at 3,590, which will be decisive for the longer-term bullish structure.
The preferred strategy is to wait for price reactions at these resistance confluence zones to look for short-term Sell signals, in line with the ongoing ABC correction.
Here's My Trading Plan
>> SUPPORT ZONES: 3645 - 3630 - 3615 - 3590
>> RESISTANCE ZONES: 3670 - 3680 - 3690 - 3700
>>> BUY SCALP
Entry: 3620 – 3615
SL: 3610
TP: 3650 – 3670
>>> SELL Scalp
Entry: 3670 – 3675
SL: 3680
TP: 3620 – 3590
Always set your Stop-Loss on every trade! Wishing everyone successful trading. XOXO

Is there an opportunity before the interest rate decision?Gold has been soaring since the start of this week, reaching new highs, even testing above 3700 points during the session. However, due to the pressure from the round number barrier and the approaching interest rate decision, gold retreated after rising. This provided several opportunities for shorting. The first was to open a short position near 3697 until the take-profit target. The second was near 3695, today's high. With the interest rate decision imminent, all existing positions have been closed at the take-profit target. If it weren't for the interest rate decision, I would have preferred a downward trend in gold.
Since the interest rate decision has a significant impact on gold prices, it's safer to wait until the results are announced before considering any trades. Reducing risk is also the best way to preserve your principal. OANDA:XAUUSD FX:XAUUSD COINBASE:ETHUSD BINANCE:BTCUSDT

Gold Breaks Out of Range, Targeting Higher Resistance📊 Market Developments:
After consolidating in the 3643–3658 range, gold has broken out, moving up to 3665 in the US session. The rally is supported by safe-haven flows as expectations grow for further Fed easing, while the USD shows signs of stabilizing.
📉 Technical Analysis:
• Key Resistance: 3672–3675 (a breakout could extend toward 3685–3692).
• Nearest Support: 3658 (the breakout level) — if successfully retested, it may turn into new support.
• EMA 09: Price is now above EMA09 → confirming short-term bullish momentum.
• Candles / Volume / Momentum: A strong H1 breakout candle with higher volume confirms buyer dominance.
📌 Outlook:
• Gold has exited the sideways range and is trending higher in the short term.
• Holding above 3658 keeps the upside bias intact toward 3672–3685.
• Downside risk only emerges if price falls back below 3658.
💡 Suggested Trading Strategy:
• BUY XAU/USD at: 3658–3662 (on a retest after breakout)
🎯 TP: 40 / 80 / 200 pips
❌ SL: 3654
• SELL short-term only if a strong reversal signal appears around 3675–3685.

Gold struggles within 3630–3675 range, awaiting breakout📊 Market developments
• Yesterday, gold rebounded from 3633 to test the resistance zone at 3675 but failed, then dropped sharply to a low of 3627.
• This morning, gold recovered from that low and is now trading around 3658–3660, showing that short-term buying pressure has re-emerged.
• A stronger USD and slightly higher U.S. bond yields after the Fed meeting continue to weigh on gold, while expectations of further Fed rate cuts in the coming months prevent deeper declines.
🧭 Technical analysis
• Near resistance: 3670–3675 (key short-term barrier, repeatedly rejected).
• Major resistance: 3700 (psychological level; only a breakout would confirm a new bullish leg).
• Near support: 3630 (yesterday’s low).
• Major support: 3600–3610.
• RSI on H1/H4 has rebounded from oversold levels, signaling potential for further recovery, though momentum remains weak.
📌 Outlook
• In the short term, gold is expected to consolidate within the 3630–3675 range.
• A breakout above 3675 could open the way toward 3700.
• Failure to break 3675 would likely send prices back to retest 3630, or even lower toward 3600.
🎯 Trading strategy
• Short-term SELL: around 3670–3675, SL above 3678, TP at 3640–3630.
• Speculative BUY: around 3630–3635, SL below 3627, TP at 3665–3675.
XAU/USD(20250919) Today's AnalysisMarket News:
On Thursday, the U.S. reported its largest drop in initial jobless claims in nearly four years, reversing the previous week's sharp increase. (Note: Hours after the data was released, news broke that North Carolina's continuing claims data had been incorrectly and significantly understated by over 19,000. A Labor Department spokesperson stated that the matter is still under investigation.)
Technical Analysis:
Today's Buy/Sell Levels:
3648
Support and Resistance Levels:
3692
3676
3665
3631
3620
3603
Trading Strategy:
If the price breaks above 3648, consider entering a buy position, with the first target price being 3665.
If the price breaks below 3631, consider entering a sell position, with the first target price being 3620.

XAUUSDHello Traders! 👋
What are your thoughts on GOLD?
Gold pulled back after printing a fresh high and reacting to the latest FOMC meeting. It has since broken below key support and also violated its ascending trendline.
In the short term, price action is expected to remain range-bound to bearish, heading toward the next support zone.
As long as price remains below the broken trendline and resistance, the short-term bias stays bearish to sideways.
However, in the medium term, the overall outlook remains bullish, and a fresh upside wave may develop once the correction is completed.
Don’t forget to like and share your thoughts in the comments! ❤️

Gold Market Deep Dive – Fed Cut, Price Action & What’s Next📊 FX:XAUUSD Gold Market Deep Dive – ECONOMICS:USINTR Cut, Price Action & What’s Next
Close (Sep 17): Gold ended at $3,657 , after spiking to a fresh ATH at $3,707 on
👉 Classic “buy the rumor, sell the news” : price rallied from the $3,635 buy zone (Sep 15) , peaked on announcement day, then corrected lower.
🚨 Record High → Sharp Pullback
Rallied +$50 in two sessions, then sold off just as fast.
Price now retracing toward $3,635 support zone (prior demand).
JPMorgan’s Sell the News warning came true—profit-taking hit hard, as many ignored the caution signals.
🏦 Two Paths Ahead
Path A: Bounce from current level (aligned with 38.2% Fib retracement ) → recovery rally.
Path B (more likely): Support break → dip to $3,620–$3,610 before finding footing.
⚖️ Either way, the overall trend remains bullish . This was a healthy correction overdue after a parabolic climb.
🌍 The Bigger Story
YTD still up +40%, record highs intact.
Catalyst for selloff wasn’t bearish fundamentals—it was position unwinding .
Central bank demand, inflation hedging, and TVC:DXY weakness continue to underpin long-term upside.
Deutsche Bank’s 2026 gold forecast: $4,000/oz .
ETF demand rising.
📉 Technical Map – Bulls vs. Bears
⚡ Short-term weakness:
Intraday “strong sell” signals across MAs/oscillators.
RSI cooling, MACD momentum fading.
Current floor: $3,635 zone → key decision point.
⚡ Supports to Watch:
$3,635 (current)
$3,620 → $3,610 (deeper correction if broken)
⚡ Resistance:
$3,685 → $3,707 (ATH zone) – breakout reignites bullish trend
🔍 NFX Market Insight
Gold’s reaction isn’t trend-breaking—it’s profit-taking + healthy correction .
If $3,635 holds → recovery toward ATH.
If it fails → dip into $3,610s before resumption.
Bigger picture: Fed cut = bearish USD , so the bullish gold trend remains intact.
⚠️ This content is for informational/educational purposes only, not investment advice.

Do you have the courage to follow me and take a long position?Gold, as expected, reached our target trading range and then fell, hitting our desired profit-taking level, resulting in good profits for our short positions. Just now, gold briefly dipped to around 3627 before rebounding quickly. If the US session tonight sees gold test the support level of 3635-3625 without breaking below it, consider going long on gold; the short-term target could be 3655-3670.
Gold 1H – Retail Sales Impact Before FedGold on the 1H timeframe is trading near 3,682 after a strong BOS. Liquidity is now stacked above the premium resistance at 3,700 and below the fresh FVG demand at 3,669–3667. With U.S. Retail Sales scheduled today at 19:30 VN time, volatility may spike intraday, but broader positioning remains cautious ahead of the Fed’s rate decision this week. Expect engineered sweeps into premium before retracements back into demand.
________________________________________
📌 Key Structure & Liquidity Zones (1H):
• 🔴 SELL ZONE 3,700 – 3,698 (SL 3,707): Premium resistance for engineered sweep/rejection targeting 3,690 → 3,680 → 3,670.
• 🟢 FVG BUY ZONE 3,669 – 3,667 (SL 3,660): Fair Value Gap demand aligned with retracement into structure, targeting 3,680 → 3,690 → 3,700+.
• 🟢 BUY SUPPORT 3,641 – 3,639 (SL 3,632): Deep discount support zone targeting 3,655 → 3,670 → 3,685+.
________________________________________
📊 Trading Ideas (Scenario-Based):
🔺 Buy Setup – FVG Reclaim (3,669–3,667)
• Entry: 3,669 – 3,667
• Stop Loss: 3,660
• Take Profits:
TP1: 3,680
TP2: 3,690
TP3: 3,700+
👉 Look for a liquidity sweep into the FVG zone before New York open.
🔺 Buy Setup – Discount Sweep (3,641–3,639)
• Entry: 3,641 – 3,639
• Stop Loss: 3,632
• Take Profits:
TP1: 3,655
TP2: 3,670
TP3: 3,685+
👉 Strong R:R if price hunts stops below structure before Retail Sales data.
🔻 Sell Setup – Premium Liquidity Run (3,700–3,698)
• Entry: 3,700 – 3,698
• Stop Loss: 3,707
• Take Profits:
TP1: 3,690
TP2: 3,680
TP3: 3,670
👉 Expect engineered stop-runs into premium supply before fading lower.
________________________________________
🔑 Strategy Note
Retail Sales may provide short-term volatility, but Fed expectations will dominate the week. Smart money is likely to run both sides of liquidity: fading premium near 3,700–3,698 while protecting buys at 3,669–3,667 and 3,641–3,639. Trade with reduced size and confirm structure on H1 closes.

XAU/USD 1H – Bullish Continuation from Demand Zone .Key Observations:
Uptrend Structure:
Price has been consistently making Higher Highs (HH) and Higher Lows (HL), confirming an overall bullish market structure.
Break of Structure (BOS) levels confirm continuation of the trend.
Market Structure Shift (MSS):
Recently, price created a short-term shift downward (MSS) but retraced into a POI zone (demand area) near 3,646 – 3,659.
Current Setup:
The price bounced from the POI zone and is now recovering upward.
A long position was marked with entry near 3,659, Stop Loss at 3,646, and Target around 3,709.
Bias:
As long as price holds above 3,646 (POI zone), bullish continuation is favored.
If broken below 3,646, bearish correction could extend further.

Gold Analysis (XAU/USD)Two key buy levels are in play:
First level: 3613
Second level: 3591
If a valid signal forms at either level, I’ll be looking to go long ✅.
My plan remains the same:
If a level breaks, I’ll wait for a pullback and take the opposite side.
No frustration, no changing strategy.
Losses are part of the game—what matters is risk management and sticking to the plan 🎯.
📖 Remember: trading is about flowing with the market, not fighting it.

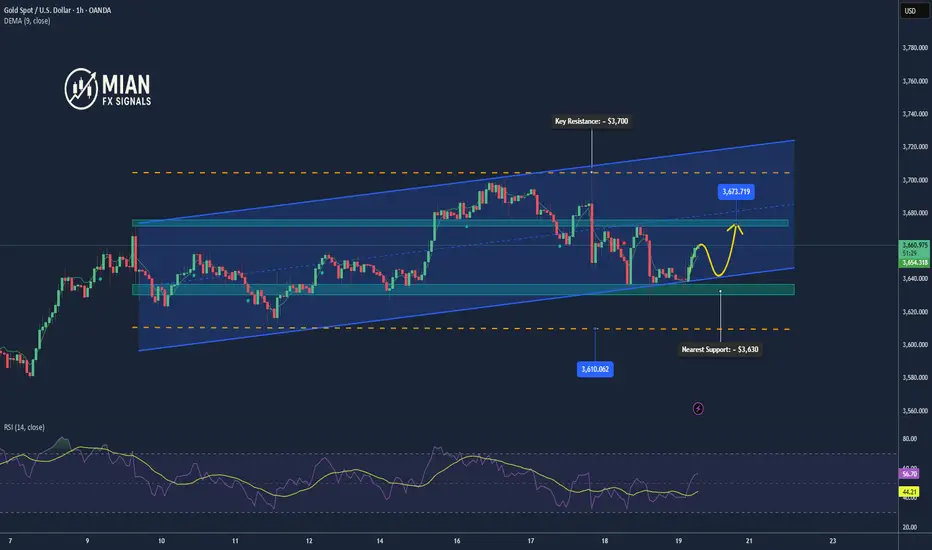
Gold Faces Resistance – Possible Short-Term Correction📊 Market Drivers:
• Expectations that the Fed will cut interest rates have supported gold by lowering the opportunity cost of holding the metal.
• The US dollar tends to weaken amid signs of slowing economic growth, which supports safe-haven demand for gold.
• Geopolitical uncertainties and continued central bank demand also add upward pressure on gold.
📉 Technical Analysis:
• Key Resistance: ~ $3,700 – $3,720 / ounce; a strong psychological round number level drawing market focus.
• Nearest Support: ~ $3,660 – $3,645 / ounce; if this breaks, gold could test deeper support near ~$3,580.
• EMA: Gold is trading above the EMA50 in many analyses → medium-term trend remains bullish.
• Candlestick / Volume / Momentum: Signs of stalling near resistance; momentum could weaken if the USD firms up or if the Fed signals caution. Overbought RSI and momentum indicators could trigger a short-term pullback.
📌 View:
Gold may see a short-term pullback if it fails to break above the ~$3,700–3,720 resistance zone. If bearish catalysts emerge – such as a stronger USD or a hawkish Fed stance – gold could retreat towards ~$3,645–3,660 support.
On the other hand, a clear breakout above ~$3,700 could open the way towards ~$3,720 and higher.
💡 Short-Term Trading Strategy (Scalping before news):
• SELL XAU/USD at: 3688 – 3692 (near short-term resistance)
🎯 TP: 40 / 80 / 200 pips
❌ SL: 3695
• BUY XAU/USD at: 3672 – 3668 (near intraday support)
🎯 TP: 40 / 80 / 200 pips
❌ SL: 3665

Gold 1H – Fed Decision Looms After $3,700 BreakGold on the 1H timeframe is consolidating around 3,675 after sweeping the historic $3,700 level. Price briefly tapped 3,702 before retreating into the 3,670s, showing engineered liquidity runs both sides. With the Fed policy decision due at 1 AM VN time, volatility is expected to spike. Market remains supported by easing USD, central bank flows, and geopolitical tension, but short-term positioning suggests possible liquidity grabs before a directional move.
________________________________________
📌 Key Structure & Liquidity Zones (1H):
• 🔴 SELL SCALP 3,696 – 3,694 (SL 3,703)
Premium supply pocket for engineered rejection targeting 3,690 → 3,685 → 3,680.
• 🟢 FVG BUY ZONE 3,674 – 3,665 (SL 3,660)
Fair Value Gap demand zone for retracement into structure, targeting 3,685 → 3,695 → 3,700+.
• 🟢 BUY SUPPORT 3,636 – 3,638 (SL 3,630)
Deep discount accumulation zone targeting 3,655 → 3,670 → 3,680+.
________________________________________
📊 Trading Ideas (Scenario-Based):
🔺 Buy Setup – FVG Reclaim (3,674–3,665)
• Entry: 3,674 – 3,665
• Stop Loss: 3,660
• Take Profits:
TP1: 3,685
TP2: 3,695
TP3: 3,700+
👉 Look for liquidity sweep into FVG before NY session/Fed.
🔺 Buy Setup – Deep Discount (3,636–3,638)
• Entry: 3,636 – 3,638
• Stop Loss: 3,630
• Take Profits:
TP1: 3,655
TP2: 3,670
TP3: 3,680+
👉 High R:R setup if stops hunted before Fed decision.
🔻 Sell Setup – Premium Trap (3,696–3,694)
• Entry: 3,696 – 3,694
• Stop Loss: 3,703
• Take Profits:
TP1: 3,690
TP2: 3,685
TP3: 3,680
👉 Expect engineered stop-runs into premium before fading lower.
________________________________________
🔑 Strategy Note
Gold’s break above $3,700 highlights strong bullish sentiment, but Fed decision risk means smart money may sweep liquidity both ways. Stay nimble: fade extremes at 3,696–3,694 for shorts, and defend demand at 3,674–3,665 and 3,636–3,638 for longs. Trade lighter size until post-Fed clarity.

World gold prices continuously reverseThe Federal Open Market Committee (FOMC) meeting, which began on Tuesday morning, will conclude on Wednesday afternoon (US time) with a statement and press conference by US Federal Reserve (FED) Chairman Jerome Powell. The FOMC is expected to cut the key interest rate by 0.25 percentage points - the first since November last year.
The new FED forecast may also show a slowdown in US economic growth and a rise in unemployment. At the press conference, Chairman Powell will have to answer many questions not only about the economic outlook and interest rates but also about the independence of the FED.
Global stock markets generally rose slightly overnight, while US index futures forecast a mixed opening. In other developments, the Cyberspace Administration of China is said to have asked companies like Alibaba and ByteDance to cancel orders for Nvidia's RTX Pro 6000D chips - a line of chips designed to avoid restrictions on exporting AI technology to China.
The move comes as the US and China have just announced progress in trade negotiations in Madrid (Spain).

Gold Buy NowYesterday, Target was 100% done
Gold buy zone activated now.
Zone - 3662-3656
SL- 3644
TP- 3700
Follow for more.

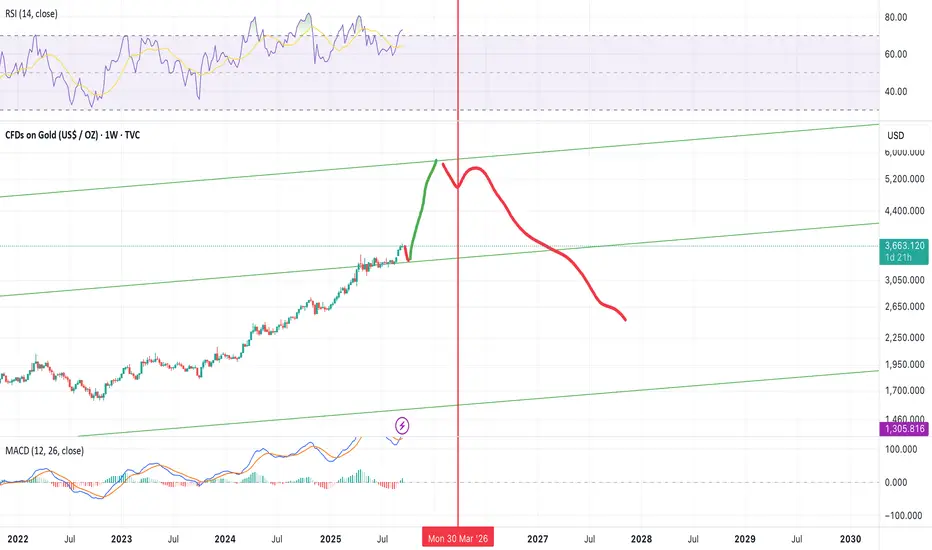
Gold to $5,700 by end of the year then %60 drop idk whats the reason the gold will shoot up to $5,700! I'm guessing war somewhere
A %10 drawdown first to $3,300 then a fast rally to $5,700.
not a financial advise
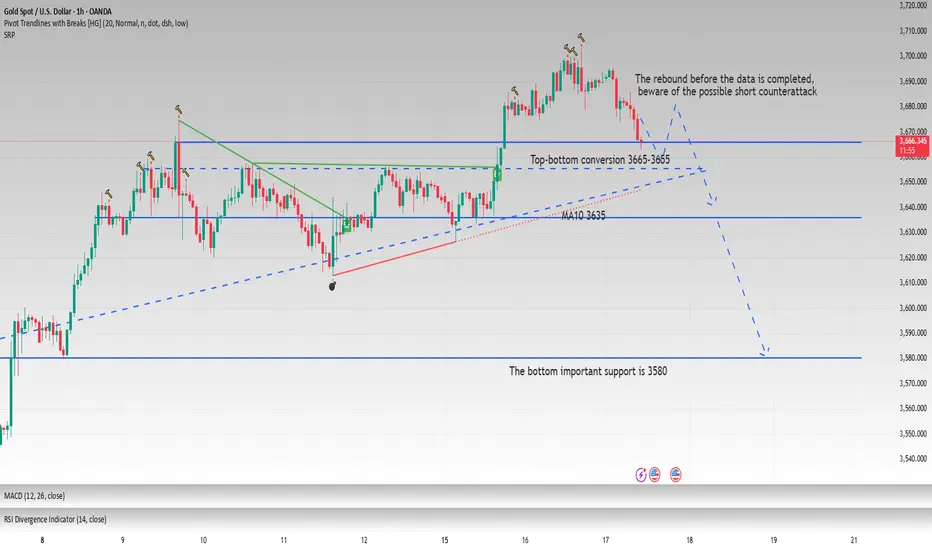
Go long before the data,be wary of a short-selling counterattackYesterday, gold retreated slightly in the Asian session, continuing the strong bull pattern. We originally expected to wait for gold to retreat to the support level of 3675-3665 to go long on gold, but the market always only gives us unattainable points. In the evening, gold rebounded directly to around 3703, which is in line with my previous judgment that gold will touch 3700 after stabilizing above 3665. As gold hit a new high and the Fed was about to cut interest rates, some buyers on the upper side chose to take profits, which gave us another opportunity to retreat to the ideal point. We also successfully seized the opportunity to go long on gold. This morning, gold rebounded again to around 3695, and the long positions we held also made a wave of profits.
Judging from the current market conditions, yesterday's daily line closed with a positive sign, and 3703 became the short-term high point. The lower moving averages MA5 and MA10 in the daily chart are around 3665 and 3635 respectively, which is exactly the middle track position of the Bollinger band. Only when it effectively falls below this point, will gold usher in a trend reversal in the short term. 3665 is the key position for the top and bottom conversion, and the market's enthusiasm for a 50 basis point interest rate cut remains unabated. If gold falls back to 3665-3655 again in the European session without breaking, then gold will rebound. Therefore, before the data is released, I choose to go long on gold again and expect a rebound, with the short-term target at 3685-3705. Bros can gradually reduce their positions during the rebound or take profits and exit at appropriate points according to their own account conditions.
Gold Trade Update📊 Gold ( FX:XAUUSD ) Market Update
The 200-Day SMA held strong as support against the heavy sell pressure triggered by the conflicting FOMC statement – a move largely driven by liquidated buyers.
⚡ With structure intact, I’m expecting a complete reversal and continuation of the bullish trend in the coming hours to days.
📉 Remember – the 25bps rate cut remains bearish for the TVC:DXY , which keeps gold positioned for strength.
Trade smart, stay patient. 💛

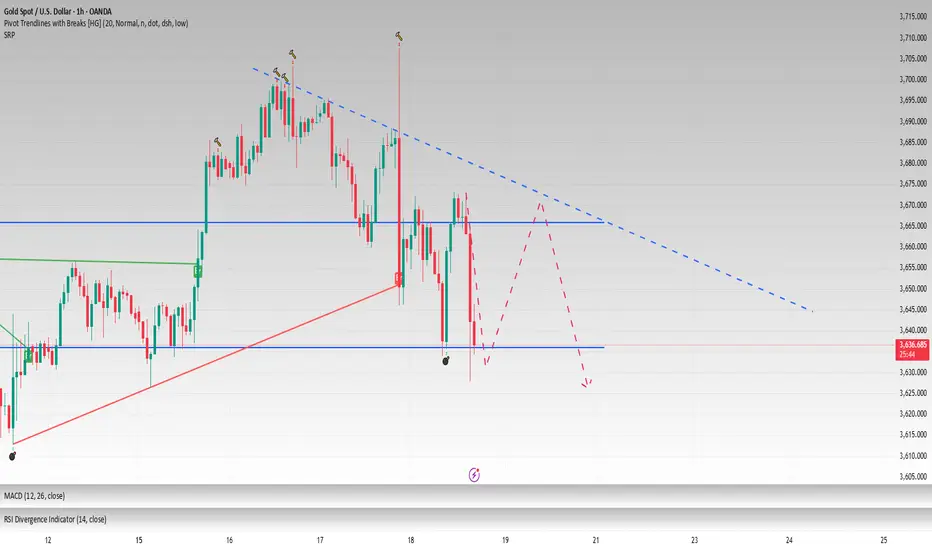
My short followers cheer for the victoryThis is the trading idea I provided in my previous article. Clearly, the gold price movement has been in line with my expectations and has started to decline, earning us a considerable amount of profit from this short-term trade. www.tradingview.com Seven hours ago, I once again suggested opening a short position at 3695. The market has now dropped to around 3680, and we have once again reaped a good amount of profit.
During this round of strong and rapid rise in gold prices, there are traders who have made considerable profits by following the trend, while there are also many who have held short positions against the trend. I believe the latter situation is quite common. Some have already given up halfway, while others are still struggling. So, no matter which situation you are in now, you can follow me and share your entry point in the comment section. I will analyze and reply to each one, helping you turn losses into profits. Welcome to join my free camp.
TVC:GOLD FX:XAUUSD OANDA:XAUUSD BITSTAMP:BTCUSD COINBASE:ETHUSD

ANFIBO | XAUUSD on 09.17.2025 and is this a major breakthrough?Here's Anfibo. With my yesterday's plan, our sell OANDA:XAUUSD order reached more than 200 pips, the buy order was 30 pips short of matching the entry and missed 150 pips short. But that's okay, I have a new plan today for everyone to follow:
💚 SUPPORT ZONES: 3676 - 3660
❤️ RESISTANCE ZONES: 3694 - 3700 - 3705 - 3719 - 3745
✅ BUY SCALP: 3675 - 3677, SL 3674, TP 3694 - 3700 - 3719
❌ SELL SCALP: 3719 - 3721, SL 3723, TP 3700 - 3675 - 3660
- - - - - - - - - - - - -
✅ SWING BUY: 3550 - 3560, SL 3540, TP 3625 - 3675 - 3700 - OPEN
❌ SWING SELL: 3790 - 3801, SL 2820, TP 3700 - 3570 - 3450 - OPEN
Hope is right lol! xoxo
