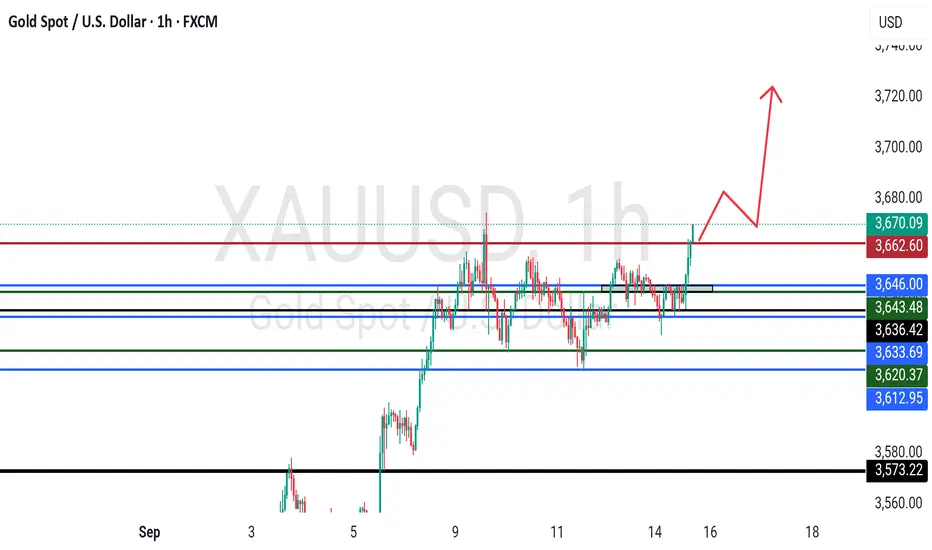
GOLD Trade Update📢 NFX FX:XAUUSD Trade Update
TVC:GOLD recently dropped to retest the key SR level at 3660 – the previous ascending triangle breakout level on H1 TF.
Following the 25bps cut by ECONOMICS:CAINTR BoC , the retest was strongly rejected, resulting in a +200pts gain.
🔎 Current Outlook:
Price is trending towards the recent ATH at 3700
Watching for a breakout above 3685 ahead of the Fed Rate Cut
Market expectation: 25bps cut from the ECONOMICS:USINTR → could trigger an instant +200pts move
⚖️ Bias: Bullish – but stay sharp ahead of high-impact news.
✍️ Trade smart, stay disciplined, and protect your capital.
Goldlong

Gold XAUUSD Intraday Setup 17 SeptI am looking for a bullish setup on Gold ahead of FOMC, with my buy zone placed at 3669–3671, which aligns with previous support and a liquidity grab area. My stop-loss is set just below the recent swing low at 3658, keeping risk contained. If data comes in favor, I expect price to rally toward the 3703+ zone, with potential extension toward all-time highs as momentum builds. The setup offers a strong risk-to-reward profile, and given the rejection from lower levels, I’ll be watching closely for fundamentals to confirm continuation to the upside.

FOMC XAUUSD: Time to hold super SELL before FOMC🟡 XAUUSD Daily Trading Plan – Ahead of FOMC
📊 Market Context
Gold (XAUUSD) has recently broken out of its accumulation/manipulation zone and is currently trading around 3,684–3,690.
Market is in bullish structure after a Change of Character (CHoCH) followed by a Break of Structure (BOS).
However, imbalances remain below current price, suggesting a potential retracement before continuation.
Liquidity pools are forming above 3,721–3,725, creating the risk of false breakouts (liquidity traps) near FOMC.
🔎 Technical Analysis (SMC Perspective)
Structure: Bullish bias on H1/H4, confirmed by higher highs and BOS.
Imbalance Zone: 3,674 → 3,664 (likely to be revisited).
Liquidity Pools:
Buy-side liquidity at 3,721–3,725 (Sell Zone).
Sell-side liquidity around 3,626–3,624 (Equal Low Zone).
🔑 Key Levels
Resistance / Sell Zone:
3,686.88 (immediate resistance)
3,721–3,725 (Liquidity Sell Zone)
Support / Buy Zones:
3,668 (Front End Buy – imbalance retest)
3,656–3,654 (Back End CP Buy Zone)
3,626–3,624 (Equal Low Liquidity Zone)
✅ Priority Scenario – BUY
Entry 1
BUY Limit: 3,668 (Front End Zone – imbalance retest)
SL: 3,661
TP: 3,690 → 3,700 → 3,721
Entry 2
BUY Limit: 3,656 – 3,654 (Back End CP Buy Zone)
SL: 3,648
TP: 3,690 → 3,700 → 3,721
Entry 3
BUY Limit: 3,626 – 3,624 (Equal Low Liquidity)
SL: 3,618
TP: 3,690 → 3,700 → 3,721
🔻 Alternative Scenario – SELL (Counter-trade)
If price reaches 3,721–3,725 (Liquidity Zone) before retesting lower buy zones → watch for rejection patterns.
SELL if bearish confirmation appears.
SL: 3,730
TP: 3,698 → 3,690 → 3,676
⚠️ Risk Management & Notes
Expect high volatility during FOMC – traps around liquidity zones are likely.
Reduce lot size before news release to mitigate risk.
Stick to confirmation entries (avoid blind buys/sells).
Main directional bias: Bullish as long as 3,648 holds.

Gold Buy Zone ActiveGold buy zone active in 3660- 3656 aria.
tp is ATH 3700
SL- 3653
Manage Risk
Fallow for More

GOLD HITS RESISTANCE AT 3,703 – SHORT-TERM PROFIT TAKING LIKELY📊 Market Drivers:
- Gold reached a historic high at US$3,703/oz, driven by stronger-than-expected U.S. Retail Sales and Industrial Production data, though a weaker USD continues to provide support.
- Markets are now awaiting the upcoming Fed meeting to gauge potential monetary policy adjustments — creating uncertainty and possible volatility for gold.
📉 Technical Analysis:
• Key Resistance: ~ $3,703/oz — the recent peak. A breakout with strong volume could open the way towards US$3,750–3,800.
• Nearest Support: ~ $3,650–3,670/oz. Holding this level is crucial to prevent a deeper pullback.
• EMA-09: Price is fluctuating around the 9-period EMA on the short-term chart. A drop below the EMA could signal a corrective phase.
• Candlestick / Volume / Momentum:
• Clear profit-taking pressure appeared when price touched 3,703.
• RSI is in the overbought zone near the peak — warning of a potential short-term pullback.
📌 Outlook:
Gold may pull back slightly in the short term due to profit-taking after hitting the record high, especially if the USD strengthens or U.S. data continues to surprise on the upside.
However, if support at US$3,650–3,670 holds, gold could rebound and head towards US$3,750–3,800 should the Fed deliver dovish signals.
💡 Suggested Trading Strategy
🔻 SELL XAU/USD
Entry: 3,712 – 3,715
🎯 TP: 40 / 80 / 200 pips
❌ SL: 3,718
🔺 BUY XAU/USD
Entry: 3,657 – 3,660
🎯 TP: 40 / 80 / 200 pips
❌ SL: 3,654

XAUUSD DONT CALL THE HIGH Gold is bullish and i want price to drop lower and see what it does for news later in the day. But bullish on gold long term.

Gold 3697 can activate a short order.After breaking through its recent high yesterday, gold prices continued their upward trend on Tuesday, reaching a new high. The intraday rally briefly approached the 3700 mark. However, due to pressure from this mark, gold temporarily entered a period of volatile correction.
Prior to Thursday's Federal Reserve interest rate decision, short-term trading is the primary focus. With gold prices hitting new highs for two consecutive trading days, the possibility of a brief profit-taking dip cannot be ruled out. Furthermore, the bullish trend in short-term technical indicators is weakening. I plan to initiate a short position around 3695. If you already have a short position, you can add to it. We anticipate a small downward correction.
Gold Trading Strategy:
Initiate a short position at 3697. If you already have a short position at a lower level, add to it to lower the average price.
Interaction:
For those holding short positions around 3650, please leave a comment. I'll respond based on the price action and help you turn a loss into a profit. OANDA:XAUUSD FX:XAUUSD TVC:GOLD

GOLD READY TO FALL ? Gold Prediction
Gold Buy From Order Block / Demand Zone
It Will Sweep The Liquidity And Then Go Long With High Probability Setup

ANFIBO | XAUUSD got ATH on 09.16.2025 and what?Gold has made a new breakout by breaking through the sizeway zone and rising to a new ATH. The plan is that we need to pay attention to the price zone around the 3700 resistance. Today's plan is as follows:
💚 SUPPORT ZONES: 3675 - 3655
❤️ RESISTANCE ZONES: 3700 - 3705 - 3745
✅ BUY SCALP: around 3675, SL 3670, TP 3700 - 3745
❌ SELL SCALP: 3700 - 3705, SL 3710, TP 3675 - 3655
✅ SWING BUY: 3550 - 3560, SL 3540, TP 3625 - 3675 - 3700 - OPEN
❌ SWING SELL: 3790 - 3801, SL 2820, TP 3700 - 3570 - 3450 - OPEN
Hope is right!

Gold Hits New ATH, Eyeing $3700 Psychological Barrier📊 Market Developments:
Gold surged sharply and set a new all-time high at $3,697/oz. The main driver comes from expectations that the Fed may soon signal rate cuts, while investors seek gold as a safe haven amid geopolitical uncertainty.
📈 Technical Analysis:
• New Resistance: $3700 (psychological) – $3708 (Fibonacci extension).
• Nearby Support: $3690 – $3685 (previous ATH breakout zone).
• EMA 50 & 100 on H1: Both remain upward sloping, reinforcing the bullish trend.
• H1 Candle: Strong momentum, but a short pullback may occur around 3700.
🔎 Outlook:
The uptrend remains dominant; however, the $3700–$3708 zone is a key psychological barrier where short-term profit-taking may emerge. If price holds above $3685, the bullish momentum is likely to continue.
🎯 Suggested Trading Strategy:
• BUY (safe entry): 3691 – 3688, SL: 3685, TP: 40–80–200 pips.
• SELL short-term (scalping): Around 3700–3705 if H1 reversal candles appear, SL: 3710, TP: 30–60 pips.

President Trump Speaks, Israel Strikes—What’s Gold Gonna Do?Hey Guys,
It’s been a while since I dropped a gold chart. Got a ton of requests—so here’s a fresh swing setup for you.
Fundamentally, President Trump recently said “Trump says his patience with Putin is running out.” That kind of statement adds fuel to gold’s upside. Plus, Israel’s attacks in the Middle East are also pushing gold higher.
Right now, gold’s in a resting phase. But I’m expecting a move toward $3700 either this week or next.
Technically, I’m seeing a clean bull flag pattern.
I always work with both fundamentals and technicals. That’s why my swing target is $3700.
Every like you send is my biggest motivation to keep sharing these setups. Big thanks to everyone backing me.

Gold Holds Strong, Buy on Nearby Support📊 Market Developments:
• Gold remains firm above $3,680/oz, after hitting a fresh high near $3,689, supported by a weaker USD and strong Fed rate-cut expectations.
• Traders are cautious ahead of Fed Chair Powell’s speech tomorrow, causing choppy moves at elevated levels.
📉 Technical Analysis:
• Key Resistance: $3,720 – $3,730/oz → breakout could extend rally higher.
• Nearest Support: $3,668 – $3,672 (EMA-09 H1) and $3,660 – $3,662 (recent pullback low).
• EMA: Price trades well above EMA-09 and EMA-50 → bullish bias intact.
• Candlestick / Volume / Momentum: Strong buying pressure in recent H1 candles, but RSI shows overbought signals → a short-term dip likely before resuming higher.
📌 Outlook:
Gold remains bullish overall. Short-term corrections to $3,668 – $3,672 or deeper to $3,660 – $3,662 are likely buying opportunities if these supports hold.
💡 Suggested Trading Strategy:
🔺 BUY XAU/USD
• Entry: $3,668 – $3,672
🎯 TP: 40 / 80 / 200 pips
❌ SL: $3665
🔻 SELL XAU/USD
• Entry: $3,725 – $3,727 – small lot (if tested strongly)
🎯 TP: 40 / 80 pips
❌ SL: $3730

“Gold Shines Bright | Bullish Momentum Targeting $3,700🔎 Technical Analysis – XAU/USD (1H Chart)
Trend: Strong bullish trend confirmed, with price making higher highs and higher lows.
Buy Zone: Around 3,590 – 3,600 USD, where buyers stepped in aggressively.
Short-Term Target 🎯: 3,650 – 3,700 USD (already highlighted on chart).
Key Support Levels:
3,561 USD (near-term support)
3,490 USD (major support, bullish structure invalidation if broken)
📌 Outlook: As long as price holds above the buy zone, momentum favors bulls with potential continuation toward 3,700+ USD.
🌍 Fundamental Drivers for Gold Bullishness ✨
Federal Reserve Rate Cuts Expectations 🏦⬇️ – If the Fed signals easing or holds a dovish stance, real yields fall → Gold strengthens.
Weakening US Dollar (DXY) 💵📉 – A softer dollar makes gold more attractive to global investors.
Geopolitical Risks 🌍⚠️ – Rising global tensions increase demand for safe-haven assets like gold.
Central Bank Demand 🏦🔒 – Many central banks are adding gold reserves to hedge against currency risks.
Inflation Hedge 📊🔥 – Gold remains attractive when inflationary pressures stay elevated.

XAUUSDHello Traders! 👋
What are your thoughts on Gold?
Gold has entered a corrective phase after printing a new high and is currently consolidating within a clearly defined channel.
The price is fluctuating inside this channel and may even test the lower boundary before continuing higher.
As long as gold remains within the channel, sideways to slightly downward movement can be expected in the short term.
A bullish breakout above the channel would likely act as a trigger for the next impulsive move, potentially leading to a new all-time high.
This week, the U.S. interest rate decision will be in the spotlight, which could significantly impact gold’s next move.
Wait for a confirmed breakout before entering long. Premature entries within the range may face choppy action.
Don’t forget to like and share your thoughts in the comments! ❤️

Are you still holding your short position?Gold broke out of a low-level consolidation phase on Monday and experienced a significant upward movement. The primary drivers of this rally were heightened geopolitical tensions, which enhanced gold’s safe-haven appeal, as well as the weakening of the US dollar and declining US bond yields.
During this substantial price surge, many traders have been forced to exit their positions prematurely. While some continue to hold on, a large portion of market participants are making trading decisions based primarily on intuition rather than objective analysis. A common belief among traders is that a significant rise in price will likely be followed by a correction. However, in this case, gold has continued to rise steadily without any notable reversal.
Short-term trading strategy for gold: Consider opening a short position near or above the intact resistance level of 3685.
For those who are currently holding short positions at lower levels, please feel free to leave a comment and follow for further analysis and tailored guidance. OANDA:XAUUSD FX:XAUUSD FX:XAUUSD

Intraday short position is dominant, beware of big drop#XAUUSD OANDA:XAUUSD
As I analyzed with you over the weekend, although gold prices largely fluctuated at high levels last week, the overall structure remained within an upward trend. Yesterday's daily line closed with a big positive line, breaking the box-shaped oscillation in one fell swoop. This morning, gold continued its bullish trend, reaching a high of around 3689. Judging from the market trends, the overall short-term bullish trend remains unchanged, but this does not mean the end of the short position.
First, the risk of chasing high prices is far greater than shorting, and the technical analysis suggests a potential correction.
As the price of gold rises, the previous resistance gradually turns into short-term support. If gold wants to continue to rise, it must at least fall back to 3665-3655.
Secondly, regarding the news, first, although the fourth China-US talks have not yet released any signals about tariffs, the news released by China is conducive to positive developments. Second, the court dismissed Trump's charges against Cook. Although the White House has stated that it will continue to do so, this move has effectively reduced market concerns about the independence of the Federal Reserve. From the news perspective, it is conducive to the decline of gold.
Therefore, I remain optimistic about a short-term pullback in gold prices. Those without existing orders can consider continuing to short gold in batches above 3680, with a short-term target of 3665-3655. It can not only effectively raise the average price, but also occupy an advantageous position when gold experiences a sharp correction. However, it should be noted that in short trading, the number of trading lots must be strictly controlled to reduce trading risks and not let the account collapse on the eve of profit.

GOLD New High Record Break Gold New High on the Way! 🔥
Current Price: 3635
📈 Buy Entry Active — Target 3690
✨ Gold is in full bullish control.
✨ Buyers pushing strongly toward new record highs.
✨ Market confidence remains unshaken.
✨ Every dip is being bought instantly.
✨ Strong fundamentals + technicals support upside.
✨ Next resistance is ready to be tested soon.
✨ A breakout above 3690 can open doors for even higher levels.
✨ This could be the start of another major rally.
⚡ Don’t wait — secure your position now before the breakout run begins!

GOLD Breakout ? What's next??#GOLD.. market just broke his upside resistance area.
Keep close and sustain above means another bull run on the table.
Good luck
Trade wisely
Trade cautiously and wait for a pullback to go longGood morning, my friends.
At present, gold continues to rise, and blindly chasing more will definitely lead to huge risks. We originally planned to wait for gold to pull back before going long, but the market did not give us this opportunity.
I didn't let you blindly chase the short positions yesterday. Now, are you glad that you followed my advice and didn't enter the market rashly? I know that after it hit 3675 yesterday, there must have been a lot of people shorting the market. Many brothers even held their positions until today, but found that the market did not give a good retracement point. At this time, it's even more important to avoid being manipulated by emotions and engaging in revenge trading.
In the short term, the prudent approach is still to wait for gold to pull back before going long. In the short term, focus on 3675-3665. If it does not break through the pullback, you can try to go long on gold.

Gold Ready for the Next RallyOver the past few sessions, I’ve observed gold consolidating within a Symmetrical Triangle after a strong bullish move. From my experience, this pattern often represents a “pause for breath” before the market resumes its primary trend.
What caught my attention most is that price has just broken above the upper boundary of the triangle, signaling a clear breakout. That said, I won’t be rushing into a trade. I always prioritize safety, so I’ll wait for price to retest the breakout zone. If the former resistance holds as new support and shows strong rejection, that will be my ideal entry point.
Based on my projection, the upside target for this setup is around 3,720 USD. For risk management, I would place the stoploss either below the lower boundary of the triangle or just under the breakout zone, depending on risk appetite.
On the H2 timeframe, this Symmetrical Triangle setup looks highly reliable since it aligns with the broader bullish trend. If the breakout holds, I believe gold still has plenty of room to climb higher.

Gold XAUUSD: Anticipating a Retracement for Continuation Long📊 Currently watching Gold (XAUUSD), price has been pushing aggressively higher in a strong bullish trend. However, the market is now reaching into areas of thin liquidity, appearing somewhat overextended.
🔎 I’m anticipating a potential retracement toward the 50% equilibrium level of the previous price swing. Within an ongoing uptrend, the Fibonacci 61.8% retracement often acts as a prime entry zone 🏹 for continuation trades.
⚖️ If price pulls back and establishes support, followed by a bullish break of market structure, that would provide a high-probability opportunity. If the setup fails to materialize, then there’s simply no trade — patience is key.
⚠️ Disclaimer: This is educational analysis only and not financial advice. Always manage risk appropriately.

Gold (XAU/USD) –> Bullish Rectangle Pattern BreakoutHello guys!
💥Gold has been consolidating in a bullish rectangle pattern after a strong upward move. This type of pattern usually signals continuation, with price gearing up for the next leg higher.
🔹 Setup:
The rectangle formed around $3680–$3690 support and resistance near $3689.
A clean breakout above $3689 gives the entry signal for the continuation move.
🔹 Targets:
First target: $3705
Second target: $3724
🔹 Stop Loss:
Below the rectangle support ($3674–$3682) to stay protected against a false breakout.
📌 Conclusion:
The bullish rectangle pattern suggests that Gold is preparing for another push higher. A breakout above 3689 opens the path first to 3705, and then to the extended target at 3724.
Disclaimer: As part of ThinkMarkets’ Influencer Program, I am sponsored to share and publish their charts in my analysis.

GOLD H1 | Bullish continuationBased on the H1 chart analysis, we could see the price fall to the buy entry at 3,655.51, which is a pullback support that lines up with the 50% Fibonacci retracement and could bounce from this level to our take profit.
Stop loss is at 3,631.24, which is a pullback support.
Take profit is at 3,684.97, which is a pullback resistance.
High Risk Investment Warning
Trading Forex/CFDs on margin carries a high level of risk and may not be suitable for all investors. Leverage can work against you.
Stratos Markets Limited (tradu.com ):
CFDs are complex instruments and come with a high risk of losing money rapidly due to leverage. 65% of retail investor accounts lose money when trading CFDs with this provider. You should consider whether you understand how CFDs work and whether you can afford to take the high risk of losing your money.
Stratos Europe Ltd (tradu.com ):
CFDs are complex instruments and come with a high risk of losing money rapidly due to leverage. 66% of retail investor accounts lose money when trading CFDs with this provider. You should consider whether you understand how CFDs work and whether you can afford to take the high risk of losing your money.
Stratos Global LLC (tradu.com ):
Losses can exceed deposits.
Please be advised that the information presented on TradingView is provided to Tradu (‘Company’, ‘we’) by a third-party provider (‘TFA Global Pte Ltd’). Please be reminded that you are solely responsible for the trading decisions on your account. There is a very high degree of risk involved in trading. Any information and/or content is intended entirely for research, educational and informational purposes only and does not constitute investment or consultation advice or investment strategy. The information is not tailored to the investment needs of any specific person and therefore does not involve a consideration of any of the investment objectives, financial situation or needs of any viewer that may receive it. Kindly also note that past performance is not a reliable indicator of future results. Actual results may differ materially from those anticipated in forward-looking or past performance statements. We assume no liability as to the accuracy or completeness of any of the information and/or content provided herein and the Company cannot be held responsible for any omission, mistake nor for any loss or damage including without limitation to any loss of profit which may arise from reliance on any information supplied by TFA Global Pte Ltd.
The speaker(s) is neither an employee, agent nor representative of Tradu and is therefore acting independently. The opinions given are their own, constitute general market commentary, and do not constitute the opinion or advice of Tradu or any form of personal or investment advice. Tradu neither endorses nor guarantees offerings of third-party speakers, nor is Tradu responsible for the content, veracity or opinions of third-party speakers, presenters or participants.
