GOLD H1 | Bullish continuationBased on the H1 chart analysis, we could see the price fall to the buy entry at 3,655.51, which is a pullback support that lines up with the 50% Fibonacci retracement and could bounce from this level to our take profit.
Stop loss is at 3,631.24, which is a pullback support.
Take profit is at 3,684.97, which is a pullback resistance.
High Risk Investment Warning
Trading Forex/CFDs on margin carries a high level of risk and may not be suitable for all investors. Leverage can work against you.
Stratos Markets Limited (tradu.com ):
CFDs are complex instruments and come with a high risk of losing money rapidly due to leverage. 65% of retail investor accounts lose money when trading CFDs with this provider. You should consider whether you understand how CFDs work and whether you can afford to take the high risk of losing your money.
Stratos Europe Ltd (tradu.com ):
CFDs are complex instruments and come with a high risk of losing money rapidly due to leverage. 66% of retail investor accounts lose money when trading CFDs with this provider. You should consider whether you understand how CFDs work and whether you can afford to take the high risk of losing your money.
Stratos Global LLC (tradu.com ):
Losses can exceed deposits.
Please be advised that the information presented on TradingView is provided to Tradu (‘Company’, ‘we’) by a third-party provider (‘TFA Global Pte Ltd’). Please be reminded that you are solely responsible for the trading decisions on your account. There is a very high degree of risk involved in trading. Any information and/or content is intended entirely for research, educational and informational purposes only and does not constitute investment or consultation advice or investment strategy. The information is not tailored to the investment needs of any specific person and therefore does not involve a consideration of any of the investment objectives, financial situation or needs of any viewer that may receive it. Kindly also note that past performance is not a reliable indicator of future results. Actual results may differ materially from those anticipated in forward-looking or past performance statements. We assume no liability as to the accuracy or completeness of any of the information and/or content provided herein and the Company cannot be held responsible for any omission, mistake nor for any loss or damage including without limitation to any loss of profit which may arise from reliance on any information supplied by TFA Global Pte Ltd.
The speaker(s) is neither an employee, agent nor representative of Tradu and is therefore acting independently. The opinions given are their own, constitute general market commentary, and do not constitute the opinion or advice of Tradu or any form of personal or investment advice. Tradu neither endorses nor guarantees offerings of third-party speakers, nor is Tradu responsible for the content, veracity or opinions of third-party speakers, presenters or participants.
Goldlong

Gold 1H – Breakout Liquidity Trap Ahead of ExpansionGold on the 1H timeframe is consolidating near 3,652 after sweeping discount liquidity and reclaiming structure. Price has tapped into the breakout zone and is now positioned between premium scalp supply and higher liquidity pools. The structure suggests engineered plays into 3,656–3,658 or deeper liquidity toward 3,672–3,674 before expansion. Discount demand remains protected at 3,614–3,612.
________________________________________
📌 Key Structure & Liquidity Zones (1H):
• 🔴 SELL ZONE 3,672 – 3,674 (SL 3,679): Premium supply pocket for engineered rejection targeting 3,660 → 3,650 → 3,640.
• 🔴 SELL SCALP 3,656 – 3,658 (SL 3,663): Short-term premium sweep zone for intraday liquidity grabs targeting 3,645 → 3,640.
• 🟢 BUY ZONE 3,614 – 3,612 (SL 3,607): Discount demand block aligned with bullish order flow targeting 3,630 → 3,640 → 3,655.
________________________________________
📊 Trading Ideas (Scenario-Based):
🔻 Sell Setup – Premium Scalp Rejection
• Entry: 3,656 – 3,658
• Stop Loss: 3,663
• Take Profits:
TP1: 3,645
TP2: 3,640
👉 Intraday scalp opportunity if price sweeps into shallow premium liquidity.
🔻 Sell Setup – Deeper Premium Sweep
• Entry: 3,672 – 3,674
• Stop Loss: 3,679
• Take Profits:
TP1: 3,660
TP2: 3,650
TP3: 3,640
👉 Expect engineered sweep into higher premium before reversal.
🔺 Buy Setup – Discount Demand Reaction
• Entry: 3,614 – 3,612
• Stop Loss: 3,607
• Take Profits:
TP1: 3,630
TP2: 3,640
TP3: 3,655
👉 High R:R play if price retraces to protected demand before expansion.
________________________________________
🔑 Strategy Note
Smart money is likely to manipulate both premium and discount zones around the breakout point. Bias favors:
• Scalp sells at 3,656–3,658
• Swing sells at 3,672–3,674
• Discount buys at 3,614–3,612
Risk management is critical — expect liquidity sweeps both sides before real expansion.

Gold Sideways Ahead of FOMC, Holding Support at $3,638📊 Gold Analysis (XAU/USD)
• Current: Price is trading around $3,642, holding support at $3,638, with resistance near $3,646–$3,650. Market remains sideways, waiting for Fed news.
• Technical:
o Holding above $3,638 → potential rebound to $3,650 – $3,655, possibly $3,668.
o Break below $3,638 → could drop to $3,632 – $3,628.
• Trend: Consolidation in a narrow range, awaiting FOMC breakout.
• Strategy:
o BUY around $3,638–$3,632 with tight SL.
o SELL near $3,646–$3,655 if no breakout occurs.

GOLD: No Bears In SightGold is still bullish. If price pulls back, the 3660–3665 zone is my POI. If momentum keeps driving and we get a breakout above 3690, my target will be 3725. Gold has pushed well beyond the 3660 liquidity pool, confirming buyers strength.
(H1)
Impulsive leg from 3642-3677 left behind some imbalances below:
3660–3665 FVG (fresh demand).
3635–3642 (deeper support if volatility spikes).
As long as gold holds above 3660, buyers remain in control.
(M15)
Price is consolidating just under 3680, showing short-term exhaustion after the run.
Liquidity rests above 3685–3690, which could be swept next.
We also have equal lows at 3665 which may get tested if a pullback occurs.
Pullback Buy (High-Probability)
Entry Zone 3660–3665
SL 3650
TP1 3685
TP2 3700
TP3 3725
Breakout Buy (If No Pullback)
Entry Break above + Retest 3690
Stop Loss 3680
TP1 3705
TP2 3725
Invalidation: H4 close below 3650, which would open retrace toward 3635.

Gold XAUUSD Intraday Move 15 Sept 2025Gold continues to show resilience within a bullish structure, and the current setup highlights two potential aggressive buying opportunities. The first lies between 3637–3639, while a deeper retracement toward 3630–3633 also offers an attractive entry point, with both setups well-protected by a stop loss at 3622. These zones align with key demand levels and trendline support, suggesting strong buying interest on dips. Upside targets remain at 3657 initially and extend toward the 3674 region, reflecting a continuation of the broader bullish trend. The reasoning behind this bias stems from both technical and fundamental factors — technically, the market continues to form higher lows, signaling strength, while fundamentally, expectations of potential rate cuts this week could weaken the dollar and further support gold prices. Together, these elements create a favorable environment for buyers, offering strong risk-to-reward opportunities in anticipation of continued bullish momentum.

GOLD BULLISH TREND: Possible Buys From 3,640This week, my idea is for gold to continue pushing higher toward the all-time high liquidity. Price has recently broken structure to the upside, which confirms the bullish trend we’ve been seeing.
With this continuation, a new nearby demand zone has formed that I’ll be watching closely. Ideally, I’d like to see a pullback into that point of interest to allow proper accumulation before the next move up.
Confluences for GOLD Buys:
- Structure break to the upside confirms the bullish trend
- Clean, unmitigated 3hr demand zone below
- Higher and lower time frames both showing bullish control
- DXY remains bearish, which supports the bullish bias on gold
- No major news expected to disrupt the move
P.S. If gold respects the ATH and rejects it, breaking below my demand, then I’ll either look for short-term sells or wait for a deeper demand zone.

Gold - How High Will It GO?📢 NFX Market Update – FX:XAUUSD
TVC:GOLD just broke out of the bullish flag formation on the hourly timeframe, pushing through key resistance with conviction. This breakout signals strong bullish momentum and supports the continuation of the uptrend, especially as it aligns with our ABC Elliott Wave structure.
If buyers sustain this momentum, new highs could be printed ahead of Wednesday’s FED rate decision, with potential for an even stronger rally post-decision - similar to the price action observed during the recent NFP release.
I remain bullish on gold here, but I’d love to hear your views as well in the comment below.
More insights are covered in the video.

Gold 1H – Fed Week: Liquidity Sweeps Before FOMCGold on the 1H timeframe is ranging around 3,643 after a series of ChoCH/BOS prints. Liquidity is stacked above the intraday buy zone at 3,658–3,656 and higher at 3,676–3,678, while discount liquidity sits near 3,615–3,613. With markets pricing a potential Fed cut this week and dot-plot guidance in focus, expect engineered spikes into premium followed by mean reversion before any sustained move.
________________________________________
📌 Key Structure & Liquidity Zones (1H):
• 🔴 SELL ZONE 3,676 – 3,678 (SL 3,683): Premium resistance for engineered sweep/rejection targeting 3,665 → 3,655 → 3,645.
• 🟢 BUY ZONE 3,658 – 3,656 (SL 3,651): Intraday demand inside prior consolidation targeting 3,665 → 3,670 → 3,675+.
• 🟢 BUY SUPPORT 3,615 – 3,613 (SL 3,610): Discount demand at the base of structure targeting 3,630 → 3,645 → 3,655+.
________________________________________
📊 Trading Ideas (Scenario-Based):
🔺 Buy Setup – Intraday Reclaim (3,658–3,656)
• Entry: 3,658 – 3,656
• Stop Loss: 3,651
• Take Profits:
TP1: 3,665
TP2: 3,670
TP3: 3,675+
👉 Look for a sweep into the zone and an H1 close back above 3,656 to confirm order-flow continuation.
🔺 Buy Setup – Deep Discount Sweep (3,615–3,613)
• Entry: 3,615 – 3,613
• Stop Loss: 3,610
• Take Profits:
TP1: 3,630
TP2: 3,645
TP3: 3,655+
👉 High R:R if liquidity runs into protected demand before New York session.
🔻 Sell Setup – Premium Sweep to Resistance (3,676–3,678)
• Entry: 3,676 – 3,678
• Stop Loss: 3,683
• Take Profits:
TP1: 3,665
TP2: 3,655
TP3: 3,645
👉 Expect stop-run above recent highs into premium; invalidate on strong H1 close above 3,683.
________________________________________
🔑 Strategy Note
Into Fed week, smart money often runs both sides of the book. Bias today favors: discount buys at 3,658–3,656 and 3,615–3,613, and a premium fade at 3,676–3,678. Use reduced size, wait for structure confirmation, and avoid holding through any unexpected Fed headlines or USD spikes.

Gold (XAUUSD) 6H – Bullish Order Flow With Key Liquidity TargetsOn the 6H timeframe, Gold shows a clear bullish order flow. Price recently tapped into the daily bullish FVG and reacted strongly to the upside, which supports my bullish bias.
From here, I expect the first target to be the buy-side liquidity around 3657. If momentum continues, the next objective could be a revisit to the all-time high.
⚠️ However, if price closes below 3612, this would shift the bias short-term bearish, with potential downside toward 3592.
Overall, I remain bullish for now, as long as price respects the key support levels.
💌It is my honor to share your comments with me💌
🔎 DYOR
💡Wait for the update!

Gold Holds Near Record Highs Ahead of Fed Rate DecisionGOLD – Overview
Gold edged lower in early trade on profit-taking and a firmer dollar but continues to hover near record highs ahead of the Federal Reserve’s rate decision later this week.
Markets widely expect a rate cut, with Powell’s commentary likely to provide key guidance on inflation, labor market weakness, and potential tariff impacts.
Prices also remain supported by safe-haven demand, robust central-bank buying, and continued inflows into gold-backed ETFs.
Technical Outlook
📈 Bullish scenario: Price shows a sensitive upward bias and may retest the resistance zone around 3,657. A 15-minute close above 3,664 would confirm continuation toward 3,665 → 3,683.
📉 Bearish scenario: A reversal and 1H close below 3,628 would signal downside pressure, targeting 3,612 → 3,600.
⚖️ Range watch: Consolidation is expected between 3,628 – 3,640 until a breakout occurs.
Key Levels
Pivot: 3,640
Resistance: 3,657 – 3,665 – 3,683
Support: 3,628 – 3,612 – 3,600
Bias: Neutral inside the 3,628–3,640 range; breakout direction confirmed on a close above 3,664 or below 3,628.

Will Gold Fly Again 3650 + ? Gold Looking For A High Pump
Gold Will Break The Triangle TL And Hit The BSL 3675
Have A Buy Trendline And RBS Green Box

The support is not broken,continue to go long when it falls backThe overall gold price is currently fluctuating and consolidating at a high level. Although gold has a slight correction in the Asian session this morning, it has not fallen out of the upward channel.
The market focus is still on the Federal Reserve's interest rate cut. In addition to this news, the fourth US-China meeting in Spain today is also worthy of our attention. If the two sides can reach a good negotiation on the tariff issue this time, then gold may fall. Otherwise, the price of gold will continue to rise.
Currently, gold has rebounded again and is consolidating around 3645. The short-term pressure from 3655-3665 is still there. If it fails to effectively break through this resistance area, then gold still has room for a short-term correction. Pay attention to the short-term support of 3635-3625 below. If the support is not broken, you can still consider going long on gold.
Gold Holds Above $3,640, Market Awaits Fresh Catalysts📊 Market Movement:
Gold is trading around $3,644/oz, consolidating in a narrow range after recent volatility. Investors remain cautious ahead of key Fed signals and U.S. economic data this week. A pause in the USD and U.S. bond yields is helping gold maintain crucial support.
📈 Technical Analysis:
• Near support: $3,638 – $3,632 (H1 EMA20 + Asian session low).
• Strong support: $3,620 (multiple tested lows).
• Near resistance: $3,650 – $3,655 (Asian session high).
• Strong resistance: $3,668 – $3,672 (H4 EMA50 + strong supply zone).
• RSI on H1 remains above 50, showing mild bullish momentum.
🤔 Outlook:
Gold is trading sideways within $3,638 – $3,655. A breakout above $3,655 may open the way to $3,670. Conversely, a breakdown below $3,632 could trigger a decline toward $3,620. The short-term trend remains in consolidation, awaiting a breakout signal.
🎯 Trading Strategy:
SELL XAU/USD: $3,655 – $3,658
🎯 TP: 40 / 80 / 200 pips
❌ SL: $3661
BUY XAU/USD: $3,638 – $3,635
🎯 TP: 40 / 80 / 200 pips
❌ SL: $3632

Can gold break through the resistance level?Whether you go long or short, you can make money, the only exception is the greedy. To invest, you must block excitement, or at least don't get excited at the wrong time. Emotions play a key role in all transactions. Spend all your time studying trends, never go against the trends, learn to follow, and then you can learn the essence. There is no invincible general in the financial market, and a person cannot make money beyond the scope of cognition. Investing itself is an assessment of self-cognition.
After gold fell to 3626, it rebounded slightly. It is still in a state of volatility as a whole, and the volatility is narrowing. From a technical point of view, the bullish momentum has not been exhausted, and the sideways movement of the gold market at this stage is far from over. From a big cycle perspective, 3675 is not a high point. However, as the interest rate decision approaches, both bulls and bears may turn to wait and see, and the short-term market is expected to be dominated by fluctuations, waiting for the Fed's monetary policy guidance! The upper resistance level is the pressure level formed by the two recent high points, and the support is at the lower track of the rising channel and the strong support of 3600.

XAUUSD Looks Ready for a Big MoveHey everyone, Ken here!
Looking at the XAUUSD chart today, I see a lot of interesting things. The price isn’t rushing upward, but moving step by step – almost like buyers are slowly taking control.
Personally, I won’t jump in just yet. I’d like to see a clear rejection first. If that scenario plays out, my target would be around 3,683 .
What really matters here isn’t just the number, but patience. I’ll wait for price to return to the marked level, then watch volume and candlestick patterns for confirmation.
What about you? Do you think this setup makes sense? Share your thoughts in the comments!

3655-3625 oscillation structure, sell high and buy low#XAUUSD OANDA:XAUUSD
Over the weekend, I reminded everyone to pay attention to a hidden piece of news.💻
China and the United States are currently holding their fourth round of talks in Spain on economic and trade issues, which involves tariffs. The outcome of the game between the two major powers will also affect the trend of gold. 📊The two sides are still negotiating, so please continue to pay attention.👀
Gold continued to fluctuate in the box at the opening today, fell slightly during the day and rebounded after testing the support below again. 🌈The short-term upward pressure still remains at 3655-3665. 📉I have repeatedly emphasized that only by breaking through and stabilizing above can gold continue to open up upward space. If it is difficult to break through during the day, gold will continue to fluctuate and pull back.
The price of gold is still in an upward channel. The correction range of gold at high levels is limited. The short-term support below is 3635-3625.🥅 Before it effectively falls below the support, it is difficult for gold to change the volatile pattern. However, if the price breaks below support and breaks the box structure, it is very likely to test the 3600 mark, or even the important support level of 3580.🐻
If the 3655-3625 box is not broken during the day, the buy low-sell high strategy will be maintained. 📊If it falls back to 3635-3625, you can continue to go long on gold, with the target at 3655-3665. If the upper resistance is touched, you can short gold with a light position.

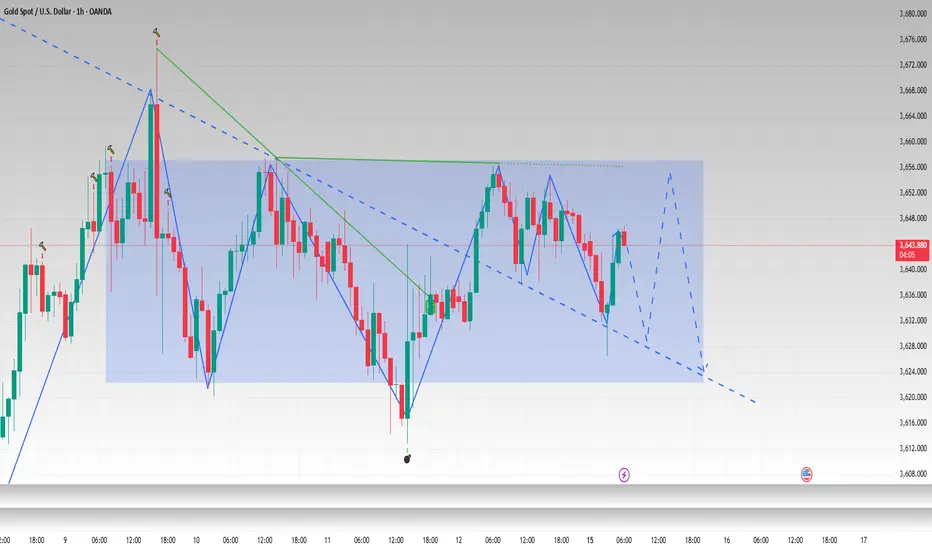
XAUUSD – Pennant Formation Awaiting ConfirmationXAUUSD – Pennant Formation Awaiting Confirmation
Good day Traders,
Gold commenced the week with a sharp advance of nearly 20 dollars after retesting the ascending trendline. This rebound reinforces the development of a Pennant Flag pattern, and the market now awaits a decisive breakout to provide clearer trading opportunities.
Bullish Scenario
A break above the upper boundary of the pattern, with confirmation ideally beyond 3657, would support continuation of the prevailing uptrend.
An optimal entry may be considered around 3650, with initial targets towards 3680.
Bearish Scenario
The 3627 level is a critical marker. A decisive close beneath this level, which also coincides with nearby support, would validate a short-term bearish outlook.
Entries may be initiated immediately on the break, or more conservatively on a retest around 3630.
Downside potential extends towards the 356x region, with scope for deeper correction should momentum persist.
Medium-Term Perspective
The 3560 – 3564 zone is highlighted as a favourable medium-term accumulation area, supported by an FVG and strong volume profile.
A wider stop, below 3544, would be necessary. While this requires sufficient account capacity, the trade aligns with the broader bullish structure and offers attractive reward potential.
This represents my trading outlook for gold today. Traders are encouraged to observe these levels closely and align them with their own analysis and risk management practices.
For those actively trading gold, you may follow my updates here and join the community to receive timely insights whenever price action shifts.
👉 Wishing all traders a disciplined and successful week ahead with Gold.

XAUUSD potential drop to 3600.00, FOMC reflection?with the upcoming FOMC started relect in GOLD as the price opened with sharp rejection with 2 back to 1h candles formed with liquidity grab. Though it is a long term bull market, a deeper pullback may come in play with potentially ranage bound since the FOMC as rate cut may ahead.
Until FOMC, we may see the market range 3657 to 3600
before it start to bounce of to the major direction of the trend or
depending on the Fed decision, even could see dropping back to monthly support

XAUUSD AKA GOLDI wont go against the bias but we can see gold taking liquidity on the downside and price is bullish so we can see price go higher from next week.

ANFIBO | XAUUSD Plan [15.10.2025 - 19.10.2025]Here is my XAUUSD plan for next week:
💚 SUPPORT ZONES : 3625 - 3595 - 3580 - 3575
❤️ RESISTANCE ZONES : 3665 - 3670 - 3700
✅ BUY SCALP : around 3595, SL 3580, TP 3625 - 3645 - 3670
❌ SELL SCALP :
(1) 3673 - 3675, SL 3678, TP 3645 - 3600
(2) 3700 - 3705, SL 3710, TP 3675 - 3610
✅ SWING BUY : 3550 - 3560, SL 3540, TP 3625 - 3675 - 3700 - OPEN
❌ SWING SELL : 3790 - 3801, SL 2820, TP 3700 - 3570 - 3450 - OPEN
Enjoy it guys! 😊

Wall Street Weekly Outlook - Week 38 2025Every week I release a Wall Street Weekly Outlook that highlights the key themes, market drivers, and risks that professional traders are watching.
This week promises to be particularly important, with several events likely to move markets. 📊 Stay ahead of the curve—watch the video now and get prepared like a Wall Street insider.
Any questions? Drop a comment or reach out directly.
-Meikel

XAUUSD – Week 3: Can Fibo 2.618 Hold Firm?XAUUSD – Week 3: Can Fibo 2.618 Hold Firm?
Good day traders,
Gold has rallied for three consecutive weeks, repeatedly setting fresh all-time highs. This has made trading conditions more complex, particularly for short-term participants. The main challenges are:
Buying: Difficult to identify a reasonable entry point.
Selling: Highly risky, as it goes against the prevailing strong uptrend and can be extremely dangerous.
Market Structure and Key Levels
Gold has reached the psychological Fibonacci 2.618 extension and reacted there, before consolidating sideways around 3643, the closing price for this week.
The development of a sideways formation suggests the market requires additional time before attempting a decisive breakout.
The current trading range sits between 3675 – 3616, and it is likely that price will continue consolidating within this 60-dollar band, compressing further.
Bullish Scenario
Should the upper boundary be broken, the next objective would be 3800, with a longer-term expectation towards 4000 in the year ahead.
Bearish Scenario
Attention should be paid to liquidity reaction zones (FVG): 3595 – 3568 – 3540.
The major long-term buying zone is around 3500, where liquidity testing would largely be completed.
Trading Strategy
Patience is essential. Traders are advised to wait for a clear confirmation when price breaks out of the current sideways range. That moment will offer more reliable opportunities to establish positions.
This is the scenario I propose for gold in the coming week. You may take it as a reference point and combine it with your own analysis to refine your trading plan.
For those actively engaged in gold trading, you are welcome to follow me and join the community for timely updates as market conditions evolve.
Wishing everyone a disciplined and successful trading week ahead.

A brief discussion on analysis and next week's trendGood weekend, is everyone having a good day today? Did you get together with family and friends? Regardless, I hope everyone enjoyed themselves.
Let me briefly tell you about our situation this week and my views on the gold trend next week. Gold maintained high-level fluctuations overall this week. Although it is still in an upward channel, it can be clearly seen from the daily chart that the upward momentum has slowed down compared with the continuous rise in the previous two weeks. Another intuitive feeling is that the current space below is much larger than the space above.
On Thursday and Friday, I repeatedly emphasized that only if gold breaks above 3660 can it continue to rise and reach the short-term high of 3675, or even a new high of 3690-3700. Considering that some friends find it difficult to distinguish between a genuine breakout and a false breakout, I suggested that the short-term resistance level of 3655-3665 be observed. Here I share a small piece of knowledge for your reference. In the face of a possible spike in the market, 80% of fluctuations are within the range of approximately $5-10. If you are unsure whether a resistance level has been effectively broken or a support level has been broken in the short term, you might as well leave yourself some room for maneuver and use a combination of small and large cycles to make judgments to avoid being distracted by false fluctuations.
Therefore, next week we can still consider focusing on the upper resistance range of 3655-3665. If the candlestick chart entity stands firmly above the resistance area, then the market will be as we expected, and the upper space is expected to be further opened in the short term.
From the news perspective, the first is an invisible piece of news that China and the United States will hold their fourth meeting, which will involve issues such as tariffs. If the two sides reach an agreement or move in a good direction this time, it may cool down the risk aversion sentiment and gold may fall. Secondly, Trump and Fed Governor Tim Cook are currently in legal proceedings. If Trump wins the case, will it reignite concerns about the independence of the Federal Reserve and thus interfere with gold prices?
Finally, the most important thing is the Fed's clear interest rate cut basis point. The current market generally expects a 25 basis point rate cut. Whether the "buy expectations and sell facts" strategy we have always emphasized can be fulfilled and trigger a drop in gold prices depends on Powell's speech attitude. If his stance this time leans towards the hawks, then the market trend will most likely be in line with our expectations.
Overall, we need to be more cautious when going long on gold next week and not be too greedy for profits. There is limited upward space in the short term. Focus on the breakthrough of the 3655-3665 resistance and beware of the impact of news. At present, everything is just analysis. Specific operations can wait for Monday’s trading strategy. Finally, I wish you all a happy weekend!
