A brief discussion on analysis and next week's trendGood weekend, is everyone having a good day today? Did you get together with family and friends? Regardless, I hope everyone enjoyed themselves.
Let me briefly tell you about our situation this week and my views on the gold trend next week. Gold maintained high-level fluctuations overall this week. Although it is still in an upward channel, it can be clearly seen from the daily chart that the upward momentum has slowed down compared with the continuous rise in the previous two weeks. Another intuitive feeling is that the current space below is much larger than the space above.
On Thursday and Friday, I repeatedly emphasized that only if gold breaks above 3660 can it continue to rise and reach the short-term high of 3675, or even a new high of 3690-3700. Considering that some friends find it difficult to distinguish between a genuine breakout and a false breakout, I suggested that the short-term resistance level of 3655-3665 be observed. Here I share a small piece of knowledge for your reference. In the face of a possible spike in the market, 80% of fluctuations are within the range of approximately $5-10. If you are unsure whether a resistance level has been effectively broken or a support level has been broken in the short term, you might as well leave yourself some room for maneuver and use a combination of small and large cycles to make judgments to avoid being distracted by false fluctuations.
Therefore, next week we can still consider focusing on the upper resistance range of 3655-3665. If the candlestick chart entity stands firmly above the resistance area, then the market will be as we expected, and the upper space is expected to be further opened in the short term.
From the news perspective, the first is an invisible piece of news that China and the United States will hold their fourth meeting, which will involve issues such as tariffs. If the two sides reach an agreement or move in a good direction this time, it may cool down the risk aversion sentiment and gold may fall. Secondly, Trump and Fed Governor Tim Cook are currently in legal proceedings. If Trump wins the case, will it reignite concerns about the independence of the Federal Reserve and thus interfere with gold prices?
Finally, the most important thing is the Fed's clear interest rate cut basis point. The current market generally expects a 25 basis point rate cut. Whether the "buy expectations and sell facts" strategy we have always emphasized can be fulfilled and trigger a drop in gold prices depends on Powell's speech attitude. If his stance this time leans towards the hawks, then the market trend will most likely be in line with our expectations.
Overall, we need to be more cautious when going long on gold next week and not be too greedy for profits. There is limited upward space in the short term. Focus on the breakthrough of the 3655-3665 resistance and beware of the impact of news. At present, everything is just analysis. Specific operations can wait for Monday’s trading strategy. Finally, I wish you all a happy weekend!
Goldlong

Aluminum Trade View
On daily price initiated upside move.
4hour chart good level of risk place to hold for long periods.

A Probable short Scalp on GOLD XAUUSDGold is in the overall bullish sentiment but currently the market is showing a probable Short scalp!

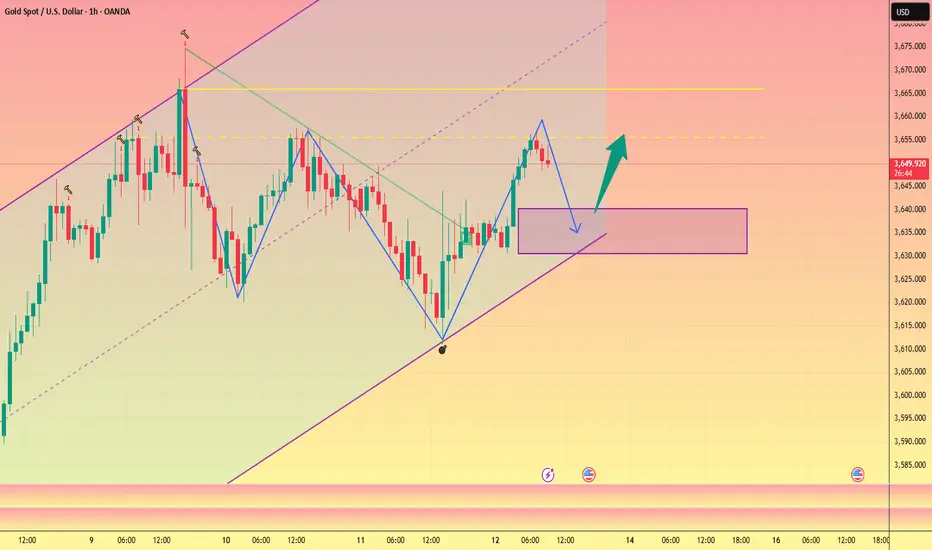
European session sees retracement, US session hits new highGood morning, everyone. Although gold has rebounded at present, it has not effectively broken through and stabilized above the short-term resistance of 3655-3660. In the short term, this resistance range still exerts a certain pressure on the gold price, but this does not mean that we give up the judgment that gold may reach a new high.
First of all, looking at the daily gold chart, we can find that yesterday's daily line closed with a negative line, but gold did not fall but rebounded and rose. This is not only the impact of data, but also shows that the buying funds in the current market are very strong. As I told you before, big changes in the market will only occur after the Fed's interest rate cut basis point is clear next week.
But at the same time, brothers need to be clear that we should be alert to the false break of gold. Therefore, we can give a floating space of about $5, relying on 3655-3665 to see the short-term suppression. It may fall back when encountering resistance here in the European session. You can try to short with a light position. The short-term support should focus on 3645-3635 below. If it falls back and the support is not broken, gold will continue to rise. In particular, be alert that gold in the US market may rebound to a new high based on the support level. If the European session directly returns to the lower support, we can go long on gold first.

Wait for new highs and go long on pullbacksA good day starts with profits, now let's analyze the trend of gold today.📊
Gold is currently consolidating around 3650, with 3655-3665 forming short-term resistance above. The 4H MACD indicator is correcting a top divergence. Having first touched this resistance level in the European session, gold may experience a pullback. 📉As the price of gold continues to rise, the short-term support also moves up. Pay attention to the short-term support area formed by 3640-3630. 🌈If gold retraces support and then rebounds above this resistance level, it could first reach 3675, or even reach a new high of 3690-3700, as we anticipated yesterday.🚀
Intraday operations are mainly long at low levels, supplemented by short at high levels, and participate in trading in key ranges.
Gold (XAU): $3700 is the next key resistanceGold (XAU): $3700 is the next key resistance
Gold has continued its impressive rally, with $3,700 emerging as the next key resistance level.
The first breakout above the $3,400 psychological zone occurred in late April, followed by a period of consolidation and repeated tests of that level.
Last week, the asset gained strong momentum, breaking decisively above this zone and reaching a new all-time high (ATH) of around $3,500.
This week, the bullish trend has extended further, with XAU/USD approaching the next critical psychological barrier near $3,700.
The key question remains: How much further can ongoing global economic tensions drive gold’s upward movement?
Resistance Level: $3,700
Support Levels: $3,600 / $3,500
Key Zone to Watch: $3,400
📌 This analysis is for educational purposes only. Please exercise caution and trade responsibly.
If you found this helpful, like, follow me, subscribe, share and comment.

Gold Set to Extend Gains as Fed Rate Cuts Loom📊 Market Developments:
Gold is supported by expectations that the Federal Reserve will cut interest rates, lowering the opportunity cost of holding bullion.
Recent U.S. labor market data showed weakness, with higher jobless claims and downward revisions in nonfarm payrolls.
CPI inflation remains elevated, while PPI softened slightly, reinforcing bets on policy easing.
A weaker U.S. dollar and lower Treasury yields further boost gold’s appeal.
📉 Technical Analysis:
• Key Resistance: $3,670 – $3,674, with further upside potential toward $3,700–$3,730.
• Nearest Support: $3,600; if broken, next levels at $3,561–$3,536.
• EMA: Price is trading above EMA50 and EMA200, keeping the bullish structure intact.
• Candlestick / Momentum: RSI remains elevated, showing strong upward momentum though slightly overbought; dips are being bought quickly.
📌 Outlook:
Gold may continue to rise in the short term if Fed maintains a dovish stance and U.S. data remain soft.
However, stronger-than-expected inflation or hawkish Fed signals could trigger a pullback toward $3,600 or lower.
________________________________________
💡 Suggested Trading Strategy:
• SELL XAU/USD: $3,682 – $3,685
🎯 TP: 40 / 80 / 200 pips
❌ SL: $3688
• BUY XAU/USD: $3,617 – $3,620
🎯 TP: 40 / 80 / 200 pips
❌ SL: $3614

XAUUSD Gold Intraday Move 12.09.2025Intraday Analysis
The market has recently broken out of a descending trendline, showing signs of bullish momentum. After the breakout, price retraced toward previous supply turned demand zones, creating potential buying opportunities at key levels.
Key Observations:
Trendline Breakout:
The downward trendline has been broken, indicating a possible shift in momentum from bearish to bullish. Retests of the broken structure often provide high-probability entries.
Demand Zones:
Zone 1 (3630–3633): This level aligns with a prior consolidation area and trendline retest. A bounce here could trigger continuation toward higher resistance.
Zone 2 (3612–3616): This is a deeper support zone and serves as a secondary buying opportunity if the first level fails.
Targets and Risk Management:
For Zone 1, the upside target is 3657 with a protective stop below 3622.
For Zone 2, the upside target is 3640 with a stop below 3606.
Both setups provide a favorable risk-to-reward ratio.
Confirmation Requirement:
Entries should only be considered once at least two confirmations are present. Possible confirmations include:
Bullish candlestick patterns (engulfing, pin bar, or strong rejection wicks).
Break of minor intraday structure to the upside.
Volume spike or momentum divergence supporting the bullish bias.
Conclusion:
The bias remains bullish while above 3612. The first area of interest is 3630–3633 for a potential long entry toward 3657. If price dips deeper, the 3612–3616 zone provides the next opportunity for a bounce targeting 3640. Proper confirmation is essential before committing to trades, and stops should be respected to manage risk effectively.

ANFIBO | I think XAUUSD on 12.10.2025 ???After breaking the H1 uptrend line, Gold returned to the Fibo retracement zone 0.5 with a strong rebound, the current price is moving around the price zone 3655 and still maintains a strong rebound. Pay attention to the following important zones for today's strategy:
>> SELL SCALP: 3673 - 3675, SL 3678, TP 3655 - 3625 - 3600
>> BUY SCALP: around 3595, SL 3588, TP 3625 - 3645 - 3665
>>> SWING BUY: 3560 - 3570, SL 3550, TP 3620 - 3675 - 3700 - OPEN
>>> SWING SELL: 3790 - 3801, SL 2820, TP 3700 - 3570 - 3450 - OPEN
Have a nice weekend guys! :D

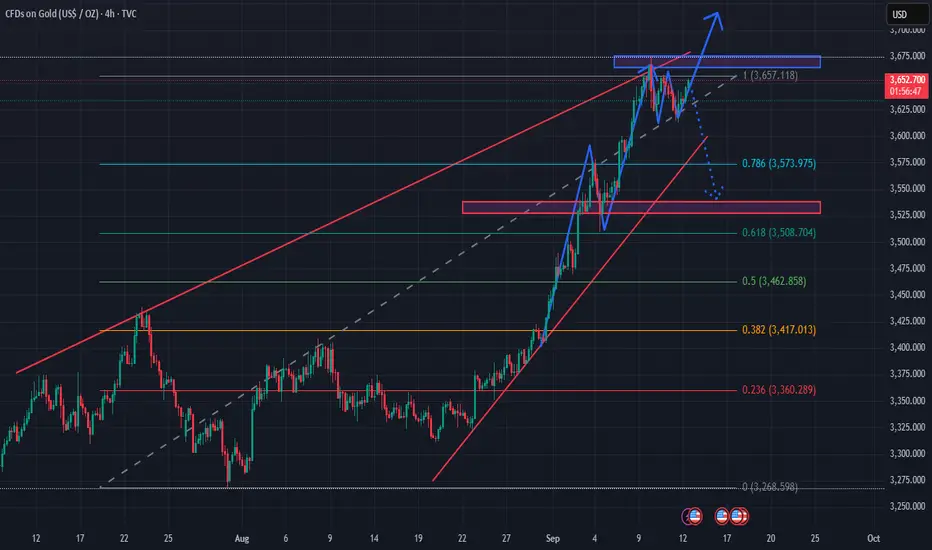
Buy if price breaks above 3,670 with confirmation, target around1. Main Trend
Gold remains in a strong uptrend, forming higher highs and higher lows.
The rising channel (red trendlines) is still intact, though price is now testing a strong resistance zone.
2. Resistance Zone & Upside Target
Key resistance area: 3,650 – 3,670 USD/oz (blue box on the chart).
If price breaks clearly above 3,670, the next target will likely be 3,700 – 3,720 (psychological level and Fibonacci extension zone).
3. Pullback Scenario
If price fails to break resistance, a pullback may occur toward Fibonacci retracement levels:
Fib 0.786 ≈ 3,574 USD (nearest support).
Fib 0.618 ≈ 3,509 USD (major support, aligning with previous demand zone – red box).
Fib 0.5 ≈ 3,463 USD (intermediate support).
The 3,500 – 3,510 USD zone is a critical support area; if broken, a deeper correction could unfold.
4. Technical Signals
Price is forming a small triangle/pennant pattern right at resistance → suggesting a strong breakout is likely soon.
RSI/Momentum (not shown here but typically at these levels) may be in overbought territory, increasing the chance of a short-term correction before resuming higher.
5. Trading Scenarios
Bullish case (preferred): Buy if price breaks above 3,670 with confirmation, target around 3,700 – 3,720.
Bearish case: If price gets rejected at resistance and breaks below the rising trendline, short-term selling may target 3,574 – 3,510.
📌 Summary:
The main trend remains bullish, but the 3,650 – 3,670 zone is the decision point.
A confirmed breakout → 3,700+.
Failure to hold → correction toward 3,574 or deeper to 3,510.
3615-3620 Buy! SL 3610 TP 3660!Yesterday, I clearly told everyone that, based on technical analysis of the one-hour chart, gold is bound to fall to 3620 unless there's any news or data impacting it! The low has already reached around 3622, but it hasn't fallen below 3620 yet! This is because it's a strong support level! The one-hour chart shows that gold has perfectly corrected from the top of the M-shaped pattern! Therefore, today's key support level is 3620! If 3620 doesn't break, you can buy gold near 3620! Set your stop-loss around 3618!
Let me tell you! All support and resistance levels require at least three rounds of repeated adjustments, tests, and accumulation before they can be broken!
So, today's trade is simple! As long as it doesn't fall below 3620, buy gold near 3620! If the price clearly falls below 3620 and doesn't rebound, set your stop-loss around 3620 and sell gold! ✔️✔️✔️
If you'd like to follow my latest updates, please contact me.
3615-3620 Buy!
SL 3610
TP 3660!

Gold Spikes After CPI but Faces Profit-Taking Pressure📊 Market Move:
Right after the CPI release, gold surged from $3613 to $3643, but profit-taking quickly dragged prices back to around $3635.
📈 Technical Analysis:
🔺 Resistance: 3645 – 3650
🔻 Support: 3626 – 3620
📉 Short-term EMA still points upward, suggesting the uptrend remains intact, though momentum has weakened after the spike.
🧐 Outlook:
Gold is undergoing a technical pullback after the sharp rally; the market needs further H1/H4 candle confirmation to see if the bullish move toward 3650+ continues.
🎯 Trading Strategy:
o Wait for a retest of 3626–3620; if reversal candles appear, consider a Buy following the trend.
o If price breaks below 3620, risk opens for a deeper drop toward 3610–3605.

Focus on CPI, 3640, 3620 long and short key pointsThe market focuses on CPI data, and in the short term 3640-3660 becomes the dividing line between bulls and bears for gold.
From the news perspective, due to the sharp decline in employment rate, the employment and economic environment in the United States have been affected, and a September interest rate cut is almost a foregone conclusion, which has prompted the recent continuous rise in gold prices. Whether the interim high of 3675 means that gold has peaked remains to be seen.
From a technical perspective, gold rebounded yesterday to correct Tuesday's decline, reaching a high of around 3657 before continuing its technically bearish downward trend and retreating to around 3640. Today, gold's overall volatility in the Asian and European sessions was limited, with 3640-3660 forming a short-term upper pressure, also becoming the dividing line between bulls and bears.
If the CPI data is bullish for gold, the first thing gold needs to do is to break through the short-term pressure of 3640-3660. Once it breaks through strongly and stabilizes above 3660, gold will continue to rise and is expected to set a new high of 690-3700.
On the contrary, if the CPI unexpectedly falls short, gold will only rebound tentatively but will be unable to break through the short-term suppression of 3640-3660, then the bears will officially counterattack and the market will briefly bid farewell to the bulls. A break below 3600 would target the key support level of 3580.
In summary, focus on the 3640-3660 resistance level and the 3620-3610 support level. If the European session sees a pullback to support without a break, a small, light position can be considered, For cautious traders, it's advisable to set the stop-loss order with a buffer of $3-5, depending on their account size.with a potential profit target of $10-$30. More conservative traders can wait for the CPI data before entering a trade.
Focus on CPI, beware of unexpected surprisesThe market focuses on CPI data, which is unlikely to fluctuate significantly in the short term. Although it has fallen below the recent support of 3620, buying below is still strong, so don't chase the short position. From the news and other recent data, it can be seen that the weak US employment data has suppressed the economy, forcing the Federal Reserve to cut interest rates. The current market basically assumes that 25 basis points has become a reality, so the possibility of positive CPI data is relatively high.
If the CPI data is positive for gold, it will first test the resistance level of 3640-3660. If the data triggers a strong rally, gold could potentially reach new highs, aiming for 3690-3700.
However, the previous NFP data was also crucial, but the result was a surprise. Therefore, we cannot rule out the possibility of a similar surprise with the CPI data. If the CPI data is bearish for gold, it will first test 3600 below. Once it falls below 3600, it will go to 3580.
The above content is just an analysis of the possible trend of gold, which you can refer to. If the European session retreats again to 3620-3610 without breaking, you can try to go long with a light position, and the ideal target is 3640-3660. If it falls below 3600, SL will be adjusted in time.

Gold Bulls in Full ControlHi everyone, it’s Ken here!
XAUUSD is maintaining a strong uptrend, and based on my observation, the market is likely to continue moving toward the channel top marked on the chart.
The current zone plays a crucial role. It could act as a support level that allows price to bounce higher. However, if this zone breaks, a deeper corrective move may start to unfold.
While I lean toward the bullish scenario, actual price action will ultimately determine the next direction. A decisive break below the trendline would invalidate the bullish outlook and open the risk of a pause or even a short-term reversal.
This is only my personal view based on chart analysis, not financial advice.
Wishing you success!

Gold is Ready For Bull After Forming a Strong SupportHello Traders
In This Chart GOLD HOURLY Forex Forecast By FOREX PLANET
today Gold analysis 👆
🟢This Chart includes_ (GOLD market update)
🟢What is The Next Opportunity on GOLD Market
🟢how to Enter to the Valid Entry With Assurance Profit
This CHART is For Trader's that Want to Improve Their Technical Analysis Skills and Their Trading By Understanding How To Analyze The Market Using Multiple Timeframes and Understanding The Bigger Picture on the Charts

Gold 3646 sell TP 3620The one-hour chart shows a minor support level at 3640, while 3620 is a major support level. The one-hour technical chart shows an M-top formation. Without data or news influence, the technical predictions are likely to hold. However, on the four-hour and weekly charts, the overall trend for gold remains upward. Yesterday, supported by data, gold experienced a significant pullback, then quickly rallied, but failed to break through the resistance level of 3660. Therefore, the upward momentum is currently insufficient, and gold is likely to continue its downward adjustment to around 3620 before rising again.✔️✔️

Gold swings violently after PPI data📊 Market Movement:
After the news, gold spiked to 3657 then quickly dropped to 3641. It is now recovering and trading around 3648, showing a tug-of-war between buyers and sellers.
🧭 Technical Analysis (H1):
• Resistance: 3652 – 3657
• Support: 3641 – 3638
• EMA20 is still pointing upward, but the strong wick candle shows high volatility.
• Break below 3641 → likely down to 3632 – 3628.
• Break above 3652 → likely retest 3660 – 3665.
📌 Outlook:
Gold is moving sideways in the 3641 – 3657 range.
🔻 Selling pressure is strong at the top.
🔺 Buyers are still defending around 3640.
👉 The next move depends on a breakout from this range.
Trading Strategy:
• 🔺 BUY: 3642 – 3645 | SL 3638 | TP : 40/80/200 pips
• 🔻 SELL: 3660 – 3657 | SL 3663 | TP : 40/80/200 pips
🟡 Focus on scalping within the range, wait for breakout to follow the bigger trend.

Gold Trade Idea Thurs 11 Sep Gold is breaking out of the ascending channel and we expect a new ATH again.
The big move might be before, during or after tonight CPI and PPI data.
Gold 30 min chart
Enter: Buy/long 3645
stop loss: 3630
Target 1: 3675
Target 2 : 3700

A brief discussion on my views on recent gold price trendsLast night, I clearly outlined my outlook for gold. Today, the gold price retreated to the support range of 3635-3620 and then stabilized and rebounded. Our long orders have reaped considerable profits. It is a pity that the limit long order set at 3620 before going to bed failed to be triggered, and I missed out on a bigger profit.
Currently, gold's volatility is relatively low, and it has rebounded again to around 3645, which aligns with my view that gold will remain in a range-bound pattern in the short term. Our trading strategy is still highly referenceable. If gold falls back to test the lower support again in the short term, we can still consider going long again. If gold slowly fluctuates upward in the European session, the first thing to pay attention to is whether it can effectively break through 3655. Once it effectively breaks through, gold may retest the short-term resistance of 3665-3680.

XAU/USD) Bullish trend analysis Read The captionSMC Trading point update
Technical analysis of Gold (XAU/USD) 1H analysis:
---
Technical Breakdown
1. Ascending Channel
Price is trending higher within a clear ascending channel, respecting both support and resistance trendlines.
The bullish structure remains intact as long as price holds above channel support.
2. Demand Zones (Yellow Boxes)
Price respected a Fair Value Gap (FVG) demand zone around $3,600 – $3,620, leading to bullish continuation.
Another demand area around $3,640 acted as a recent support after a market structure shift (MSS).
3. Market Structure
A bullish MSS confirms upside momentum.
Higher highs and higher lows support the ongoing bullish trend.
4. RSI (14)
RSI at 59.46, leaning bullish but not yet overbought — leaving room for continuation to the upside.
5. Target Point
Projection points towards $3,689 as the next target, aligning with channel resistance and Fibonacci extensions.
Mr SMC Trading point
---
Summary Idea
Gold is trading strongly within an ascending bullish channel, bouncing off demand zones and maintaining upward structure. As long as price holds above $3,640, the bias remains bullish with a target at $3,689.
---
please support boost 🚀 this analysis

GOLD Current support ? Holds or not??#GOLD... After na fantastic ride and now market immediate support is 3627-28
Keep close and holding of that area will leads us towards upside areas otherwise not..
NOTE: we will go for cut n reverse below 3628 on confirmation.
Good luck
Trade wisley

Gold 1H – Buy the Dip, Watch 3,687 Premium SupplyGold on the 1H timeframe is trading above 3,650 after a clean break of structure. Price has left demand footprints around 3,636 and deeper at 3,594, while resistance stands near 3,670 and premium supply sits at 3,687–3,689. This suggests a possible engineered retracement into discount zones before a push toward liquidity at 3,688+.
________________________________________
📌 Key Structure & Liquidity Zones (1H):
• 🔼 Buy Zone 3,636 – 3,634 (SL 3,630): Fresh demand block, aligned with bullish order flow.
• 🔼 Buy Zone 3,594 – 3,592 (SL 3,587): Deeper discount demand, strong structural base.
• 🔽 Sell Zone 3,687 – 3,689 (SL 3,694): Premium supply zone, potential liquidity sweep.
________________________________________
📊 Trading Ideas (Scenario-Based):
🔺 Buy Setup – Demand Block Reaction
• Entry: 3,636 – 3,634
• Stop Loss: 3,630
• Take Profits:
• TP1: 3,650
• TP2: 3,665
• TP3: 3,680+
👉 Expect retracement into discount demand before resuming bullish move.
🔺 Buy Setup – Deeper Demand Test
• Entry: 3,594 – 3,592
• Stop Loss: 3,587
• Take Profits:
• TP1: 3,610
• TP2: 3,625
• TP3: 3,640+
👉 Ideal for swing buyers looking for higher R:R at deeper liquidity sweep.
🔻 Sell Setup – Premium Rejection
• Entry: 3,687 – 3,689
• Stop Loss: 3,694
• Take Profits:
• TP1: 3,670
• TP2: 3,655
• TP3: 3,640
👉 Short-term liquidity grab at premium levels before rotating lower.
________________________________________
🔑 Strategy Note
Bias remains bullish, but smart money may engineer a sweep into 3,636 or even 3,594 demand before expansion. Cleaner setups are buying dips; sells at 3,687 are only scalp plays with tight risk.
