ANFIBO | I think XAUUSD on 09.10.2025 ???Trend is friend. Gold price today is still holding on the uptrend line and has not broken out yet. Today we only need to pay attention to the following important resistance and support zones:
>> SELL SCALP: 3700 - 3710, SL 3720, TP 3600 - 3570
>> BUY SCALP: 3620 - 3625, SL 3615, TP 3645 - 3700
>>> SWING BUY: 3560 - 3570, SL 3550, TP 3620 - 3675 - 3700 - OPEN
>>> SWING SELL: 3790 - 3801, SL 2820, TP 3700 - 3570 - 3450 - OPEN
Good luck guys!!!
Goldlong

Gold - Buy or Sell this week??? (08-12/09)With the sustained accumulation over the past five months, gold has experienced a strong breakout from the $3,300 sideways range and reached a new all-time high around $3,600. The upward trend is clearly established. Therefore, we can consider buying and selling at the following price levels:
>>> SELL ZONE: 3684 - 3679
SL: 3689
TP: 3618 - 3596 - 3578 - 3565 - 3515
>>> BUY ZONE: 3560 - 3570
SL: 3550
TP: 3618 - 3678
Have a good day. Good luck buddies! :)

Buy Gold @3642.00 best trade of the day🟡 XAUUSD Buy Setup – Precision Scalping Idea
Trade Parameters:
- Entry: Buy @ 3642.00
- Stop Loss: 3638.00
- Take Profit 1: 3650.00
📊 Technical Justification
- Price is rebounding off minor intraday support near 3640, showing bullish momentum.
- Tight SL below recent wick lows minimizes downside exposure.
- TP1 targets a clean resistance zone from previous hourly highs.

3500? No, it’s 3700!
💡Message Strategy
On Tuesday (September 9), international gold prices hit a new high, firmly above the $3,600 mark broken the previous day. Rising expectations of a Federal Reserve rate cut have led to a weakening dollar and lower bond yields, boosting investor demand for precious metals.
Gold prices have risen nearly 39% so far this year, continuing their strength after a 27% jump in 2024. This is primarily supported by a weaker dollar, aggressive central bank purchases, dovish monetary policies, and heightened global uncertainty.
The dollar index fell to a near seven-week low, making gold more attractive to holders of other currencies, while the 10-year U.S. Treasury yield remained near a five-month low.
📊Technical aspects
In the 4-hour chart, the stochastic indicator continues to form a golden cross, which is a bullish signal. The MACD double lines are glued together and the high level is blunt. In terms of form, the market continues to rise. The 4-hour signal shows that the high point of the market has not yet appeared! It is still mainly low-long; the current support level of the sideways market is around 3630.
In the daily K-line, the stochastic indicator continues to retest the golden cross upward, signaling a three-day winning streak. Today's daily K-line is essentially a bullish candle, but the issue lies in the magnitude. Calculated from the 3500-3120 range, the upward movement here is 380 points.
Gold's current trend has been consistent with our expectations, and the signal targets are being met.
💰Strategy Package
Long Position:3625-3635,SL:3600,Target:3680,3700

GOLD: Bulls Continue To Bully Their Way ThroughI'm looking for a dip to buy...
(H4)
Gold has extended higher and is now trading firmly inside the 3630–3645 area.
Structure remains bullish, but price is reaching into premium levels so we could get a pull back.
Buyside liquidity sits around 3650
(H1)
A strong push from 3585 to 3634 left some imbalance behind:
3610–3618 FVG (fresh demand)
3588–3595 (deeper OB if price pulls back more aggressively)
(M15)
Bullish but candles at 3634 are showing some exhaustion.
Liquidity has been swept at 3630–3635, so we may see a correction to fill imbalances before continuation.
As long as price holds above 3610, bulls are still in control.

Can gold continue to rise? Where are the opportunities?Gold prices continued their upward trend yesterday, rising without a pullback. We missed out on this rally. While regretful, I have no regrets. At times like these, we must remain cautious.
The price of gold is now at a record high. Without the previous top position as a reference, it is difficult to judge from where it will pull back, so we would rather do nothing than make mistakes.
Of course, if a good trading opportunity arises, we must seize it.
Looking at the trend range on the 1-hour chart, we are currently trading above the range. Therefore, my advice is not to chase the rally; it's best to wait for a correction and stabilization before entering the market.
3630 is today's low, and 3640 is yesterday's high. Therefore, we can wait for gold prices to retest the 3630-3640 range. If it stabilizes, we can enter the market. Otherwise, if it breaks, we'll look to the 3600 mark.

GOLD– Market Outlook
🔼 Bullish Scenario:
• If the price holds above 3635, the upward momentum is expected to continue.
• Target: 3675 (main resistance level).
• If 3675 breaks, the price may rise further and enter the bullish zone.
🔽 Bearish Scenario:
• If the price stabilizes below the retracement level, a temporary correction may start.
• Target: 3595 (strong support).
• If the price breaks below 3595 and closes under it (especially on the 1h or 4h timeframe):
→ The next bearish target will be 3546.
⚠️ However, if 3595 holds and is not broken, the price will likely bounce and resume the bullish trend.
⸻

XAUUSD: Consolidating the bullish momentumHi everyone, it’s Ken!
At this moment, gold is shining with strong appeal. The market is moving within a steep channel, and price action continues to respect its structure, forming higher highs without showing weakness.
Not long ago, gold broke a key resistance level and might come back to retest it. Interestingly, this area also aligns with the “golden zone” from the last breakout. If buyers defend it well, the bullish outlook remains valid, with the next target aiming toward 3,660 – the channel’s peak.
As long as price stays above the support and the rising trendline, the uptrend remains intact. However, if it slips below, chances of a deeper pullback will rise.
Stay patient, wait for confirmation before entering, and always protect your capital with proper risk management.
Wishing you success!

Gold hits new ATH at $3,657–Bullish momentum eyeing $3,675–3,690🟡 Market Overview
Gold extended its rally and just hit a new all-time high at $3,657/oz. The move is fueled by expectations of a Fed rate cut in September, weaker USD, and lower bond yields. Safe-haven demand remains strong as US labor data signals economic slowdown.
📉 Technical Analysis
• Resistance (near): 3670 – 3675
• Resistance (far): 3690 – 3700
• Support (near): 3640 – 3635
• Support (far): 3615 – 3605
• Price is trading above EMA20 and EMA50 on H1, confirming the bullish momentum. Strong volume at the 3650 breakout zone supports further upside.
📌 Outlook
Main trend: Bullish Gold could extend gains toward 3675 – 3690 as long as it holds above 3640. Short-term pullbacks may occur before continuation.
🎯 Suggested Trading Strategy
• BUY XAU/USD
Entry: 3645 – 3648 (after a pullback holding above 3640)
🎯 TP: 3670 / 3690
🛑 SL: 3630
• Short-term SELL (speculative, small size only)
Entry: 3672 – 3675 (near resistance)
🎯 TP: 3645
🛑 SL: 3678

XAUUSDHello Traders! 👋
What are your thoughts on GOLD?
Following the release of the U.S. Non-Farm Payrolls (NFP) data on Friday, gold surged to the 3600 level before entering a corrective phase from that resistance.
We expect this pullback to extend further, potentially reaching lower support zones in the short term.
If gold finds support and reacts positively, a new bullish wave may begin.
A confirmed breakout above the 3600 level would open the door for a move toward the next key resistance around 3700.
As long as gold holds above the key support area, this bullish scenario remains valid.
Don’t forget to like and share your thoughts in the comments! ❤️

Gold Price Analysis – Bullish Trend Holds Above 3,440Gold is currently respecting its uptrend structure, with the price bouncing strongly from the 3,359 – 3,370 support zone and holding above the black ascending trendline. This shows buyers are actively defending the higher-low structure. Price is now around 3,474, very close to a short-term resistance zone near 3,480 – 3,500. If bulls manage to hold above 3,440 – 3,450, the bullish momentum is expected to continue, potentially pushing price toward the 3,624 extension level, which aligns with the next Fibonacci projection. On the downside, if the price fails to hold the support, it could revisit 3,370 or deeper levels near 3,256 (Fib 0.382).
At this moment, the trend is clearly bullish, as gold is forming higher lows and higher highs while moving along the upward channel.
📊 Key Levels to Watch
- Immediate Resistance: 3,480 – 3,500
- Major Upside Target: 3,624
- Immediate Support: 3,440 – 3,450
- Key Buy Support Zone: 3,359 – 3,370
- Deeper Support (if breakdown): 3,256 – 3,200
Buyers are in control as long as price holds above 3,440 and the ascending trendline.
Buy Zone: 3,445 – 3,454
Buy Trigger: A bounce/rejection from this zone with bullish candles or a confirmed breakout above 3,480 (with strong volume).
Note
Please risk management in trading is a Key so use your money accordingly. If you like the idea then please like and boost. Thank you and Good Luck!

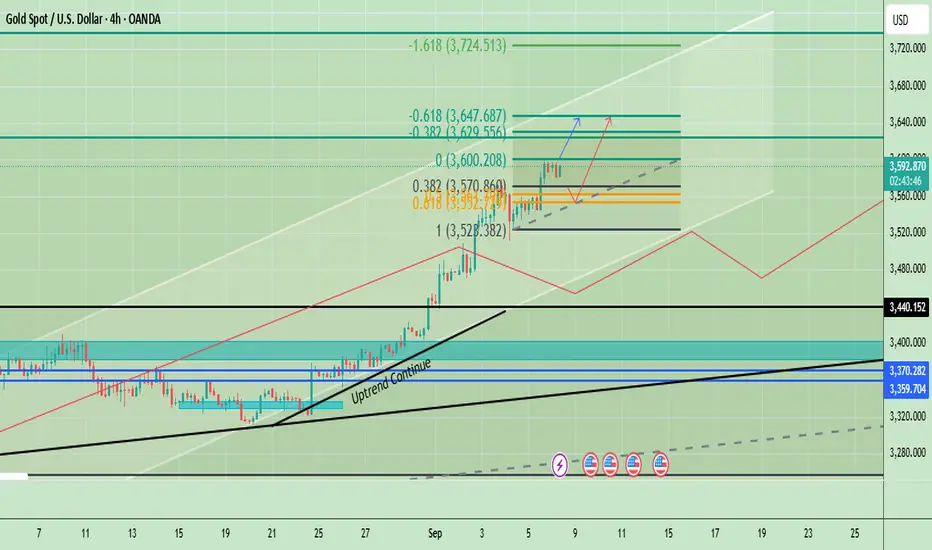
Gold Price Analysis | Fed Rate Cut Hopes & CPI Data in FocusGold is consolidating just below the $3,600 resistance zone, which is a critical pivot. The uptrend structure remains intact, and short-term retracements into the $3,570–$3,552 zone can provide a strong buy opportunity. A decisive break above $3,600 would trigger further bullish momentum toward $3,629, $3,647, and potentially $3,724. On the downside, a daily close below $3,528 would weaken momentum, while a drop under $3,440 would signal trend exhaustion.
Macro fundamentals support this bullish bias: weak U.S. labor data has boosted expectations for Fed rate cuts in September, while the upcoming CPI release on September 11 will be the key event. Softer CPI would confirm easing conditions and strengthen gold’s rally, while a hotter CPI could trigger a short-term pullback into support.
🔑 Key Levels
- Immediate Resistance: $3,600, $3,629 – $3,647
- Support / Buy Zone: $3,570 – $3,552, $3,528 (structural swing low support).
✅ Best Setup:
- Buy Zone: $3,570–$3,552
- Buy Trigger: Bounce from support or breakout above $3,600
- Upside Targets: $3,629 → $3,647 → $3,724
- Invalidation: Below $3,528
Note
Please risk management in trading is a Key so use your money accordingly. If you like the idea then please like and boost. Thank you and Good Luck!
Gold Sellgold is in up trend and has reached to level of resistance as we can gold is having accumilation on this point and possibly could move downwards we can observe this through volume and volume drop is the key here as seller are gaining power and buyer seems not to be intrested in buying more so we can sell it 3579 level of support a possible sell move
Remember its an Up trend

Gold Holds Above $3,620 – Uptrend Strengthens📊 Market Overview:
Gold continues its rally, trading above the $3,600 psychological level, supported by strong safe-haven demand, growing expectations of a Fed rate cut, and ongoing geopolitical risks. Analysts, including Goldman Sachs, have even suggested potential upside toward $5,000/oz if confidence in Fed independence weakens.
📉 Technical Analysis:
- Resistance: $3,630 – $3,640
- Support: $3,600 (key psychological level)
- Indicators: MA, RSI, MACD, and STOCH all show strong bullish momentum, reinforcing the continuation of the uptrend.
📌 Outlook:
Gold remains in a bullish short-term trend. A clear breakout above $3,640 could open the path to $3,650+, while any pullback is likely to find strong buying interest near $3,600.
💡 Trading Strategy:
🔺 BUY XAU/USD near $3,607 – $3,610
🎯 TP: 40/80/200 pips
❌ SL: $3,604
🔻 SELL XAU/USD if price rejects $3,642 – $3,645
🎯 TP: 40/80/200 pips
❌ SL: $3,647

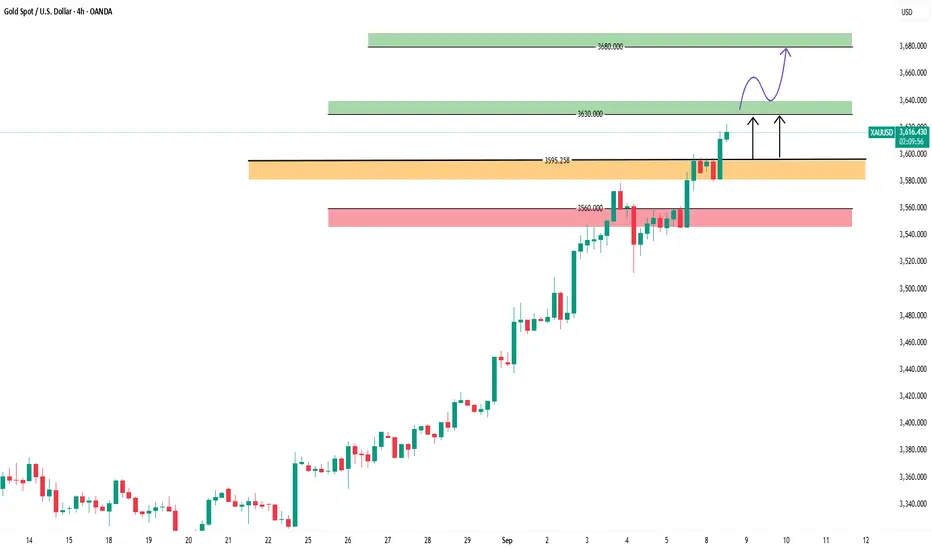
GOLD analysis in time frame 4h
🔹 If price trades above 3595:
• The trend will likely continue upward toward the resistance level at 3630.
• A breakout above 3630 and holding above it (on the 4-hour or 1-hour candle) would confirm a continuation upward toward 3680.
⸻
🔹 If price fails and breaks below 3595:
• The trend will likely move downward toward the support level at 3560.
• This support is strong, but if it is broken, the trend may fully shift into a deeper decline.
⸻
📌 In short:
• Above 3595 → bullish trend (targets 3630 → 3680).
• Below 3595 → bearish trend (targets 3560 → further downside).
Gold (XAU/USD) –> Two Scenarios Hello guys!
Gold has been moving strongly inside an ascending channel on the 1H chart, showing consistent bullish momentum. Price is currently testing a key resistance area around $3,585 – $3,590. From here, one of two scenarios is most likely to play out:
Scenario 1: A short-term pullback toward $3,563 support, followed by a bounce that could fuel another leg higher. target will be near $3,630 – $3,650.
Scenario 2: A short-term pullback toward $3,580 support, pushing price toward the upper channel resistance near $3,630 – $3,650.
Both scenarios remain bullish as long as gold trades above $3,560. Only a clean break below this level would weaken the structure.
Overall, gold is set for further upside; the path depends on whether we see a retest first or an immediate breakout.
Disclaimer: As part of ThinkMarkets’ Influencer Program, I am sponsored to share and publish their charts in my analysis.

Gold can continue to rise if it retraces support levelGold has been hitting new highs recently, primarily driven by expectations of a Federal Reserve rate cut and risk aversion stemming from tariffs and the US economic outlook.
Last Friday, the unexpected NFP data pushed gold prices above the 3,600 mark.
Overall, we still underestimated the upward potential of gold and the impact of multiple data that are bullish for gold.
Because of the surprise of NFP data, the market is now evaluating whether the interest rate cut in September will be 25 basis points or 50 basis points, which will inevitably intensify the bullish sentiment. Therefore, in terms of strategy, we are mainly long, and the pullback support is an opportunity.
Gold re-entered the 3,600 level at the open today, trading around 3,620. Next, we will focus on two key levels: 3,600 and 3,580.
The Fibonacci retracement of the 3,510-3,622 uptrend shows that 3,600 is at 0.786, while 3,580 is at 0.618, both of which represent previous highs and support levels. Therefore, as long as it falls back to these two positions and stabilizes today, you can enter the market and go long on gold.
However, remember one thing, once it falls below 3580, don't go long.
Gold Roadmap | Short termGold ( OANDA:XAUUSD ) created a new All-Time High(ATH) almost every day this week.
How long do you think this upward trend in Gold will continue?
Reasons for Gold's upward trend this week:
Announcement of the US economic indexes.
Geopolitical issues that occurred in the world(China meeting, possible tension between Venezuela and the US, etc.)
Gold is currently moving between the Potential Reversal Zone(PRZ) and the Support zone($3,580-$3,572) .
In terms of Elliott Wave theory , Gold appears to be completing microwave 5 of the main wave 3 .
I expect Gold to start rising again from the Fibonacci levels and touch the Potential Reversal Zone(PRZ) .
Note: If Gold breaks the Support zone($3,580-$3,572) and Support lines, we can expect further declines.
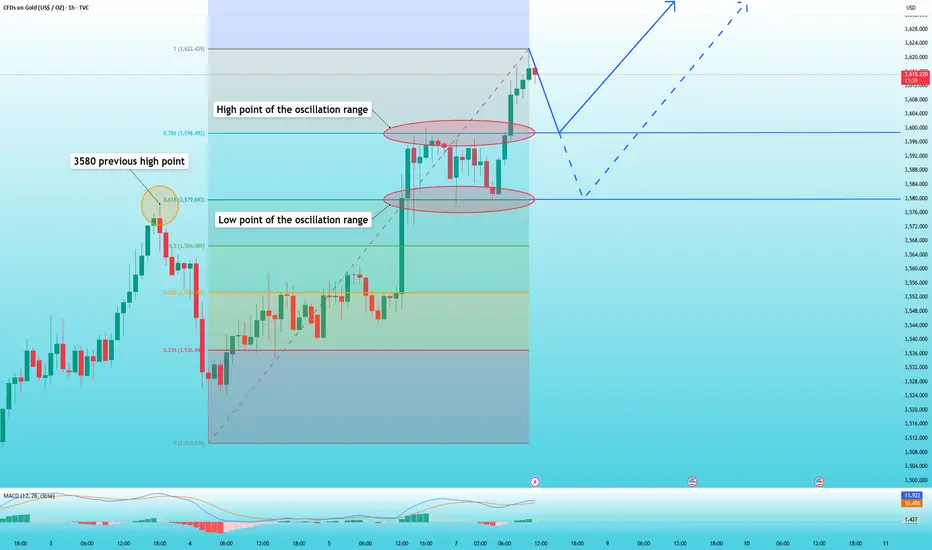
Gold Analyze (XAUUSD), 15-minute time frame.
Be sure to follow the updated ideas.
Do not forget to put a Stop loss for your positions (For every position you want to open).
Please follow your strategy; this is just my idea, and I will gladly see your ideas in this post.
Please do not forget the ✅ ' like ' ✅ button 🙏😊 & Share it with your friends; thanks, and Trade safe.

Gold Price Outlook – Key Levels & Buy TriggerGold (XAUUSD) is holding its bullish structure within the upward channel, currently trading near 3531 after testing key support. The main buy zone lies between 3511–3524, where Fibonacci support and channel trendline align. A confirmed bounce and close above 3537 would trigger fresh buying momentum, targeting 3578, followed by 3619 and 3644. The overall trend remains bullish as long as 3511 holds, while a break below 3470 would weaken the outlook.
🔑 Key Levels to Watch:
- Immediate Support: 3511 – 3524. A strong confluence with the channel support makes this the main buy zone.
- Immediate Resistance: 3537, 3578
- Major Upside Targets: 3619, 3644
Invalidation: 3470 (previous swing low). If broken, the trend may weaken toward 3450.
Buy Zone: 3511 – 3524 (Fibonacci 0.618 & 0.5 retracement + channel support).
Buy Trigger: Bullish rejection or H1 close above 3537 confirming strength for upside continuation.
Note
Please risk management in trading is a Key so use your money accordingly. If you like the idea then please like and boost. Thank you and Good Luck!

Gold Extends Rally as Fed Rate-Cut Bets Intensify📊 Market Overview
• Spot gold is trading around $3,583–3,588/oz, close to its all-time high near $3,600.
• Main driver: Weak U.S. August jobs data boosted expectations for aggressive Fed rate cuts this month.
• A weaker USD and strong central bank purchases continue to support demand.
• Short-term outlook remains bullish, though overbought signals point to possible technical pullbacks.
📉 Technical Analysis
• Key Resistance: $3,600 (psychological), $3,620–3,625 (extended resistance).
• Nearest Support: $3,574 (Fibo 0.236), $3,560–3,580 zone.
• EMA: Price stays above EMA21 → bullish trend intact.
• Candlesticks / Momentum: Bullish flag structure; RSI >80 (overbought), suggesting possible pullback.
📌 Outlook
Gold may continue its upward momentum if Fed signals dovish policy and USD weakens further.
However, a technical correction is likely if profit-taking intensifies around $3,600–3,625.
💡 Suggested Trading Strategy
SELL XAU/USD: $3,622 – $3,625
🎯 TP: 40/80/200 pips
❌ SL: 3628
BUY XAU/USD: $3,577 – $3,580
🎯 TP: 40/80/200 pips
❌ SL: 3574

XAUUSD Overextended: Waiting for Retrace & BoS Before LongsAt the moment, Gold is in a very strong bullish trend 🟢📈, pushing into all-time highs 🏆. However, price is now trading in an area of very thin liquidity 💧⚠️, which carries the risk of a potential pullback 🔻 as smart money 💼 looks to tap into liquidity pools from previous levels to position long.
🔎 In the video, we break down:
Price action 📊
Market structure 🧩
Some Wyckoff concepts 📚
My thoughts on trading when the market is overextended 🚀⚠️
💡 Remember: we don’t want to buy at a premium ❌💰. The better play is to wait for a meaningful pullback ⏳ and a market structure break 🔓 before looking for long opportunities.
⚠️ This analysis is educational and not financial advice. 📚

Gold 1H – Smart Money Plays Below 3,600Gold on the 1H timeframe is consolidating near 3,600 after sweeping short-term liquidity. Price is currently building imbalance around intraday highs, while demand sits lower at 3,565. This structure suggests engineered moves to trap both buyers and sellers before the next expansion.
________________________________________
📌 Key Structure & Liquidity Zones (1H):
• 🔼 Buy Zone 3,565 – 3,563 (SL 3,560): Discount demand block, aligned with bullish order flow.
• 📍 Scalp Sell Zone 3,594 – 3,596 (SL 3,601): Intraday rejection pocket; scalp opportunity.
• 🔽 Sell Zone 3,630 – 3,628 (SL 3,637): Premium supply zone, ideal for liquidity sweep reaction.
________________________________________
📊 Trading Ideas (Scenario-Based):
🔺 Buy Setup – Demand Block Reaction
• Entry: 3,565 – 3,563
• Stop Loss: 3,560
• Take Profits:
o TP1: 3,585
o TP2: 3,595
o TP3: 3,600+
👉 Expect liquidity sweep into discount demand before resuming bullish trend.
🔻 Sell Scalp Setup – Intraday Reaction
• Entry: 3,594 – 3,596
• Stop Loss: 3,601
• Take Profits:
o TP1: 3,592
o TP2: 3,590
o TP3: 3,585 → 3580 → 3570 → 3560
👉 Short-term liquidity pocket; scalp only with strict risk control.
🔻 Sell Setup – Premium Rejection
• Entry: 3,630 – 3,628
• Stop Loss: 3,637
• Take Profits:
o TP1: 3,610
o TP2: 3,600
o TP3: 3,590
👉 Targeting liquidity resting below intraday lows; best for quick shorts.
________________________________________
🔑 Strategy Note
Overall bias remains bullish, but smart money may engineer a sweep of 3,626 supply before driving price back into 3,565 demand. Cleaner setup is to buy dips, while sell scalps remain short-lived opportunities.

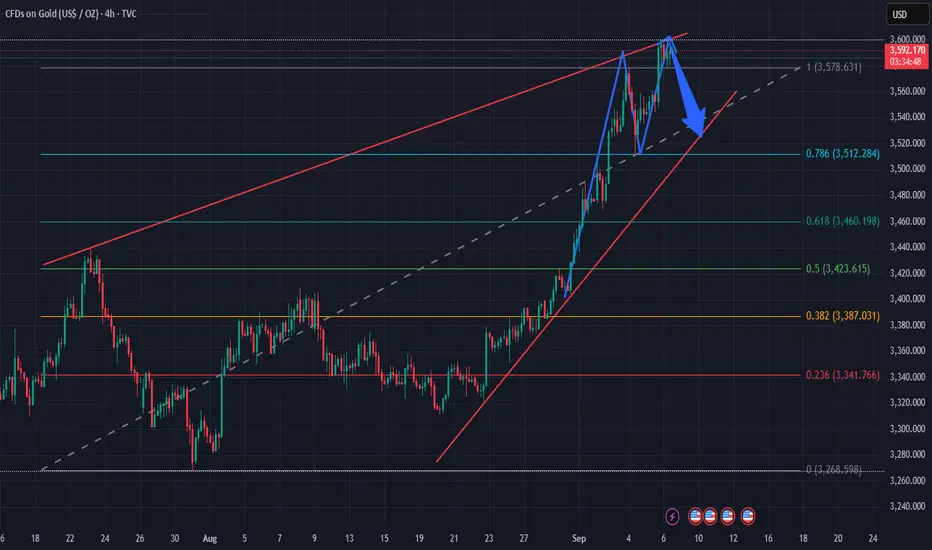
Expect price from 3,590 to correct down to around 3,5201. Price Structure
Previous trend: Gold has been in a strong uptrend since late August, consistently forming higher highs and higher lows.
Currently, price has reached the upper channel resistance (red trendline) and is showing a small double-top pattern, signaling potential weakness.
2. Fibonacci & Support Levels
Fibonacci retracement drawn from 3,268 → 3,590.
Key levels:
0.786 = 3,510 (aligned with lower trendline → strong support).
0.618 = 3,460 → medium-term support.
0.382 = 3,380 → if broken, short-term bullish structure weakens.
3. Patterns & Technical Signals
The chart indicates a blue arrow: expectation of a pullback from 3,590 toward around 3,520 (grey trendline + 0.786 Fibo).
If price holds above 3,510 → potential rebound to continue the uptrend.
If 3,510 breaks → deeper correction likely toward 3,460 – 3,420.
4. Trading Scenarios
Scenario 1 (preferred):
Short-term sell from 3,590 → 3,520.
TP: 3,520 – 3,510, SL above 3,600.
Scenario 2:
If 3,510 – 3,520 holds strong → consider long entries in line with the main trend.
TP: 3,590 → 3,620, SL below 3,490.
👉 Summary: Gold is showing short-term weakness after a sharp rally, likely to correct toward 3,510 – 3,520 before the next move becomes clearer.