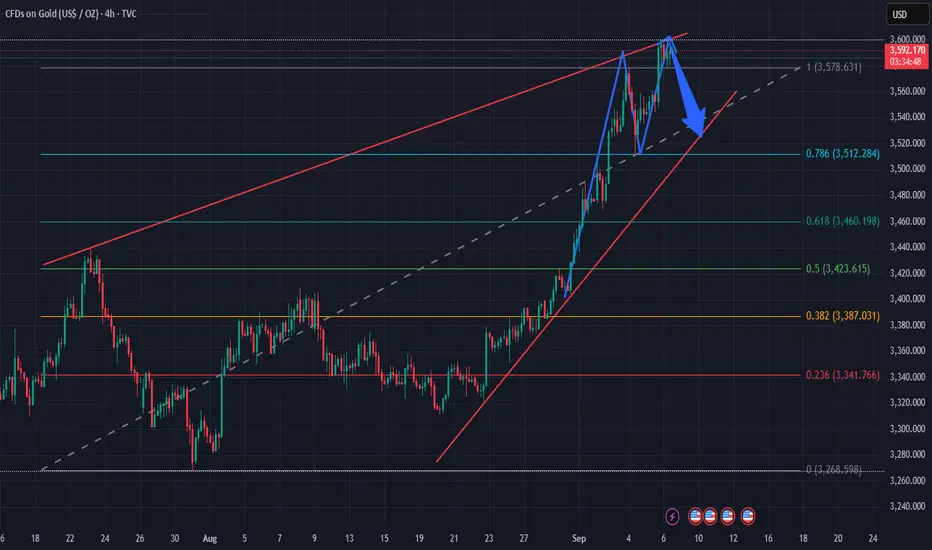
Expect price from 3,590 to correct down to around 3,5201. Price Structure
Previous trend: Gold has been in a strong uptrend since late August, consistently forming higher highs and higher lows.
Currently, price has reached the upper channel resistance (red trendline) and is showing a small double-top pattern, signaling potential weakness.
2. Fibonacci & Support Levels
Fibonacci retracement drawn from 3,268 → 3,590.
Key levels:
0.786 = 3,510 (aligned with lower trendline → strong support).
0.618 = 3,460 → medium-term support.
0.382 = 3,380 → if broken, short-term bullish structure weakens.
3. Patterns & Technical Signals
The chart indicates a blue arrow: expectation of a pullback from 3,590 toward around 3,520 (grey trendline + 0.786 Fibo).
If price holds above 3,510 → potential rebound to continue the uptrend.
If 3,510 breaks → deeper correction likely toward 3,460 – 3,420.
4. Trading Scenarios
Scenario 1 (preferred):
Short-term sell from 3,590 → 3,520.
TP: 3,520 – 3,510, SL above 3,600.
Scenario 2:
If 3,510 – 3,520 holds strong → consider long entries in line with the main trend.
TP: 3,590 → 3,620, SL below 3,490.
👉 Summary: Gold is showing short-term weakness after a sharp rally, likely to correct toward 3,510 – 3,520 before the next move becomes clearer.
Goldlong
Fed rate cut forecasts soarEarlier, a key US jobs report showed hiring slowed while unemployment rose to its highest level since 2021. This development has increased market expectations of an interest rate cut. Lower borrowing costs tend to increase the appeal of gold, which does not pay interest.
The precious metal also received support from strong safe-haven demand amid concerns about the future of the US central bank.
President Donald Trump's increasing criticism of the Fed has raised concerns about the agency's independence. Trump has vowed to win a majority at the central bank soon and lower interest rates. Investors are awaiting a key ruling on whether Trump has the legal basis to remove Fed Governor Lisa Cook.

Gold AnalysisAccording to my technical analysis. Gold Buy Area: 1st 3440. 2nd: 3290 And TP 3750. This is just a market idea. Take entry on your own risk. Thanks

Gold 1H Outlook | Key Levels to Watch – 3595 | 3625 | 3470Gold is trading near 3594 after a strong bullish move. On the 1-hour chart, price has been following a rising trendline which shows that buyers are still active.
Here’s what matters for traders today:
🔹 Key Support Levels:
3560 → intraday support where buyers are stepping in.
3525 → major structural support + trendline confluence.
🔹 Resistance Zones:
3595 → first resistance, market is already reacting here.
3625 → next upside objective if buyers stay in control.
📌 Bias:
As long as price holds above 3525, gold remains bullish. Upside path: 3595 → 3625.
A confirmed break below 3525 would mean a shift in structure. In that case, sellers may push price towards 3470

Gold 1H Outlook | Key Levels to Watch – 3595 | 3625 | 3470OANDA:XAUUSD Gold is trading near 3594 after a strong bullish move. On the 1-hour chart, price has been following a rising trendline which shows that buyers are still active.
Here’s what matters for traders today:
🔹 Key Support Levels:
3560 → intraday support where buyers are stepping in.
3525 → major structural support + trendline confluence.
🔹 Resistance Zones:
3595 → first resistance, market is already reacting here.
3625 → next upside objective if buyers stay in control.
📌 Bias:
As long as price holds above 3525, gold remains bullish. Upside path: 3595 → 3625.
A confirmed break below 3525 would mean a shift in structure. In that case, sellers may push price towards 3470.

Gold🔸As expected, the gold price has continued its upward rally over the past weeks.
🔹It is still possible to re-enter the buy trade for the classic target of 3645 on pullbacks.
🔸The divergence in the RSI indicator can be seen on the 4-hour chart, which can be considered a good place to exit the trade and save profits.
🔹However, as long as the 4-hour candle does not close below 3511, it is possible to take risks for short-term purchases within the specified ranges.

Gold Daily Chart Analysis –> Triangle BreakoutHello guys!
Gold has finally broken out of a large triangle consolidation pattern that has been building for weeks. The price action respected both the top resistance line and the bottom support line multiple times, showing clear compression before the breakout.
🚀 Recently, the price broke above the top line of the triangle, confirming a bullish breakout. This kind of move usually signals the start of a continuation phase with momentum in the direction of the breakout.
Based on the measured move from the triangle formation, the projected target sits around 3,591.60 USD. Price is currently trading near 3,476 USD, which still leaves room for further upside.
💡 Typically, after such a breakout, the market may retest the broken resistance line (now turned support) before resuming its move higher. (but the pullback is not certain now)
Summary:
Pattern: Symmetrical Triangle
Breakout Direction: Bullish
Current Price: 3,476 USD
Target: 3,591.60 USD
As long as Gold holds above the broken triangle resistance, the bias remains bullish toward the projected target.
Disclaimer: As part of ThinkMarkets’ Influencer Program, I am sponsored to share and publish their charts in my analysis.
**"Gold Price Rebounding from Support:Potential Move Toward 3436This chart shows the **price movement of Gold (XAU/USD)** on a **daily timeframe**.
### Key Points:
* **Support Zone** : Around **\$3,266**, this is the area where price has bounced up multiple times, meaning buyers step in here.
* **Resistance Line**: Around **\$3,436**, this is the level where price has been rejected before, meaning sellers are strong here.
* **Current Price**: Around **\$3,293**.
### What the Chart Suggests:
* Price is near the **support** zone again.
* If the support holds, the green arrow shows a possible move **upward**.
* Price may first move up slightly, pull back, and then try to **break above resistance** at \$3,436.
Gold is in a sideways range. It's near a strong support level and might go up from here toward the resistance level, as shown by the green line.

Gold Retreats After $3597 ATH🔎Gold Outlook (Post-NFP)
• Main Trend: Gold remains in a strong uptrend, supported by weak NFP data → weaker USD → almost certain Fed rate cut in September.
• Short-term Support: $3,573 (tested and bounced 1–2 times). If broken, the next supports are at $3,560 and deeper at $3,545.
• Near-term Resistance: $3,590 – $3,600 (ATH). A breakout here could target $3,620–$3,630.
• EMA & Momentum: Price is still above the EMA9 & EMA21 on H1/H4, indicating the bullish trend remains intact, though momentum has slowed after hitting ATH.
• Market Sentiment: After a sharp rally, the market is pausing for consolidation — a healthy sign in a broader uptrend.
📌 Conclusion : In the short term, gold may consolidate between $3,573–$3,590 before choosing direction. Holding above $3,573 increases the chance of retesting $3,600 and higher. A break below $3,573 could trigger a deeper pullback toward $3,560–$3,545.

Gold Targets $3,600 After Strong BreakoutAnalysis:
Gold (XAU/USD) continues its bullish rally after breaking above the buy zone near $3,440 and holding strong momentum. The market has recently made higher highs, with price consolidating slightly below the resistance zone.
Currently, gold is trading at $3,548, with the short-term target identified at $3,600. The chart suggests potential consolidation in the highlighted area before another upward push. The SMA (9) at $3,552 is acting as dynamic support, keeping the bullish bias intact.
If buyers maintain control, a clear breakout above $3,552 – $3,560 could confirm a move toward $3,600 – $3,604. However, if momentum weakens, support lies at $3,511 and $3,499, with a deeper pullback possible toward the $3,440 buy zone.
Overall, the sentiment remains bullish, and gold looks positioned to test the $3,600 psychological resistance in the near term.

XAUUSD more bullishYesterday on Friday, we hade bad NFP data, which is too good for gold. In September we are also heading to see interest rate cut. Better to look buy setups on Gold.

XAUUSDHello Traders! 👋
What are your thoughts on XAUUSD?
Gold has been moving within a medium-term ascending channel and recently managed to break above a major resistance area that had previously rejected price multiple times.
Currently, the price is facing a psychological and technical barrier at the $3500 level, acting as the next resistance.
Price is expected to consolidate slightly below $3500 before attempting another push higher.
As long as price holds above the broken resistance and stays within the ascending channel, the bullish outlook remains valid.
A successful breakout above $3500 could open the path toward targets at $3600 – $3700-$3900 in the medium term.
Don’t forget to like and share your thoughts in the comments! ❤️

Gold. Expect entry into the fifth waveThe current decline looks like the 4th wave
Before it, 3 in 3 is visible
There is an alternative probability of the marking, that the marking will lengthen and we will get a stronger upward impulse.
But in both scenarios there is another increase in quotes with a target of 3600-3650
In general, the growth of gold is due to a reduction in central bank investments from American treasuries.
Just today we described how investments of India and other non-Western countries in American debt are decreasing.
All this spurred the growth of gold quotes

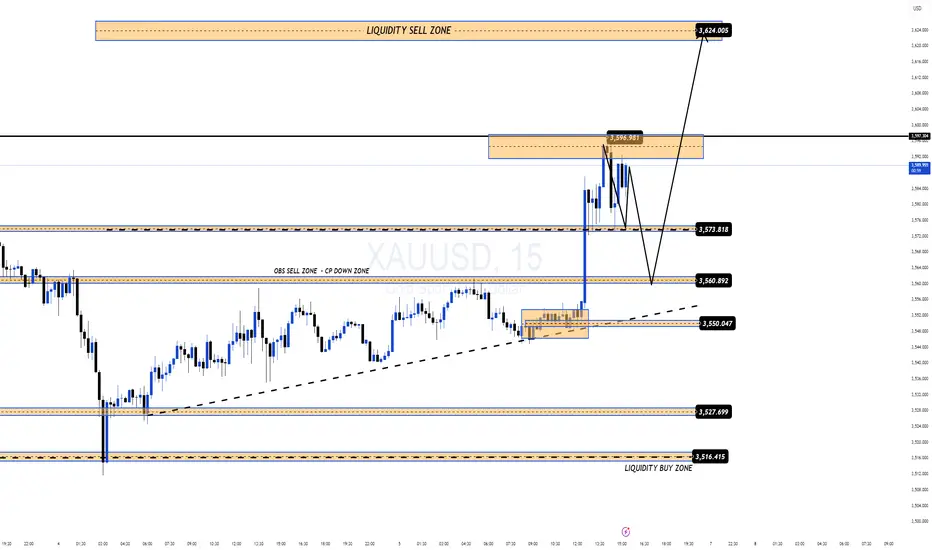
XAUUSD – Post-NFP Big Win & Key Levels to Watch | MMFLOW TRADINGNonfarm Payrolls pushed gold (XAUUSD) to a new ATH near $3600/oz. After reacting sharply at the 3593–3595 liquidity sell zone, price dropped more than 200 pips before bouncing back quickly to retest the previous ATH and climbing again towards 359x, showing strong bullish momentum still in play.
Short-Term Outlook (US Session Close):
Upside momentum remains dominant, but the market now stands at two critical key levels that will define the next move.
Key Levels:
Bullish trigger: 3592 → A clean breakout above this zone could fuel further upside towards the next liquidity area around 362x.
Bearish trigger: 3575 → A break below this level may open a deeper pullback to fill the Nonfarm liquidity gap around 3550–3527.
Trading Plan:
BUY bias: Hold above 3592 → look for longs targeting 3610–362x.
SELL scalp: Break below 3575 → shorts towards 3550–3527.
Always apply strict risk management (SL just beyond the nearest key level).
Summary:
✅ After a 200+ pips BIGWIN on Nonfarm, gold retains strong momentum.
👉 Watch the 3592 & 3575 zones closely – they are the decision points for the next major move.
Follow MMFLOW TRADING for timely updates and trade setups!
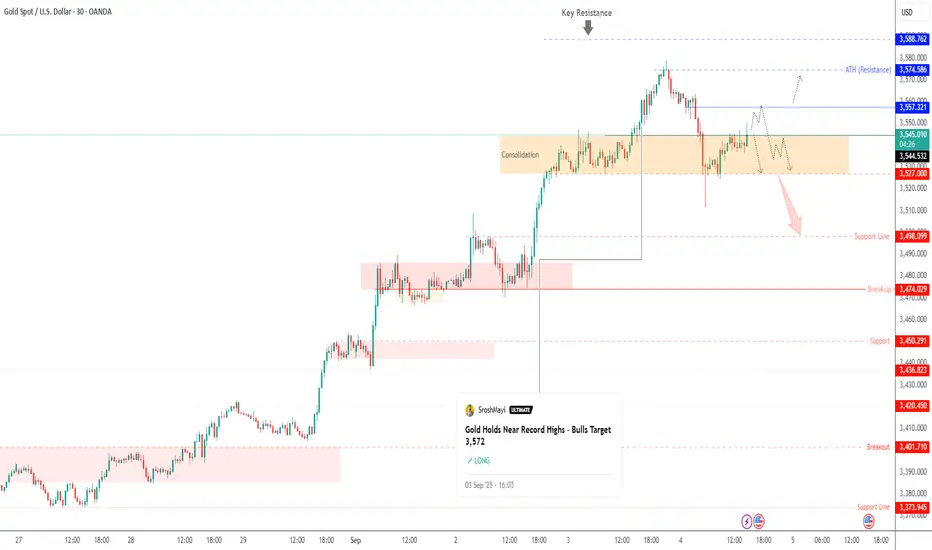
Gold Awaits ISM & ADP Data – Pivot at 3,544 in FocusGold – Overview
Gold’s record-breaking rally saw profit-taking, with traders now awaiting direction from today’s ISM and ADP data, which are expected to drive volatility.
Technical Outlook:
📉 Bearish scenario: While trading below the pivot at 3,544, price may drop to 3,527. A confirmed 15M close below 3,527 would extend the move toward 3,512 → 3,498.
📈 Bullish scenario: Stabilization above 3,545 would support a corrective move toward 3,557. A confirmed 30M/1H close above 3,557 would accelerate bullish momentum toward 3,574 → 3,588.
Key Levels:
Pivot: 3,544
Support: 3,527 – 3,512 – 3,498
Resistance: 3,557 – 3,574 – 3,588
Bias: Bearish while below 3,544; bullish correction begins above 3,545 with momentum strengthening on a breakout above 3,557.
NFP numbers came in softer than expectedlooks like the weak NFP numbers came in softer than expected, and gold (XAU/USD) reacted bullishly just as anticipated.
Dollar weakness on the back of the softer labor data boosted demand for gold.
Gold surged above resistance at $3,578, confirming the breakout scenario we mapped.
Market sentiment now favors a continuation toward the $3,600+ zone, unless profit-taking slows momentum.
Gold Holds Bullish Momentum – Key Watch at $3,565 and $3,578📊 Market Overview
Gold remains steady around $3,555–3,565/oz, close to record highs. The rally is supported by expectations of upcoming Fed rate cuts, a weaker USD, and strong central bank demand. In addition, geopolitical tensions continue to sustain safe-haven flows, keeping gold well-supported.
📉 Technical Analysis
• Resistance levels:
o $3,562–3,565 → minor intraday resistance.
o $3,572–3,578 → major resistance, close to ATH.
o $3,585 → extended resistance; a breakout here could trigger further upside.
• Support levels:
o $3,548–3,550 → immediate support zone.
o $3,540–3,542 → key short-term support.
o $3,530 → deeper support, below EMA9 H1.
• EMA: Price is trading above EMA9 on H1, confirming a short-term bullish trend.
• Patterns / Momentum: H1 candles continue forming higher lows, showing steady buying pressure. RSI hovers near 61, leaving room for further upside.
📌 Outlook
Gold is expected to remain bullish in the short term as long as it holds above $3,550. However, profit-taking pressure could emerge near $3,565–3,578, potentially leading to temporary pullbacks before resuming the uptrend.
Suggested Trading Strategy
🔻 SELL XAU/USD at: $3,565–3,562
🎯 TP: 40/80/200 pips
❌ SL: $3,568
🔺 BUY XAU/USD at: $3,548–3,545
🎯 TP: 40/80/200 pips
❌ SL: $3,542

XAUUSD Ready for a slight Pullback ?XAUUSD Still way Bullish on every time frame. This could do a little pull back on H4 and D1 Analysis. What are your thoughts ? Check your support and resistances and open positions accordingly. Wait for Price Again and strong solid breakouts to enter the market.
Disclaimer:
The content presented in this IMAGE is intended solely for educational and informational purposes. It does not constitute financial, investment, or trading advice.
Trading foreign exchange (Forex) on margin involves a high level of risk and may not be suitable for all investors. The use of leverage can work both for and against you. Before deciding to participate in the Forex market, you should carefully consider your investment objectives, level of experience, and risk tolerance.
There is a possibility that you may incur a loss of some or all of your initial investment, and therefore, you should not invest money that you cannot afford to lose. Be fully aware of all the risks associated with foreign exchange trading, and seek advice from a licensed and independent financial advisor if you have any doubts.
Past performance is not indicative of future results. Always trade responsibly.

Sell on breakdown below 3,510, targeting 3,460 – 3,423.GOLD Chart Analysis (H4 timeframe)
Price is in a strong uptrend, forming higher highs and higher lows. Currently, it has reached the resistance zone around 3,575 – 3,580 and is showing signs of correction. The chart shows an ascending channel (two red trendlines). Price is forming a Rising Wedge, which often signals a potential reversal. The blue arrows indicate a possible pullback scenario: price may retest the lower trendline. Fibonacci levels are drawn from the recent low to the 3,578 high: 0.786 ~ 3,512 (price is testing this level now), 0.618 ~ 3,460 (strong support if price breaks lower), 0.5 ~ 3,423 (key balance zone), and 0.382 ~ 3,387 (lower support). If the price breaks below the current trendline support (around 3,510 – 3,520), it may correct deeper toward 3,460 or even 3,423.
Scenario 1 (Bullish continuation): If price holds above 3,510 – 3,520 trendline → bounce back toward 3,575 – 3,580, possibly breaking higher. Scenario 2 (Deeper correction): If price falls below 3,510 → potential drop toward 3,460 and then 3,423 (Fibo 0.5).
The Rising Wedge pattern typically favors a downside breakout, so risk management is important. The 3,575 – 3,580 zone is a strong short-term resistance. Possible setups: Short-term Buy around 3,510 – 3,520 with stop-loss below 3,500, or Sell on breakdown below 3,510, targeting 3,460 – 3,423.
👉 Summary: Gold is at the end of a strong bullish leg and stalling near heavy resistance. Watch the 3,510 – 3,520 support closely. A breakdown could trigger a correction toward 3,460 – 3,423.

Pullback or trend reversal? One article gives you the answerGold fell nearly $60 in the Asian session, providing an opportunity for a pullback. It rebounded after touching the previous top and bottom conversion position of 3520-3500. The current stage is a process of gold correction, with intraday fluctuations as the main feature. A major trend change may occur after the release of NFP data tomorrow.
Although there is a downward correction at present, the bullish momentum is still there and it has not effectively fallen below the previous top and bottom conversion positions. Both bulls and bears have opportunities in the short term. In the short term, focus on 3550-3560. If it fails to rebound effectively and stabilize above, it will continue to fluctuate today. Friends who execute long trades based on yesterday’s trading strategy can consider exiting the market near 3550-3560.
The focus today is on the release of ADP data, which will provide a certain reference direction for the possible trend of NFP data tomorrow.

XAUUSD Long- Fri, Sep 5, 2025I did open a long position on Gold yesterday hoping to get close to the ATH. Luckily it did and gave me a 1:4 rr. I guess this is it for gold so far and it is going to drop a bit for the foreseeable future.
what do you think??
-Moz
#XAUUSD #long #ATH

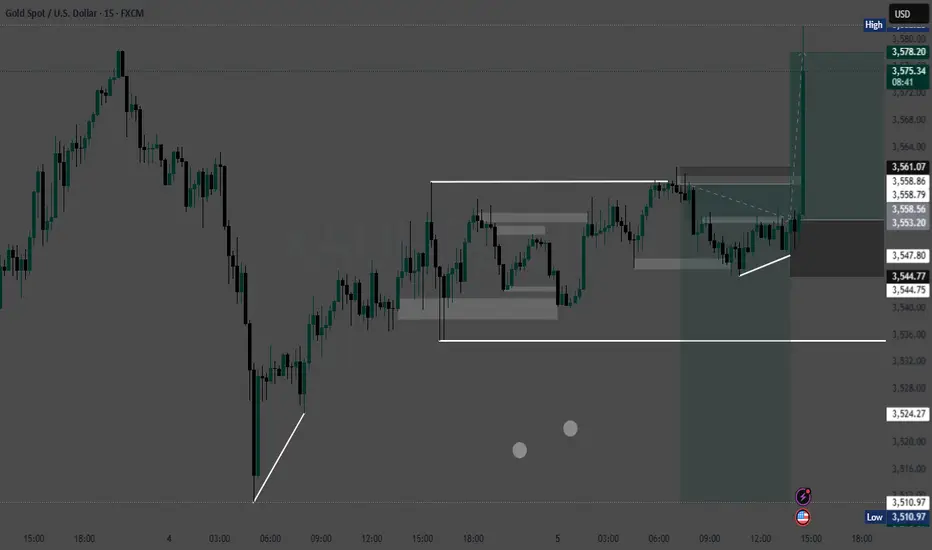
XAU/USD BUY NOW Got it 👍 Let’s break this chart down quickly:
Pair: Gold Spot (XAU/USD) – 15m timeframe
Downtrend Breakout:
– A descending trendline (red) was respected several times.
– Price has just broken above it, signaling possible trend reversal.
Entry Zone:
– Current entry is around 3550–3552 (marked with green).
– Stop-loss placed near 3535 (red zone).
Target Zone:
– Projection suggests upside move towards 3578–3580.
– Risk/reward looks around 1:2.
Momentum:
– Strong bullish candles after breakout indicate buyers stepping in.
– Needs follow-through volume to sustain rally.
📌 Conclusion: Short-term bullish bias. If price holds above 3550, it could push towards 3578+. A drop back below 3535 invalidates the setup.
Do you want me to rewr

Gold Trade Set Up Sep 4 2025OANDA:XAUUSD
www.tradingview.com
Price is making HH/HL, swept PDL, closed above it and also swept SSL on the 15m so as long as we stay closed above i will look for buys back to PDH
