XAU/USD – Wedge Compression Signaling Potential Bullish BreakoutXAU/USD – Wedge Compression Signaling Potential Bullish Breakout
Description:
Gold (XAU/USD) has been consolidating after a sharp decline from the $4,280–$4,300 resistance area, which formed a clear double-top reversal pattern — signaling short-term bearish pressure. Following this correction, the market has now developed a descending wedge formation, typically seen as a bullish reversal structure when accompanied by volume buildup and repeated support rejections.
Currently, the price is trading around the $4,010–$4,020 zone, sitting just above dynamic trendline support. A break and close above the $4,030–$4,100 supply area (highlighted in purple) would confirm a shift in market structure, potentially opening the way for a bullish leg toward $4,200 and beyond. Traders should watch for a breakout retest scenario, as a pullback to $3,960 could provide an ideal (demand re-entry zone) for continuation buyers.
On the downside, a failure to defend the $3,960 support level may expose the market to deeper liquidity sweeps near $3,886, where larger buyers could step in again to fuel a stronger upside move.
From a broader perspective, this price action reflects (accumulation behavior) following aggressive distribution earlier in the month. Momentum divergence and narrowing volatility hint that bulls are preparing for control — aligning with possible risk-off sentiment in global markets that typically benefits gold.
Bias: Bullish above $3,960 | Targets: $4,100 – $4,200 | Invalidated below: $3,886
Technical Outlook: Wedge Compression | Breakout Anticipation | Structure Shift Confirmation Pending
Goldlong

GOLD | Daily Analysis #3 - 3 November 2025Hello and Welcome Back to DP,
Reviews and News Coverage:
Last week chart represented major moves and volatility. In this Week we should expect following economic calendar events :
- Monday, Nov 3: ISM Manufacturing PMI
- Wednesday, Nov 5: ADP Non-Farm Employment Change AND ISM Services PMI
- Friday, Nov 7 (Tentative): Unemployment Rate & Average Hourly Earnings
Political Angle:
The ongoing U.S. government shutdown negotiations and fiscal uncertainty may increase safe-haven demand for gold. Any escalation or delay in funding could trigger a risk-off tone and push XAU/USD higher.
1H Technical Analysis:
Gold has broken its major downtrend line, signaling a potential shift from bearish to bullish bias on the intraday time frame. The price is currently trading around $4,016, consolidating just below a short-term resistance zone.
Immediate Resistance: $4,024, So a breakout here could open the door toward $4,046, then $4,083.
The next stop if pass 4024, aligns with markup.
Immediate Support: $3,998 → $3,970 zone.
If this support breaks, the next downside target is $3,947 – $3,915 region.
Momentum remains cautiously bullish after breaking the descending trendline.
The structure of higher lows indicates accumulation, but the $4,024–$4,046 resistance area must be cleared with strong candle closes to confirm continuation.
If gold rejects from $4,024 again, expect a retest of the trendline support near $3,970–$3,950.
Trading Plan Ideas:
Bullish bias above $4,024 → potential upside toward $4,046 → $4,083.
Bearish correction if price breaks below $3,998 → next supports $3,970 → $3,947 → $3,915.
Watch for volume confirmation at $4,024 or $3,970 before entry.
Disclaimer:
This content is for informational purposes only and does not constitute financial or investment advice. © DIBAPRISM
Amir D.Kohn

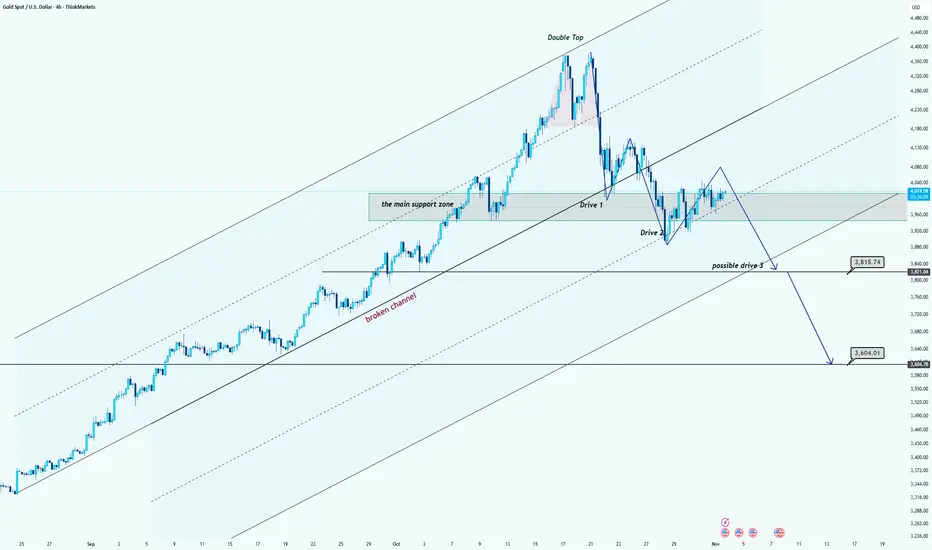
Gold Forming Bearish Three Drives Pattern Below Channel MidlineHi team!
Gold has formed a double top near the upper boundary of a long-term ascending channel, signaling potential exhaustion of the bullish momentum. After breaking below the local support and retesting it, price created a lower high, which confirms a short-term bearish structure.
Currently, the market is consolidating below the midline of the new channel. The recent sequence of moves is forming a potential Three Drives pattern, where Drive 1 and Drive 2 are already complete, and a possible Drive 3 could be developing.
If price fails to reclaim the main support zone around $4,000–$4,050, we can expect a continuation to the downside toward:
$3,815 – the first key support level and measured target for Drive 3.
$3,604 – the next major support zone and lower boundary of the broader channel.
As long as price remains below the recent swing highs, the bearish scenario remains valid. A clear break above the midline of the channel would invalidate this setup and suggest a potential reversal.
Disclaimer: As part of ThinkMarkets’ Influencer Program, I am sponsored to share and publish their charts in my analysis.
SELL XAUUSD (GOLD) - the bearish trend begins!GOLD (XAUUSD) has been struggling to stay bullish in the last recent weeks and has completely reversed. GOLD was in a clear uptrend but eventually broke a powerful trendline which acted as support for several weeks. Gold also tried to test resistance to the upside but struggled to break through it. Time to sell and take profit at the next major support zone!

Golds overperformance relative to the Dow will be dramatic !!The place to invest during the following decade is gold!!
The Dow Jones is projected to lose 96% relative to gold from now until August 2036!! (if history repeats itself as it did in 1968-1980).
In 12 years time, the DOW to GOLD ratio is expected to reach 0.44.
By 2026, we will be able to sell our gold by buying the Dow with less than half an ounce of gold (currently, it takes 12 ounces of gold to buy the Dow).
We're talking about a 24x outperformance!!
DO NOT ignore the historic break down in the stock market relative to gold which is happening right now !! For those who think that the gold bull is over: it is just about to start !!
This is a ratio graph, so don't get me wrong: the DOW could still hit 100'000 USD but that would imply that Gold would rise above 100'000 USD an ounce !

1:10RR GOLD BUY SETUP FOR THE WEEKWe are looking for a bullish setup for the week. Price has broke shifted structure to the upside so will be only looking for buys this week. On our chart we have a breaker block which also confluences with our 61.8% Fibonacci. That's where we will be looking to take our trade.
ENTRY:3982
TP:4053
SL:3974

Gold holds above $4000 — waiting for breakout confirmation🟠 Market Overview
Gold (XAU/USD) is trading around $4012, moving in a narrow range between $4000 – $4020.
Buying pressure remains firm near the psychological support at $4000, while sellers are defending the $4025–$4030 resistance zone.
The market is in a neutral consolidation phase, waiting for direction before the U.S. session tonight.
📊 Technical Analysis
• Near-term support: $4000 – $4003
• Near-term resistance: $4025 – $4028
• EMA50 (H1): currently around $4008 — acting as dynamic support.
• RSI (H1): near 48 — neutral, suitable for two-way scalping setups.
🔎 Outlook
Gold is “compressing” around $4010.
Main scenario: if the price holds above $4000 and confirms a bullish H1 candle, the upward trend could resume toward $4035–$4050.
Conversely, if the price closes below $3998, a pullback to $3985 becomes likely.
→ Prefer BUY setups on support reactions, and SELL setups only on strong rejection near resistance.
🎯 TRADE STRATEGY
🔺 BUY XAU/USD : $3987 – $3984
🎯 TP: 40 / 80 / 200 pips
🛑 SL: $3980
________________________________________
🔻 SELL XAU/USD : $4026 – $4029
🎯 TP: 40 / 80 / 200 pips
🛑 SL: $4033

Latest gold price trend analysis today!Market News:
On Monday (November 3rd) in early Asian trading, gold prices in London were pressured by the dollar index hitting a near three-month high, as hawkish comments from several Federal Reserve officials on Friday reduced the probability of a December rate cut. However, market sentiment remained cautious, as the near-historic US government shutdown and ongoing geopolitical instability continued to support gold prices. International gold prices rose 3.7% in October, marking the third consecutive month of gains. A 53% increase year-to-date further demonstrates the resilience of international gold. It should be noted that North America officially adopted daylight saving time on Sunday (November 2nd). Trading hours for major financial instruments in the US and Canadian financial markets, such as gold, silver, crude oil, and US stocks, as well as the release times of important economic data, will generally be one hour later than during daylight saving time. For traders, remaining on the sidelines in the short term and selectively positioning for positions in the $3800-$4000 range may be the most prudent choice. In the long term, however, the strategic allocation value of gold remains unshaken due to currency depreciation, geopolitical cycles, and central bank gold purchase cycles. This week, attention should be paid to news related to the US government shutdown and speeches by Federal Reserve officials. Additionally, data such as the ISM Manufacturing PMI, ADP employment, the Bank of England's decision, and the Michigan Consumer Sentiment Index should be monitored.
Technical Analysis:
Gold is expected to continue its wide-range consolidation. The monthly chart shows a long upper shadow bullish candlestick, with the price closing near the upper Bollinger Band. The weekly chart shows a bearish candlestick, with the gap down at 4113 still unfilled. The price has retreated to the 10-day moving average support at 3890. The RSI indicator, after a prolonged period of overbought conditions, has turned downwards and is trading below 70. On the daily chart, the 10-day and 7-day moving averages continue to widen downwards to 4028/4000, and the RSI indicator is consolidating around the 50 level. The Bollinger Bands on the short-term 4-hour and hourly charts are narrowing, and the RSI indicator is showing weak consolidation near the lower band. Technically, gold's weak consolidation is likely to continue. However, looking at the longer-term uptrend line, gold is currently still within an upward channel, with key support around $3900. As long as this level is not decisively broken, the long-term uptrend for gold is expected to continue.
Gold Intraday Trading Strategy:
Buy gold at 3930-3935, stop loss at 3920, target 3980-4000;
Sell gold at 4005-4010, stop loss at 4020, target 3950-3920;
Key Levels:
First Support: 3963, Second Support: 3950, Third Support: 3930
First Resistance: 4007, Second Resistance: 4020, Third Resistance: 4038

XAUUSD Acceptance Rule at 4 000 - Map for 3-7 Nov 2025Context, in plain language
Gold finished Friday near 3 998.4 on my feed and sits right on the round 4 000 pivot. October was a runaway month with fresh records. In the final week of this rally phase the market will test whether price can live above four thousand or if it needs another breath. The plan below keeps things simple. I work from one decision line, a short event ladder, and a fixed risk template. Education only.
Why four thousand matters
Round numbers concentrate liquidity. They create noise on the first touch then clarity on the second. At four thousand you will see stop runs in both directions and you will see fast fades. The edge comes from trading acceptance rather than touch. Acceptance for me means two closes on the execution timeframe above or below the line. I use four hour for structure and fifteen minute for triggers. If you prefer one hour or five minute, keep the logic exactly the same and do not chase the first spike.
What can move price this week
It is a data led week. Monday brings ISM Manufacturing. Tuesday brings JOLTS. Wednesday brings ADP in the early morning and ISM Services late morning. Friday is the Employment Situation. The Federal Reserve cut the policy rate last week and said future steps depend on incoming data, so these releases are live for gold. I treat Monday as tone setting, Wednesday as positioning, and Friday as the weekly verdict. Times are Eastern. If you trade from Europe, align your session planning the night before.
Levels to work with if Friday’s close is your anchor
Immediate map
• 4 000 is the decision line.
• 4 050 to 4 060 is the first upside gate from the early October stall area.
• 4 100 opens if services data or jobs come in soft and real yields ease.
• 3 950 to 3 920 is first support on pullbacks where late sellers often get trapped.
• 3 880 to 3 800 is the larger retest zone from the September breakout.
I draw one bold line at 4 000. I shade two narrow boxes at 4 050 to 4 060 and 3 950 to 3 920. I leave the wider retest box lighter at 3 880 to 3 800. No extra overlays. No spaghetti. The clarity helps when the tape speeds up.
How I will trade it
Before New York I check two things. The dollar index trend. The ten year real yield tone. If both rise together I will be patient with longs and I will only buy strength that proves acceptance over four thousand with time. If both slip together I will allow a second test long that holds above four thousand and I will target the first gate at 4 050 to 4 060. If the event hits and the first move rips through four thousand I do nothing. I wait for the pause. The second test is the trade.
Triggers
Long idea
• Event passes and the second test holds above 4 000 with two closes on fifteen minute.
• Dollar fails to make a higher high on the hour.
• Target 4 050 to 4 060 first, then trail toward 4 100 only if the day opens up.
• Invalidation below 3 980 on a five minute close or a clear failure back inside the pre release range.
Short idea
• Clean rejection of 4 000 after the event.
• Dollar and real yields bid together.
• Target 3 950 to 3 920 first. Leave room for 3 880 only if the day does not bounce.
• Invalidation above 4 020 on a five minute close.
Risk template
I size so that a normal day’s pullback does not force me out. A simple rule is to keep per trade risk inside one third of the five day ATR. I place stops beyond the opposite edge of the zone I am trading. I never move a stop closer because the candle looks scary. I take partials into the first gate only when the day’s range is already near the expected move for that session. If spreads widen during the release I stand aside for five minutes. This alone will save you from many avoidable losses.
Common traps to avoid
Do not trade the first touch at four thousand. The tape loves to run stops there. Do not fade a break that holds for thirty minutes above the decision line. The whole edge is acceptance. Do not add size in front of Friday’s Employment Situation. This report resets everything. Finally do not forget that gold can gap through levels on macro surprises. The way to survive that is small size, predefined exits, and a plan to do nothing if liquidity is thin.
Event ladder for the week
Monday. ISM Manufacturing sets the opening tone.
Tuesday. JOLTS shapes labor cooling views.
Wednesday. ADP and ISM Services drive pre positioning into Friday.
Friday. Employment Situation at the open. I go reactive only after the first five minutes settle.
How to set up your chart
Timeframe four hour for structure. Timeframe fifteen minute for triggers. Draw a single line at 4 000. Shade the two narrow zones at 4 050 to 4 060 and 3 950 to 3 920. Add a lighter box at 3 880 to 3 800. Nothing else. If you must watch the dollar, keep it on a separate chart. The goal is to make the decision obvious when the release hits.
Three rule bullets that define the model
• Trade acceptance, not touch, at 4 000. Wait for two closes to confirm.
• Use the event ladder to scale risk. Light early. Normal only after the day’s release.
• Place invalidation beyond the opposite band of the zone you are trading.
Education and analytics only. No investment advice.

Gold (XAUUSD) TRADING SETUP FOR NEXT WEEKGold (XAUUSD) is consolidating near $4,000 after a record rally, with key U.S. data and Fed commentary expected to drive the next breakout or breakdown in the coming week.
---
🟡 TradingView Idea: Gold Spot – Calm Before the Catalyst?
Timeframe: 4H
Current Price: $4,003.15
Bias: Neutral-to-Bullish
Pattern: Ascending Channel
Indicators Used: Price Action, Volume, Trendlines
---
📌 Market Context
Gold has cooled off after touching all-time highs, now hovering near the upper boundary of a rising channel. The recent candles show indecision, with lower volume and tight price action—classic signs of consolidation. Traders are waiting for macro triggers before committing to the next move.
---
🔍 Technical Highlights
- Channel Resistance: Price is testing the upper trendline (~$4,015–$4,020). A breakout could target $4,100+.
- Volume Tapering: Declining volume suggests reduced conviction, often preceding a sharp move.
- Candlestick Structure: Wicks on both sides indicate tug-of-war between bulls and bears.
---
🗓️ Upcoming Events (Nov 4–9, 2025)
These could be the catalysts that break gold out of its range:
- Nov 5 – U.S. CPI Data: A key inflation report that could influence Fed rate expectations.
- Nov 6 – Fed Officials’ Speeches: Traders will watch for clues on rate cuts or policy shifts.
- Geopolitical Watch: Easing U.S.–China tensions and Middle East developments may reduce safe-haven demand.
- U.S. Funding Bill Talks: Any gridlock or uncertainty could reignite gold buying.
---
🎯 Trade Setup
- Bullish Scenario: Buy breakout above $4,020 with confirmation (volume + candle close).
Target: $4,100–$4,150
Stop Loss: $3,980
- Bearish Scenario: Short rejection near $4,020.
Target: $3,950–$3,920
Stop Loss: $4,030
---
💬 Drop your thoughts below—are you positioning for the breakout or fading the resistance?

Gold Next Target $50003 Nov 2025, Kuala Lumpur Malaysia - Why I Think Gold can Reach $5000/oz
Executive Summary
Macro tailwinds: The Federal Reserve has shifted dovish by cutting rates and pausing balance-sheet reduction, which lowers the opportunity cost of holding gold.
Institutional & central bank demand: Central banks remain meaningful net buyers ETFs and institutional flows are turning positive again.
Structural supply constraints: Mining grades are declining, capex rises, and new supply is sluggish making supply less responsive to price.
Market sentiment & risk climate: Despite the rally to ~US $4,000/oz, gold retains safe-haven appeal amid fiscal deficits, inflation uncertainty and geopolitical risks.
Current Market Landscape
Spot gold is trading near US $4,000/oz, after a strong 2025 advance. The market is in a “buy-the-dip” mode.
Media and analyst sentiment is “cautiously bullish” safe haven narrative remains intact even with mixed economic data.
Institutional positioning: Managed-money funds still carry net longs in the futures market; ETF flows recently slowed but positive structural trend remains.
Key Fundamental Drivers
Monetary policy & real yields
The Fed cut policy rate (e.g., Oct 29) and paused QT reducing the real cost of holding non-yielding gold.
Real yields (10-yr TIPS) remain around ~1.5–2%: such levels create a friendly backdrop for gold.
Fiscal deficits & debt dynamics
US federal deficit remains large (e.g., FY2025 > US$1.8T) and yields/duration risks are elevated. Investors increasingly view gold as a hedge.
Demand from central banks & institutions
Q3 2025: Central banks added ~220 tonnes of gold still well above long term averages.
ETFs and institutional flows are showing renewed interest an important supporting driver for price continuation.
Supply side constraints
Global gold mine production is increasing slowly but new supply is constrained by declining ore grades, higher capex, and permitting issues so gold supply is relatively inelastic.
Sentiment & Positioning
Managed-money net longs remain elevated, signaling structural bullishness but also warns of potential shakeouts during corrections.
ETF flows after strong inflows earlier in the year, some recent outflows could signal short-term consolidation rather than trend reversal.
Risk sentiment elevated geopolitical risk, inflation concerns, and economic uncertainty keep the safe haven bid for gold alive.
Supply–Demand Picture (2025)
Demand side: Central bank purchases + institutional/ETF inflows are major drivers.
Supply side: Mining output growth is limited; new, large scale expansions are rare and take many years. Less responsive supply = higher upside potential when demand ramps.
Path to US $5,000/Oz
Base case (bullish grind):
Real yields stable or falling (≤ ~1.5–1.8%)
Central banks continue buying, institutional flows turn net positive
Supply remains tight
→ A move to US $4,500-4,800/oz over next 3–6 months; $5,000 becomes realistic if momentum picks up.
Bull extension case (fast breakout):
Real yields drop sharply, Fed signals further cuts
Strong inflows into ETFs and increased physical demand
Geopolitical shock or inflation surprise
→ Potential overshoot to US $5,200-5,500/oz.
Risk (bear detour):
Real yields rise considerably (>2%)
Strong USD rally, large ETF outflows
→ Possible pullback to US $3,550-3,900/oz – still a structural buy zone if fundamental drivers remain intact.
What Are Institutions & Banks Doing?
Central banks: Still net buyers Q3 2025 saw ~+220t of purchases, indicating that official sector continues accumulating gold.
Institutions (ETFs, funds): After earlier strong inflows, there have been short-term outflows—a typical healthy consolidation in a larger uptrend.
Miners & producers: Higher gold prices improving margin, but many companies warn that future supply growth will be slow—supporting the tight supply narrative.
Technical & Action Plan
Key support zones: ~US $3,900-3,950 (last major pullback); if breached, next structural support is ~US $3,550-3,600.
Momentum trigger: A clear rebound and hold above ~US $4,250-4,300 would open space toward ~US $4,500-4,800.
Breakout validation: To aim for US $5,000, gold needs to clear its recent highs, hold above, and see confirmation via inflows & yield dynamics.
Suggested post headline:
“XAUUSD Structural Path to $5,000: Central-Bank Buying, Low Real Yields, Tight Supply. Pullbacks = Opportunity.”
Suggested call to action:
“Watch for support around 3,900–3,950; a clean rebound and hold above 4,300 could trigger the next leg. Managing risk with stop-loss below 3,550 in case of real-yield shock.”
Key Risks to Mention
-A surprise hawkish turn by the Fed (inflation too strong) → Real yields spike, USD rallies.
-Prolonged ETF outflows or liquidity crunch hitting gold.
-Rapid supply response (unlikely short-term but possible long term).
-Geopolitical de-escalation reducing safe-haven demand unexpectedly.
Zezu Zaza
2048

Gold is Ready For Bull From SupportHello Traders
In This Chart GOLD HOURLY Forex Forecast By FOREX PLANET
today Gold analysis 👆
🟢This Chart includes_ (GOLD market update)
🟢What is The Next Opportunity on GOLD Market
🟢how to Enter to the Valid Entry With Assurance Profit
This CHART is For Trader's that Want to Improve Their Technical Analysis Skills and Their Trading By Understanding How To Analyze The Market Using Multiple Timeframes and Understanding The Bigger Picture on the Charts

Go Bold with Gold I’m expecting gold to rise from the current levels — around 4110.
The invalidation zone for this plan is marked in red on the chart

XAU/USD Short to Longs idea Yes — I still believe Gold remains bullish overall. The recent downside movement looks like a healthy correction before price continues its rally upward. I’m noticing price building liquidity, so I’ll wait for a breakout and a clean tap into one of my key POIs.
Currently, price is sitting in a 30min demand zone near a 2hr supply, where I expect a possible short-term reaction. After that, I’ll be waiting for the next solid buying opportunity — ideally from the 3hr demand around 3,860, or from a new demand that may form closer to current price this week.
Confluences for Buys:
- Price broke major structure to the upside and is now retracing
- Liquidity above (trendline + Asia highs) waiting to be taken
- 3hr demand around 3,860 could fuel the next rally
- Bullish candlestick momentum remains strong
- Higher time frames still show clear bullish structure
P.S.If price breaks below 3,850 with clear bearish structure, I’ll consider a short-term bearish phase. Until then, I’ll stay focused on long opportunities in line with the dominant trend. Have a great trading week!

How to trade gold stably as the weekly and monthly charts close?#XAUUSD TVC:GOLD OANDA:XAUUSD
As we expected, gold broke through the previous strong resistance at 4030 and continued its bullish trend, reaching a high of 4046, very close to our target of 4050. Although the price of gold retreated somewhat after the brief surge, from the daily chart, the short-term price of gold is still above the MA5 moving average, while from the 4-hour chart, the middle band coincides with the MA20. Therefore, I don't think this means the bulls have given up; on the contrary, it's more like a way to better accumulate momentum at the bottom. This strategy remains effective, and we can still consider going long on gold when the price retraces to the 3985-3975 range.

Gold to MineAccording to Binary_Forecasting_Service
I get the idea that this might be the possible path toward the oblivion

Gold Buy at 4080 and sell at 4240Now gold in consolidation mode and trying to book profits and make the retail traders into the trap so for now we need to be patience and buy at 4080 and close at 4240, after the fed interest cut gold will come down so sell at 4240 and wait for long selling till 3966. This method is Wd Gann inspiration i made and am still learning, this one sharing for study purpose so trade with your own analysis.

What is the purpose of this back-and-forth market manipulation?#XAUUSD OANDA:XAUUSD TVC:GOLD
Gold prices have broken through short-term resistance due to news, and the hourly and 4-hour charts show prices above the middle Bollinger Bands. Therefore, we need to adjust our strategies accordingly. However, the market is currently fluctuating rapidly, and entering the market rashly in the short term still carries significant risks. Therefore, the wise choice is to wait and see, and enter the market only after the market stabilizes. In the short term, the upside resistance level to watch remains at 4030. If gold breaks through this level strongly during the US session, the price may test 4050. The initial support level to watch is 3980-3960. If the price retraces but does not break through this level, consider taking small long positions in gold in batches, with a target of 4010-4030. Temporary adversity is the best test for traders; setbacks only make us stronger. Success belongs to the confident, opportunity belongs to the pioneers, and miracles belong to the persistent! 💪💪💪

ANFIBO | XAUUSD - Soboring today [10.30.2025]Hi traders, I'm here, Anfibo.
XAUUSD Analysis – Daily Trading Plan
Trading Plan for Today:
>>> SELL ZONE:
ENTRY: 4135 - 4150
SL: 4165
TP: 4045 - 4010 - 4000
>>> BUY ZONE:
ENTRY: around 3935
SL: 3915
TP: 4020 - 4080 - 4135 - ...
Risk Management:
- Prioritize Buy setups following the higher-timeframe trend; Sell only for intraday scalps.
- Maintain a minimum Risk:Reward ratio of 1:2.
- Avoid entries during major geopolitical or economic announcements.
- Monitor the Head & Shoulders pattern closely — confirmation will guide the next major move.
Conclusion:
Gold has completed a healthy correction after its parabolic surge to $4,400, and the market is now regrouping around the $4,000 zone, with early signs of renewed bullish momentum. As long as $3,890 remains intact, the broader trend remains bullish, and I expect a potential rebound toward $4,200 in the near term.
GOODLUCK, LOVE U GUYS!

GOLD HIGH PROBABILITY SETUP SOON!!!🚨 XAUUSD HIGH PROBABILITY BUY SETUP 🚨
* Here We Can See Clearly The Next Potential Moves For GOLD Coming Hours/Days.
* Keep Your Eyes Close On Your Trading Positions.
* Happy PIP Hunting Traders.
FXKILLA.

GOLD ; How far down?Hello friends
Well, after the good rise we had, the price needed a correction, which happened with a double top pattern.
Now the main question is, how far will the fall go?
Well, in the short term, the price can fall to the specified limits, and if the support areas are broken, the fall will continue, and on the other hand, an important resistance has been created, which the price needs to break for the new ATH.
With this decline, it is unlikely that the price will suffer for a while and correct because it has grown a lot and everything will end one day...
Support levels can be good points for buying, of course with capital and risk management.
*Trade safely with us*

GOLD (XAUUSD) is ready to drop again! Gold has broken below a very strong support trendline which held the price for many weeks. It then also tried to test a powerful resistance level (the red trendline) but it failed to break through. It is now very likely to head all the way down to the next major support zone (which is the while line drawn below)

Gold surges strongly after Fed decision – eyes on 4000+ breakout1. Market Movements
After the Federal Reserve cut interest rates by 0.25% and signaled a potential end to quantitative tightening (QT), gold extended its strong upward momentum.
Institutional and ETF buying continues to drive prices higher, with gold now testing the key psychological level at $4000/oz.
2. Technical Analysis
• Near-term Support: $3960 – $3970
• Deeper Support: $3935 – $3940 (pre-Fed accumulation zone & H4 EMA50)
• Immediate Resistance: $3988 – $4000
• Extended Resistance: $4025 – $4040 (mid-October technical high)
• Momentum: Both EMA20 and EMA50 on H1 and H4 are sloping upward, confirming strong bullish momentum. RSI remains elevated (70–75), signaling overbought but still strong trend conditions.
• Volume: Continues to rise steadily, showing sustained institutional inflows. However, short-term correction risks remain near $4000 due to overextension.
3. Outlook
The overall trend remains bullish, but caution is advised as gold approaches the $4000–$4040 resistance zone — a potential area of strong profit-taking.
If gold fails to break above $4040 decisively, a short-term pullback toward $3970 or $3940 is likely.
4. Suggested Trading Plan
🔺 BUY XAU/USD
Entry: $3925 – $3928
🎯 TP: 40 / 80 / 200 pips
🛑 SL: $3922
🔻 SELL XAU/USD
Entry: $4037 – $4040
🎯 TP: 40 / 80 / 200 pips
🛑 SL: $4043
