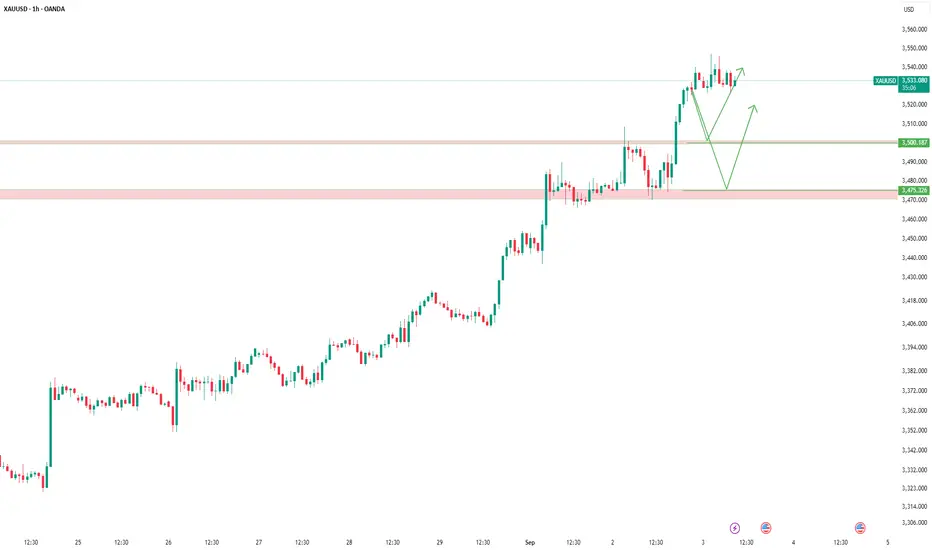
Gold/XAUUSD Intrday Move 04.09.2025Gold is currently trading near 3539, after retracing into yesterday’s demand zone at 3526–3531. This zone has shown strong reactions previously and continues to hold as a key level for buyers.
🔑 Key Reasoning
Demand Zone: Price is retesting 3526–3531, a strong support area where buyers previously stepped in.
Bullish Continuation Bias: The broader structure remains bullish, and as long as this zone holds, the outlook favors continuation to the upside.
Confirmation Level: A decisive close above 3542 would confirm bullish momentum and open the way for further upside.
Invalidation: A break below 3511 (recent low) would invalidate the bullish setup and shift bias to neutral/short-term bearish.
🎯 Trade Plan
Entry: Buy from 3526–3531 demand zone.
Confirmation: Add positions if price closes clearly above 3542.
Stop-Loss: Below 3511 (recent low).
Targets:
First target: 3578 (recent swing high).
👉 Summary: Bias stays bullish above 3526–31 demand zone. A clean break above 3542 strengthens the case for continuation toward 3578, with invalidation below 3511.
Goldlong

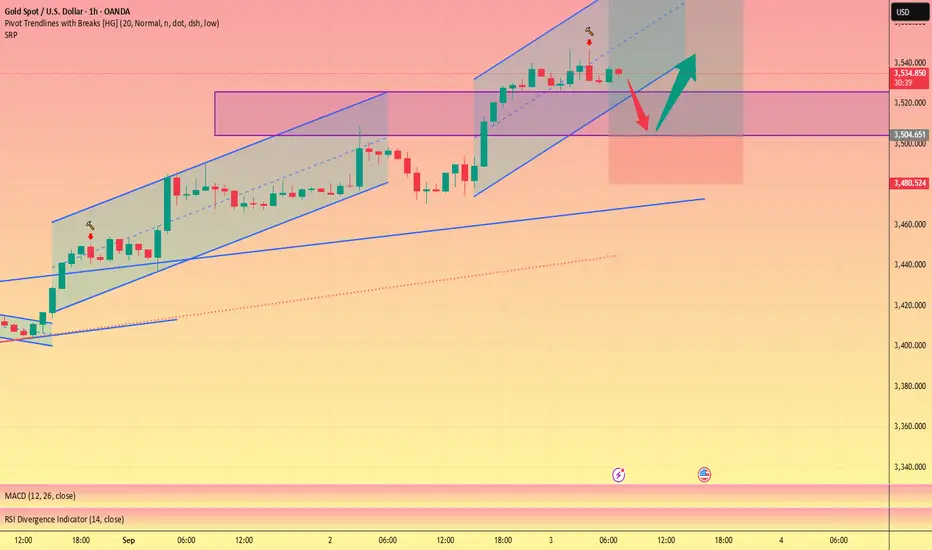
Gold 04/09 – Smart Money Setup: Sell Scalp, Prep for Buy Zones🟢 Market Context
Gold is currently showing a short-term bearish setup after a ChoCH (Change of Character) near 3,536.556. The market is rejecting supply and forming liquidity sweeps around the 3,531–3,533 zone. Expecting price to pull lower toward demand areas before the next bullish leg.
________________________________________
📍 Key Levels & Trade Plan
🔴 Intraday Sell (Scalp Opportunity)
• Entry: 3,531 – 3,533
• Stop Loss: 3,535
• Target: 3,485
🟢 Swing Buy Zones
1. Buy Zone 1: 3,475 – 3,477
o Stop Loss: 3,470
o Target: 3,508 – 3,526
2. Buy Zone 2 (Deeper Discount): 3,441 – 3,443
o Stop Loss: 3,435
o Target: 3,500+
________________________________________
⚖️ SMC Bias
• Short-term: Bearish scalp from supply zone.
• Mid-term: Looking for liquidity grab and bullish reversal at demand zones.
• Long-term: Maintaining bullish order flow as long as deeper demand (3,441) holds.

Gold 03/09 – Smart Money Playbook: Buy the Dip, Sell the High🟢 Market Context
Gold maintains a bullish order flow after multiple BOS (Break of Structure) and ChoCH (Change of Character) confirmations. Price is currently consolidating near the 3,533–3,540 zone, with a clear FVG (Fair Value Gap) below. The market shows potential for liquidity sweep before another leg upward.
________________________________________
📍 Key Levels
• Resistance (Sell Zones): 3564 | 3575–3576 | 3586 | 3595
• Support (Buy Zones): 3528 | 3508 | 3494 | 3480–3478 | 3468
________________________________________
🛠️ Trade Ideas
✅ Buy Zone (Intraday Swing)
• Entry: 3480 – 3478
• SL: 3473
• TP: 3485 – 3490 – 3500 – 3515 – 3520 – 3530
📌 Expectation: Price to mitigate FVG and react from demand zone before continuation upward.
✅ Buy Scalp (Quick Reaction)
• Entry: 3501 – 3503
• SL: 3491
• TP: 3510 – 3525 – 3545 – 3550
📌 Expectation: Short-term liquidity grab above 3500 psychological level leading to bullish push.
❌ Sell Zone (Countertrend Play)
• Entry: 3575 – 3573
• SL: 3582
• TP: 3565 – 3555 – 3545 – 3530 – 3520
📌 Expectation: Strong supply zone where smart money may hunt liquidity before reversal.
________________________________________
🔑 SMC Insights
• BOS confirms bullish bias, but price may retrace to fill imbalance (FVG).
• Liquidity likely resting around 3480–3500 before a push to test 3575+.
• High probability of buying dips at demand and selling extreme supply zones.

GOLD STEPS UP – HITS NEW ATH AT $3 565📊 Market Overview:
Gold has now reached $3 565/oz, continuing its bullish ascent amid persistent global uncertainty. Safe-haven demand remains strong, and the market reflects near-certain expectations (92%) of a Fed rate cut in mid-September
📉 Technical Analysis:
• Key Resistance: $3 570 – $3 580
• Nearest Support: $3 555 – $3 560
• EMA: Price remains well above EMA09 & EMA50 → strong bullish momentum.
• Candlestick / Momentum: A breakout above prior resistance accompanied by high volume confirms strengthening upward momentum
📌 Outlook:
Despite modest economic data, gold continues its rally and just hit a new high. A short-term pullback to support zones remains possible, but the upward trend is firmly intact.
💡 Trading Strategy Suggestions:
✅ BUY : $3555 – $3558
🎯 TP: $3570
❌ SL: $3553

Gold Trade Idea Thurs 4 Sep Gold has finally come down !
Based on the Fibo levels, the next best buy levels are
3515-3520
3475-3480
Good Luck !

PLS PLS Hold GOLD BUYS Do not close themIt will not stop its in the middle of wave 3
Levels in the chart, will update

Where can you buy gold?Hello friends
After the good growth we had, you can see that the price has formed a three drive pattern and this could indicate a price correction to the specified support areas.
Otherwise, if the price breaks the resistance level, we can buy with confirmation in the pullback, of course with capital and risk management.
*Trade safely with us*

PLAN XAUUSD SEP 03, 2025 Related Information:!!!
According to the CME Group’s FedWatch Tool, traders are pricing in over a 90% probability that the U.S. Federal Reserve will cut borrowing costs by 25 basis points at the conclusion of its two-day policy meeting on September 17. Furthermore, market participants expect the central bank to implement at least two rate cuts by the end of this year, which continues to support non-yielding Gold prices.
Meanwhile, U.S. President Donald Trump has pressured Fed Chair Jerome Powell to lower interest rates. In addition, Trump’s move to dismiss Fed Governor Lisa Cook amid allegations of mortgage fraud has raised concerns about the central bank’s ability to operate without political interference. This, combined with ongoing trade uncertainties, has propelled the XAU/USD pair to fresh record highs.
personal opinion:!!!
Gold price breaks above the 3,550 resistance, then continues its uptrend.
Important price zone to consider : !!!
Resistance zone point: 3550 zone

Gold XAUUSD Intraday Move 3.9.2025🔹 Bias: Bullish Continuation After Liquidity Sweep
Gold remains in a bullish structure overall, consolidating around 3538 after failing to clear 3547, which suggests liquidity engineering beneath current levels before continuation higher.
🔹 Key Demand Zone (3526–3531)
This zone marks prior accumulation and the origin of the last bullish impulse. A controlled dip into this area would allow liquidity sweep and re-entry of buyers, making it the critical zone to watch.
🔹 Liquidity Above 3547
Equal highs have formed near 3547, indicating liquidity resting above this level. A breakout here, once demand is respected, can provide fuel for a strong push toward the 3567 objective.
🔹 Risk Management (3515 Invalidation)
The invalidation point sits at 3515. A sustained break below this level would indicate absorption of demand and shift bias away from buyers. Until then, risk-to-reward strongly favors longs.
🔹 Trade Plan
Entry: Scale in within 3526–3531 after confirmation of order flow shift (CHOCH or strong bullish displacement).
Stop-Loss: Below 3515.
Take Profits: Partial at 3544/3547, trail stop to breakeven above 3547, final target at 3567.
👉 This breakdown balances structure, liquidity, and execution plan—giving traders both reasoning and a clear actionable path.

Gold (XAUUSD) Intraday Analysis – September 3, 2025On the M15 chart, gold has shown a strong breakout from previous consolidation, rallying up to test the 3,544 – 3,546 USD/oz resistance area. After touching this zone, price is consolidating in a tight range, reflecting ongoing buying pressure while some profit-taking has emerged.
Key Technical Levels:
Immediate Resistance: 3,544 – 3,546 (recent high, needs a breakout for bullish continuation).
Next Resistance: 3,560 – 3,565 (Fibonacci extension + previous supply zone).
Immediate Support: 3,528 – 3,530 (EMA20 on M15 + short-term structure support).
Major Support: 3,512 – 3,515 (logical stop-loss zone + previous swing low).
Price Action & Indicators:
Trendline remains intact on the M15 chart, confirming short-term bullish momentum.
RSI is holding between 58–62, showing room for further upside without being overbought.
EMA20 & EMA50 continue to provide bullish support in the intraday trend.
Trading Scenarios:
Bullish Scenario:
If price sustains above 3,530 and breaks 3,546 decisively, upside targets open toward 3,560 – 3,565, with extended potential to 3,580.
Safer entry: Wait for breakout and successful retest of 3,546.
Bearish Pullback Scenario:
Failure at 3,546 followed by a break below 3,528 could drive a correction toward 3,512 – 3,515.
This level should be monitored for potential demand and re-entry opportunities.
Strategy Suggestions:
Trend-following Buy: Buy stop above 3,546, TP 3,560 – 3,565, SL 3,528.
Short-term Counter Sell (scalping): Sell around 3,544 – 3,546 if bearish reversal candles appear, TP 3,528 – 3,515, SL 3,552.
Today, gold sits at a decisive zone: either a breakout above resistance to confirm bullish continuation, or a correction to test deeper supports. Risk management and patience for confirmation signals remain key.
- Follow for more daily gold strategies, and save this analysis if you find it useful.

Gold Approaching $3,550 – Continuing Uptrend📊 Market Movement:
Gold has shown a corrective decline to around $3530 before stabilizing. The market is awaiting new momentum as traders balance between profit-taking and expectations of a continued uptrend.
📈 Technical Analysis:
- Resistance: $3550 – $3565
- Support: $3518 – $3525
- EMA trend: Still pointing upward, but showing early signs of consolidation.
- Candle patterns: Strong rejections near $3530 indicate demand remains solid.
🔎 Outlook:
Gold is still bullish in the medium term, but short-term corrections are expected before another upward attempt. Traders should remain cautious at resistance levels and look for confirmation signals at supports.
🎯 Trading Strategy:
🔻 SELL XAU/USD
Entry: $3542–3545
🎯 TP: 40/80/200 pips
🛑 SL: $3.548
🔺 BUY XAU/USD
Entry: 3520 – 3523
🎯 TP: 40 / 80 / 200 pips
🛑 SL: 3517

Waiting for Gold PullbackWe’re waiting for gold to retest the broken level, giving us a buying opportunity.
The $3500 and $3475 levels look like solid spots for long entries 📈.
As always, we don’t dictate where the market should go—we just follow it:
If the levels break to the downside, we’ll simply wait for a pullback to short 📉.
One of the keys to success is moving with the market, not stubbornly relying on a few lines drawn on the chart.
✅ If the market wants to go up—great, we’re with it.
✅ If it wants to drop—that’s fine too, we’re still with it.
Levels are just tools to help us align with the market—not holy lines that must work.
Everything in trading is probabilities 🎯, and our levels work about 85% of the time.
3500 is the key, go long when it retracements and stabilizes#XAUUSD
Before the release of NFP data, gold prices continued to rise on the daily chart and remained stable near the upper limit at the morning opening. 🐂The current market is in an extreme situation. Before there is a clear direction, we always maintain a cautious attitude towards buying. Currently, it is near a historical high and the market is bullish. Once you chase high prices easily, it will be more dangerous and you will easily suffer losses.📊
Judging from the 4H chart, since gold rose to 3500, this point has changed from resistance to support.🥅 No matter whether gold continues to rise or fall, it must touch this point to establish a clearer short-term direction. Therefore, we will definitely not participate in the current trading around 3535.⚠️ If we want to participate in the short term, I suggest referring to 3525-3500 and wait for it to stabilize before taking long orders with a small position in batches. Otherwise, there will definitely be risks. The short-term target can be seen at 3550-3560.📈
Gold Under Pressure Time To Short XAUUSD?Gold (XAUUSD) is currently trading around 3533, and bearish momentum is gaining strength as sellers dominate the market. Price action indicates a strong rejection from the recent highs, signaling potential continuation to the downside. The next major target is 3450, and if selling pressure remains strong, we could see further dips toward deeper support zones. Keep an eye on key levels and trend confirmations before entering positions. Maintain strict risk management and adjust positions according to volatility. A break below current support could open the way for extended bearish movement, making this a crucial opportunity for short traders."

GOLD H1 STRUCTURE Gold Buying Zones We Have
TRENDLINE BUY : 3503
FVG AREA BUY : 3509, 3492
ORDER BLOCK : 3448, 3442
ORDER BLOCK : 3408, 3403
These Are Our Buy Zones
Hope You Understand Thanks For Here Follow Us For More

Gold Price Surges to $3,533: What’s Next?Gold (XAU/USD) has recently shown a strong bullish momentum on the TradingView 4-hour chart, climbing to $3,533.92. This move has caught the attention of traders worldwide as the precious metal approaches a key resistance level. In this article, we will analyze the current gold price action using technical indicators, discuss possible market scenarios, and share insights for traders.
Current Gold Price Overview
Current Price: $3,533.92
Resistance Level: $3,534
Support Level: $3,438
Timeframe: 4H Chart
Gold has surged over $191 (+5.7%) from recent lows, reflecting strong bullish momentum driven by global market uncertainty and increasing demand for safe-haven assets.
Trend Analysis
The chart shows a strong uptrend, with the price trading above the moving average and forming higher highs and higher lows. The Zig Zag indicator (5,10) highlights the continuation of the bullish pattern.
RSI Indicator
The Relative Strength Index (RSI) is currently near the 70 level, indicating overbought conditions. This suggests a possible short-term correction or consolidation before the next bullish move.
Volume Analysis
Volume has increased significantly during this breakout, confirming strong buying interest from traders and institutions.
Key Levels to Watch
Immediate Resistance: $3,534 – If broken, gold may target $3,600 and then $3,700.
Immediate Support: $3,438 – If price drops below this, a correction toward $3,350 is possible.
Trading Strategy for XAU/USD
1. For Buyers (Bullish Traders):
Wait for a confirmed breakout above $3,534 with strong volume before entering. Target $3,600 and $3,700 in the medium term.
2. For Sellers (Bearish Traders):
Look for RSI overbought signals and bearish candlestick patterns near resistance for short-term pullback trades. Targets: $3,438 and $3,350.
Why Use TradingView for Gold Analysis?
TradingView is one of the best charting platforms for analyzing gold and other assets because it offers:
Advanced technical indicators like RSI, Zig Zag, and Moving Averages.
Real-time price updates for XAU/USD and other forex pairs.
Interactive charts for better trade planning.
Conclusion
Gold is currently in a strong bullish trend, but traders should watch for resistance at $3,534 and monitor RSI levels for possible pullbacks. TradingView tools make it easier to analyze such setups and stay ahead in the market.

GOLD to the MoonHiper Clear Structure and the beginning of a new impulse towards 3.600 and 3.700
Hope everybody had a chance to got in
gg

GOLD: Where Will The Bulls Take Us Next?Why we should buy...
(H4)
Market structure is still bullish. Last strong BOS was through 3425, which confirms continuation.
Demand Zone to watch:3428–3435
In case we get a deeper pullback, another zone to keep an eye on is 3405–3415.
(H1)
Gold closed the week strong, creating a clean FVG at 3430–3438 which aligns with H4 demand.
As long as price holds above 3428, bulls remain in control.
(M15)
Intraday structure is bullish. Price is still creating higher highs and higher lows.
Liquidity is sitting just above 3455–3460 which you could use for your first target.
There is some internal liquidity also built up below 3435. This could be a perfect sweep area for a retest entry.
Invalidation: A clean H4 close below 3420 would invalidate my bias and open further decline back into 3405–3415 area.

Gold (XAUUSD) – Symmetrical Triangle Breakout & Supply Zone ShorTVC:GOLD recently broke out of a symmetrical triangle on the upside. While this pattern is neutral, the breakout direction gives us momentum clues.
🔑 Key Zones:
Central Zone (0.5 Fib retracement of last high) → currently acting as supply.
If price rejects here → I expect reversal toward lower levels.
If no reaction → next supply zone becomes my reversal area.
📉 My Plan:
Entering a short position at Central Zone.
Stop Loss: Above the last 4H candle close.
Target: Previous imbalance/FVG and below.
⚙️ Methodology Used:
Chart Patterns (Symmetrical Triangle breakout)
MMC (Mirror Market Concept: market repeats behavior over time)
Fibonacci Supply Zones
📌 Conclusion:
Watching closely for rejection in the Central Zone. If confirmed, bearish momentum could bring strong downside. If not, I’ll wait for the upper supply zone to trigger reversal.

Gold Price At Record High: Will The Yellow Metal Hit New Highs?
The precious metals market is experiencing unprecedented excitement as gold prices soar to fresh record highs, captivating investors and analysts worldwide. With escalating trade tensions and a weakening dollar serving as primary catalysts, the yellow metal has demonstrated remarkable resilience and strength, prompting widespread speculation about whether this bullish momentum can sustain itself into the future.
The Current Gold Rush: Understanding the Record-Breaking Performance
Gold's recent surge to new all-time highs represents more than just a temporary market fluctuation; it signals a fundamental shift in global economic sentiment. The precious metal, long considered a safe-haven asset during times of uncertainty, has once again proven its worth as investors seek refuge from mounting geopolitical tensions and currency devaluation concerns.
The current rally builds upon decades of gold's historical performance as a store of value, but the velocity and magnitude of recent gains have surprised even seasoned market veterans. Trading volumes have reached extraordinary levels as both institutional and retail investors scramble to secure positions in what many perceive as an increasingly valuable hedge against economic instability.
Market dynamics have shifted dramatically as traditional investment paradigms face unprecedented challenges. The convergence of multiple economic factors has created what analysts describe as a "perfect storm" for gold appreciation, with technical indicators suggesting that the current momentum may have significant staying power.
Trade Tensions: The Geopolitical Engine Behind Gold's Ascent
Escalating trade tensions between major global economies have emerged as one of the most significant drivers of gold's recent performance. As diplomatic relationships strain and tariff wars intensify, investors are increasingly turning to gold as protection against the economic fallout from deteriorating international trade relationships.
The ripple effects of trade disputes extend far beyond immediate market reactions, creating long-term uncertainty that fundamentally alters investment strategies. Supply chain disruptions, shifting manufacturing bases, and retaliatory measures between trading partners have introduced volatility into traditional asset classes, making gold's stability increasingly attractive.
Historical precedent supports the correlation between trade tensions and gold appreciation. During previous periods of international economic conflict, gold has consistently outperformed other asset classes, serving as a reliable indicator of market stress. The current environment mirrors many characteristics of past trade disputes, but the scale and scope of contemporary tensions suggest potentially more sustained pressure on global markets.
Corporate earnings have begun reflecting the impact of trade uncertainties, with many multinational companies reporting decreased profitability due to increased operational costs and market access restrictions. This corporate stress translates directly into equity market volatility, further reinforcing gold's appeal as a portfolio diversification tool.
Dollar Weakness: Currency Dynamics Fueling Gold's Rise
The weakening dollar has provided substantial tailwinds for gold's recent rally, as the inverse relationship between the world's primary reserve currency and precious metals continues to hold true. Dollar depreciation makes gold more affordable for international buyers while simultaneously reducing the opportunity cost of holding non-yielding assets.
Federal Reserve monetary policy decisions have played a crucial role in dollar weakness, with accommodative policies designed to support economic growth having unintended consequences for currency strength. Lower interest rates reduce the attractiveness of dollar-denominated investments, prompting capital flows toward alternative stores of value like gold.
International central banks have been notable participants in this shift, with many diversifying their foreign exchange reserves away from dollars and toward gold. This institutional buying provides a substantial floor for gold prices while signaling long-term confidence in the metal's value proposition.
Currency market volatility has reached levels not seen since major financial crises, creating an environment where traditional hedging strategies prove inadequate. Gold's role as a currency hedge becomes particularly valuable during periods of extreme volatility, as it maintains purchasing power across different monetary systems.
Expert Analysis: Professional Perspectives on Gold's Future
Leading precious metals analysts remain cautiously optimistic about gold's prospects, though opinions vary regarding the sustainability of current price levels. Many experts point to fundamental supply and demand imbalances that could support higher prices over the medium to long term.
Mining industry challenges have contributed to supply constraints that may persist for years. New gold discoveries have declined significantly, while existing mines face increasing production costs due to deeper extraction requirements and stricter environmental regulations. These supply-side factors create a foundation for price appreciation independent of demand fluctuations.
Investment demand patterns have evolved substantially, with younger demographics showing increased interest in gold exposure through exchange-traded funds and digital platforms. This demographic shift suggests potential for sustained demand growth as these investors mature and accumulate wealth.
Technical analysis reveals strong chart patterns that many experts interpret as indicative of continued upward momentum. Key resistance levels have been decisively broken, and momentum indicators suggest that the current rally may have significant room to run before encountering meaningful technical obstacles.
Market Structure and Institutional Participation
The composition of gold market participants has undergone significant transformation in recent years, with institutional investors playing an increasingly prominent role. Pension funds, endowments, and sovereign wealth funds have allocated substantial resources to gold exposure, providing stability and reducing volatility compared to retail-dominated markets.
Derivatives markets have expanded dramatically, offering sophisticated investors numerous ways to gain gold exposure while managing risk. Options activity has reached record levels, with both speculative and hedging strategies contributing to increased market depth and liquidity.
Exchange-traded funds focused on gold have experienced massive inflows, representing one of the most accessible ways for investors to participate in gold's appreciation. These vehicles have democratized gold investment while providing transparency and liquidity that traditional physical ownership cannot match.
Central bank policies beyond the United States have also influenced gold markets, with European and Asian monetary authorities implementing strategies that indirectly support precious metals prices. Coordinated global monetary expansion has created conditions favorable to hard asset appreciation.
Economic Fundamentals Supporting Gold
Inflation expectations have begun rising in many developed economies, creating conditions historically favorable to gold appreciation. While inflation rates remain relatively subdued, forward-looking indicators suggest potential for significant price pressures in coming years.
Debt levels across both public and private sectors have reached unprecedented heights, raising questions about long-term fiscal sustainability. Gold serves as a hedge against potential debt crises and currency devaluations that could result from unsustainable borrowing practices.
Real interest rates, calculated as nominal rates minus inflation expectations, have turned negative in many jurisdictions. This environment reduces the opportunity cost of holding gold while making yield-bearing alternatives less attractive on an inflation-adjusted basis.
Global economic growth concerns have intensified, with many indicators suggesting potential recession risks. Historical data demonstrates gold's tendency to outperform during economic downturns, making current positioning particularly attractive for risk-averse investors.
Risks and Challenges Facing Gold's Bull Run
Despite strong fundamentals supporting higher gold prices, several factors could potentially derail the current rally. Sudden improvements in trade relationships could reduce safe-haven demand, while unexpected dollar strength might pressure gold prices lower.
Cryptocurrency adoption continues expanding, with some investors viewing digital assets as modern alternatives to traditional safe havens like gold. This technological disruption could potentially reduce gold's relevance for younger investors seeking portfolio diversification.
Central bank policy reversals remain a constant threat to gold's momentum. Should major monetary authorities shift toward more hawkish policies, resulting interest rate increases could make yield-bearing assets more attractive relative to gold.
Market positioning has become increasingly crowded, with speculative positions reaching levels that historically precede corrective pullbacks. While fundamentals remain supportive, technical factors suggest vulnerability to profit-taking activities.
Looking Ahead: Future Prospects for Gold
The convergence of multiple supportive factors suggests that gold's bull market may have significant longevity, though volatility should be expected along the way. Structural changes in global monetary systems, persistent geopolitical tensions, and evolving investor preferences all point toward sustained demand for precious metals exposure.
Long-term demographic trends favor gold appreciation, as emerging market wealth accumulation traditionally includes substantial precious metals allocations. Growing middle classes in Asia and other developing regions represent vast potential demand that could support higher prices for decades.
Environmental and social governance considerations are beginning to influence mining operations, potentially constraining future supply growth while supporting premium pricing for responsibly sourced gold. These factors add another dimension to gold's investment thesis beyond traditional monetary considerations.
The yellow metal's record-breaking performance appears to reflect genuine fundamental changes rather than speculative excess, suggesting that new highs may indeed be achievable. While short-term volatility remains inevitable, the underlying conditions supporting gold's appreciation show little sign of abating, making a compelling case for continued strength in the precious metals complex.
As global economic uncertainty persists and traditional investment paradigms face mounting challenges, gold's role as a portfolio cornerstone seems likely to expand rather than diminish, potentially driving prices to levels previously thought impossible.

Gold (XAU/USD)Gold (XAU/USD)
As seen in my previous analysis, we successfully caught the price at a great level and have been holding a gold buy position ✅.
🔔 Now, around the $3500 zone, I’m ready to short gold.
With a signal confirmation on the 1H timeframe, we can enter short 📉 and close the earlier buy position from lower levels.
📌 Gold is approaching the top of its range, making this a potential shorting opportunity.

XAUUSD Gold Intraday Setup 02.09.2025Gold is currently trading at 3473, after hitting new ATH around 3508, now testing into a key demand zone. Price has shown a corrective move after the recent bullish impulse and is reacting from a consolidation order block.
Key Levels:
First buy zone: 3469–3473 → aligns with immediate demand and prior accumulation.
Second buy zone (deeper retracement): 3449–3454 → lower demand zone + strong support base.
Structure & Bias:
Market structure remains bullish with higher highs and higher lows intact.
Current pullback is corrective in nature, tapping into demand zones.
Liquidity below minor lows (around 3470 and 3450) could be swept before a strong bullish continuation.
Targets:
First target: 3492 (recent high/intraday resistance).
Second target: 3508 (swing high, liquidity pool).
Trade Plan:
Look for bullish confirmation (rejection wick, engulfing, or structure shift) in the 3469–3473 zone for a buy entry.
If price breaks below decisively, next long entry should be considered from the 3449–3454 zone.
Stop-loss ideally below 3460 for the first zone, and below 3435 for the second zone.
👉 In short: Bias is bullish; buy dips into 3469–73 or 3449–54, aiming for 3492 & 3508.

BUY GOLD
Gold is bullish...Price has been trading inside a long-term ascending channel and recently broke out of an ascending triangle consolidation near the upper midline of the channel. This breakout suggests continuation of the bullish trend, with potential upside toward the channel resistance around the $3,600 - 3,800 zone.
