Gold (XAUUSD) – Waiting for Buy Opportunity Near Range SupportWe're currently inside a range and approaching its lower boundary.
There was a chance to go long a bit lower, but there’s still time — the highlighted zone looks like a solid area to consider longs.
We’re patiently waiting for price to enter the zone and give us a valid buy signal.
No rush. Let the market come to us
Goldlong

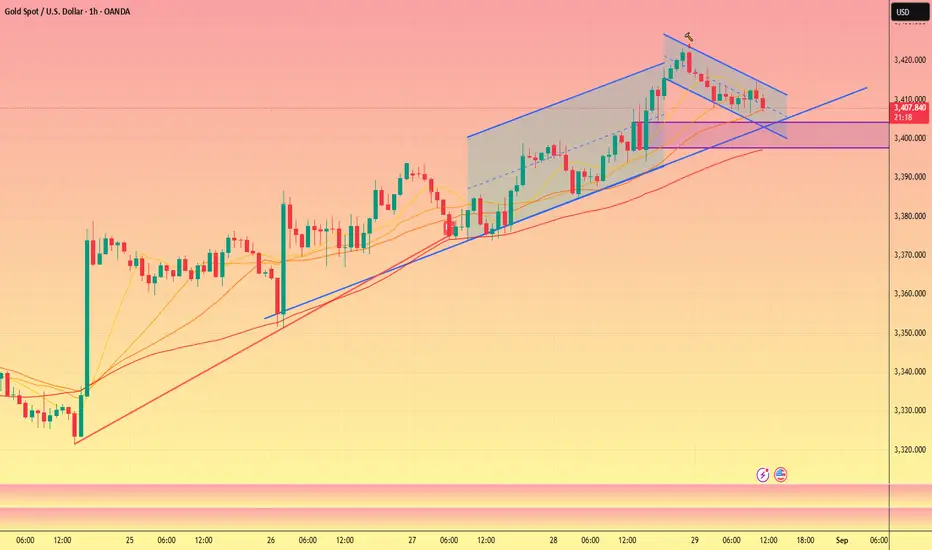
Gold (XAUUSD) Intraday Analysis – August 29, 2025On the H1 timeframe, gold has just created a fresh high around 3,420 USD/oz but faced strong selling pressure, pushing the price back to 3,407 USD/oz. This indicates that the 3,420 resistance zone remains a solid short-term barrier.
Technical Analysis
Key Resistance Levels:
3,420 USD/oz – the recent top, a breakout above this level may extend the bullish move toward 3,435 – 3,450 USD/oz.
3,407 – 3,410 USD/oz – current retest zone. Holding above it could trigger another attempt to test 3,420.
Key Support Levels:
3,380 – 3,385 USD/oz – highlighted demand area, acting as intraday support.
3,360 USD/oz – stronger support, aligning with the 38.2% Fibonacci retracement of the previous bullish leg.
EMA & RSI Outlook:
EMA 20 is still pointing upward, reflecting an intact bullish trend.
RSI on H1 shows slight bearish divergence → signaling a possible short-term pullback before continuation.
Trading Strategies
Buy the Dip (trend-following setup):
Look for long entries around 3,385 – 3,390 USD/oz.
Targets: 3,420 – 3,435 USD/oz.
Stop loss: below 3,375 USD/oz.
Counter-trend Sell (short-term setup):
If price fails to break 3,420 USD/oz, consider selling between 3,415 – 3,420 USD/oz.
Target: 3,385 USD/oz.
Stop loss: above 3,426 USD/oz.
- The overall trend remains bullish, but traders should wait for a corrective dip to enter with better risk-reward.
- Save this analysis to track the key levels and stay prepared for intraday setups.

Gold XAUUSD Intraday Analysis 29.08.2025Gold has been trading in a bullish trend, moving higher without any significant retracement yesterday. Currently, price is holding around 3405–3407 after rejecting higher levels.
Looking at the chart, a potential retracement zone lies at 3393–3396, which aligns with a demand area and prior consolidation. If price retraces into this zone, it may provide a strong opportunity to join the ongoing bullish trend.
The upside target remains at 3415, which corresponds to the next resistance area, while invalidation of this setup lies below 3386 support.
Trading Idea:
Entry (Buy Zone): 3393–3396
Stop Loss (SL): 3386
Take Profit (TP): 3415
Risk-to-Reward ratio: ~1:2
Plan: Wait for retracement into the 3393–3396 zone, and find confirmatoin before entering long.

World gold price today August 29, 2025According to the report just released, the US GDP grew by 3.3% in the second quarter, higher than the initial estimate of 3.0% and exceeding economists' expectations. Real GDP was revised up mainly due to improvements in investment and consumer spending.
The US Department of Labor just released labor market data. Initial jobless claims, seasonally adjusted, were 229,000 for the week ending August 23. This figure was only slightly lower than the forecast of 230,000. The previous week's figure was revised down from 235,000 to 234,000.
In addition, continuing jobless claims reached 1.954 million for the week ending August 16, lower than the expected 1.975 million.
The labor market remains strong, leaving the Federal Reserve (Fed) with room to tighten monetary policy, putting pressure on gold prices.
Market sentiment was further strained after US President Donald Trump on Monday decided to fire Federal Reserve Governor Lisa Cook over allegations of improper mortgage lending, raising concerns about the independence of the US central bank.

GOLD BUY BOXES Hello Everyone Welcome Back !
Gold Buy Zones According To SMC
BOS + ORDER BLOCK (LL)
ZONES BUY - 3395 / 3385 , 3377 / 3372 , 3364 / 3350
Follow The Zones , These Are Buying Zones Where You Can Buy Gold And Get Profit , Comment Your Opinion And Follow Us For More Trades

Is the entire network bullish? Trade with cautionGold rose yesterday without any obvious pressure, and bulls continued to exert their strength, 🐂but various technical indicators were close to the overbought area yesterday, and there is a need for technical correction in the short term. 📊
At the same time, due to the lack of certain news to drive gold, it is inevitable that gold will experience a correction today. 📉
Today's general trend is to go long when it falls back to support.📈 Focus on the effectiveness of the support at 3405-3395 below. After stabilizing here, you can consider going long and looking towards 3420-3430.🎯
Key data will be released later in the day, with core PCE data closely watched for new clues on whether the Fed will ease policy further after its September meeting. Any unexpected downside in the core PCE data could increase bets on a Fed rate cut, thereby weakening the US dollar and driving gold prices higher.👀
Today is Friday, and the weekly and monthly lines are about to come to an end. 📊It is necessary to be cautious in trading during the day to prevent unexpected events or possible one-sided market conditions. Strictly eliminate uncontrollable consequences caused by frequent transactions. 🙅♂️If there are any adjustments, we will notify you before the market opens.
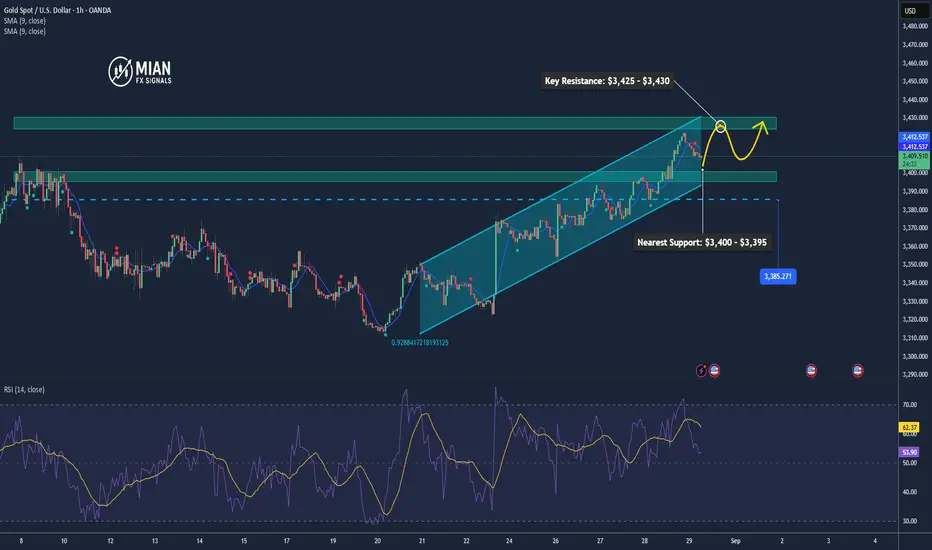
Gold Pulls Back Slightly Ahead of U.S. PCE Data📊 Market Dynamics:
Gold eased to around $3,408/oz due to profit-taking after the recent rally, while investors await U.S. PCE inflation data – a key indicator that could influence the Fed’s rate-cut decision.
📉 Technical Analysis:
• Key Resistance: $3,425 – $3,430
• Nearest Support: $3,400 – $3,395
• EMA 09: Price remains above EMA 09, keeping the bullish bias intact.
• Candlestick / Momentum: H1 candles show long lower wicks around $3,400, signaling potential buying pressure.
📌 Outlook:
In the short term, gold may consolidate around $3,400 and rebound if PCE data reinforces expectations of an imminent Fed rate cut.
💡 Suggested Trading Strategy:
🔻 SELL XAU/USD: $3,427 – $3,430
🎯 TP: 40/80/200 pips
❌ SL: $3,433
🔺 BUY XAU/USD: $3,397 – $3,400
🎯 TP: 40/80/200 pips
❌ SL: $3,394
Gold (XAUUSD) Intraday Analysis – August 29, 20251. Overall Trend
After a strong bullish impulse, gold has completed a harmonic structure (likely a Bearish Gartley / AB=CD) with a clear FVG zone around point C–D. Price recently tested the 3420–3422 resistance and rejected strongly, confirming a short-term correction phase.
For intraday perspective, gold is likely to enter a pullback move to the downside before deciding the next trend.
2. Key Levels to Watch
Resistance:
3420 – 3425 (recent swing high + Fibonacci extension).
3435 – 3440 (major resistance; if broken, the bullish trend may extend further).
Support:
3380 – 3385 (first key support, confluence with FVG + 0.5 fib retracement).
3366 – 3370 (harmonic D-point support).
3350 (psychological support, stronger downside if broken).
3. Technical Indicators
EMA: Short-term EMA (20) is still sloping upward, but price is retesting it – a break may trigger further downside.
RSI (H1): Bearish divergence is forming (price making higher highs while RSI lags).
Volume: Selling pressure increased significantly at the 3420 rejection zone.
4. Intraday Trading Strategy
Short Setup (Primary):
Entry: 3410 – 3415 on pullbacks.
Stop Loss: Above 3425.
Take Profit 1: 3385.
Take Profit 2: 3370.
Buy Setup (Countertrend at Support):
Entry: 3370 – 3380 if price holds with bullish confirmation.
Stop Loss: Below 3350.
Take Profit 1: 3400.
Take Profit 2: 3420.
5. Conclusion
Gold is showing clear rejection at 3422, signaling possible continuation of a short-term pullback. Intraday traders may prioritize short positions from resistance and look for buy opportunities only at strong supports.
Risk management is crucial here, as price is trading in the middle of the range and volatility may sweep stops before the next decisive move.
- Keep a close eye on 3380 – 3385 support zone, as it will be the key level that decides whether buyers step back in or sellers take control.
If you find this analysis useful, don’t forget to follow and save it for future trading strategies.

Interest rate forecast to decreaseMarkets now expect the Federal Reserve to begin cutting interest rates as early as September. Traders have almost fully priced in a 25 basis point cut, with further easing likely in October and December, according to the CME FedWatch Tool.
“Recent U.S. economic data have prompted us to revise our rate forecasts lower,” BofA said, citing signs of a cooling labor market. “Recent weakness in employment data, slowing job growth, and other signs of labor market slack could prompt the Fed to change its risk assessment.”
The bank also said political pressure on the Fed, including criticism from President Donald Trump, could continue to weigh on the dollar.
“The risks to the Fed’s independence are well recognized, but now markets must also factor in the implications of institutional weakness at statistical agencies,” the analysts stressed.

Gold XAUUSD Buy SetupGold is forming a potential buy setup.
If price reaches the FVG zone and the M15 candle closes above the 50% level, a buy entry can be considered.
⚠️ Always wait for candle confirmation and manage risk properly.
Entry Zone: FVG 50% level
Trade: 3430+
Stop Loss: Below FVG zone
Risk/Reward: High probability setup"

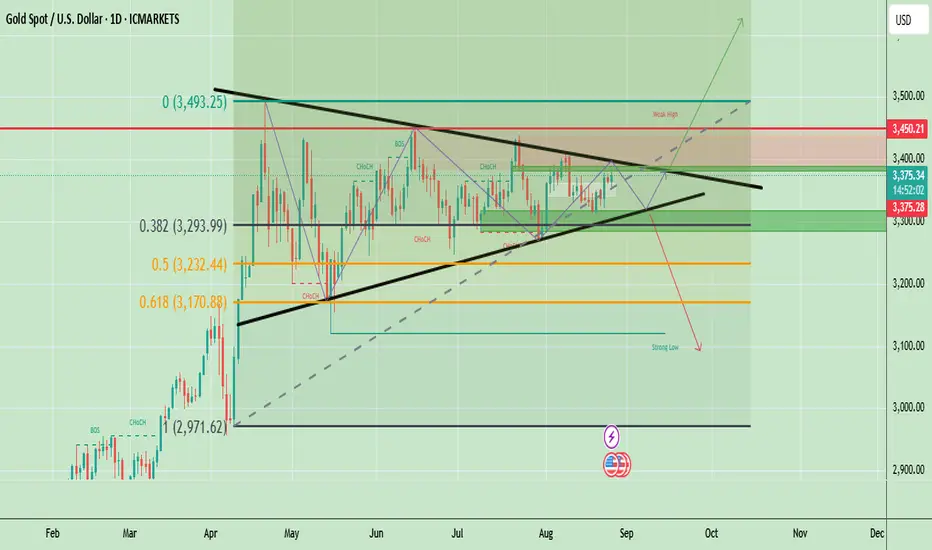
Gold Price Update – Neutral Trend with Key Breakout Levels AheadAs of August 26, 2025, gold (XAU/USD) is trading around $3,375 and remains in a consolidation phase inside a symmetrical triangle. Price is holding between $3,170 support and $3,450 resistance, with $3,493 as a major supply zone. A breakout above $3,450–$3,493 could extend the rally toward $3,600, while a breakdown below $3,293–$3,170 may trigger a decline toward $3,000. Until a clear breakout occurs, the overall trend is neutral with a slight bullish bias due to the long-term uptrend still intact.
🔑 Key Levels to Watch
- Resistance: $3,383 → $3,450 → $3,493
- Support: $3,317 → $3,293 → $3,232
- Breakout Zones: Below $3,293: Opens room to $3,170. Above $3,390: May lead to fresh highs toward $3,450+
Price has been ranging for months between $3,170 (Fib 0.618) support and $3,493 (supply/weak high) resistance. Market structure shows multiple CHoCH (Change of Character) signals, indicating indecision and sideways consolidation.
Gold 1hr Chart
Gold is in an uptrend, but watch $3,378 resistance for breakout confirmation; otherwise, expect a dip toward $3,345–$3,357 before resuming higher.
Buy Zone: $3,345 – $3,357 (ideal retracement support)
Buy Trigger: Break and close above $3,378 (confirmation for upside move)
Note
Please risk management in trading is a Key so use your money accordingly. If you like the idea then please like and boost. Thank you and Good Luck!
Gold Tests $3,401 – Breakout or Pullback Ahead?📊 Market Dynamics:
Gold is trading around $3,401/oz, testing a key technical resistance.
The upcoming U.S. PCE data is in focus, with markets pricing in over 88% probability of a 25 bps Fed rate cut, which supports bullish sentiment for gold.
RBC maintains a long-term bullish outlook, forecasting gold could reach $3,722 – $3,813 by 2025–2026.
📉 Technical Analysis:
• Resistance: $3,401 → $3,416 – $3,435
• Support: $3,374 – $3,389 (pivot $3,350 – $3,375)
• Indicators: RSI has eased from overbought; MA50 still supports short-term upside; overall MA signals: Strong Buy.
📌 Outlook:
• Above $3,401: potential extension to $3,416 – $3,435, possibly $3,440.
• Failure to break: a pullback toward $3,374 – $3,389 is possible.
💡 Trading Strategies:
🔻 SELL XAU/USD
Entry: $3,401 – $3,404
🎯 TP: 40 / 80 / 200 pips
❌ SL: $3,407
🔼 BUY XAU/USD
Entry: $3,394 – $3,398
🎯 TP: 40 / 80 / 200 pips
❌ SL: $3,391
How and why Silver May Overshoot Well Beyond 50 by 2026A description of silver price anomalies. Info is in video-only thing to add is we are going onour 6th consecutive year of silver structural demand deficits. The odds of a massive upside move intensify exponentially day to day at this point.
Do your own research

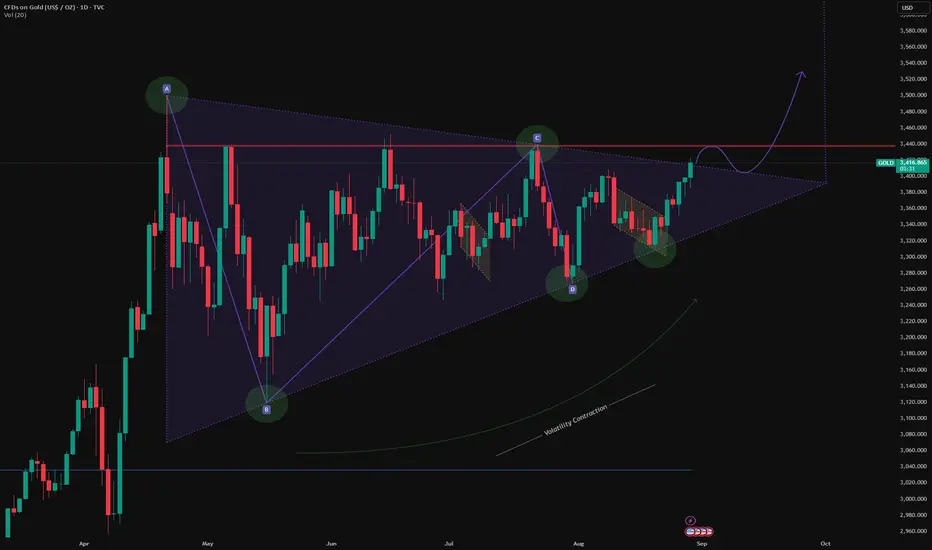
GOLD – Bullish Symmetric Triangle Breakout Targeting 4173GOLD has been consolidating inside a bullish symmetric triangle for the past 4 months, with volatility contracting significantly as the pattern matured.
On the support side, we can clearly identify 3 reversal points.
On the resistance side, price has tested 2 reversal points before finally breaking out to the upside.
The breakout leg shows strong bullish momentum, confirming buyers are in control.
Based on the measured move objective of the triangle, the projected target stands at 4173.
This breakout suggests continuation of the broader bullish trend, with volatility expansion likely to follow.
📊 Key levels to watch:
Support: former triangle resistance now turned into potential support
Stop-loss zone: near the apex of the triangle
Target: 4173
XAU/USD – Near-Term Trade Plan
📍 Current Price: 3416
🔼 Buy Setup
Entry: Above 3425–3430
Target 1: 3450
Target 2: 3480
Stoploss: 3395
🔽 Sell Setup
Entry: Below 3390
Target 1: 3360
Target 2: 3330
Stoploss: 3420
Right now, this is not a strong bullish breakout yet because volume is missing.
If gold closes above the upper trendline (around 3450+) with big volume, that’s a valid breakout → target = height of triangle (~300–400 points).
If it fails near resistance and comes back inside the triangle, expect pullback towards 3300–3250 zone (lower trendline).

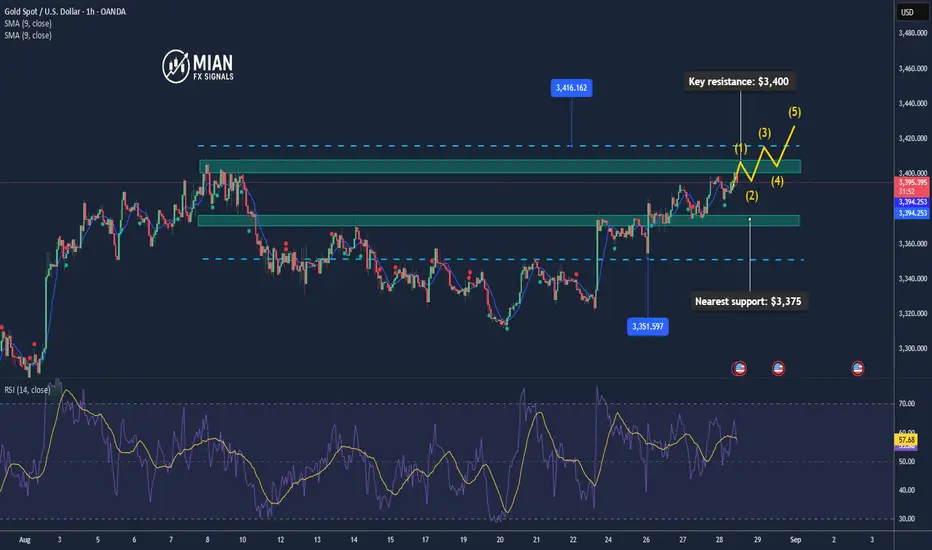
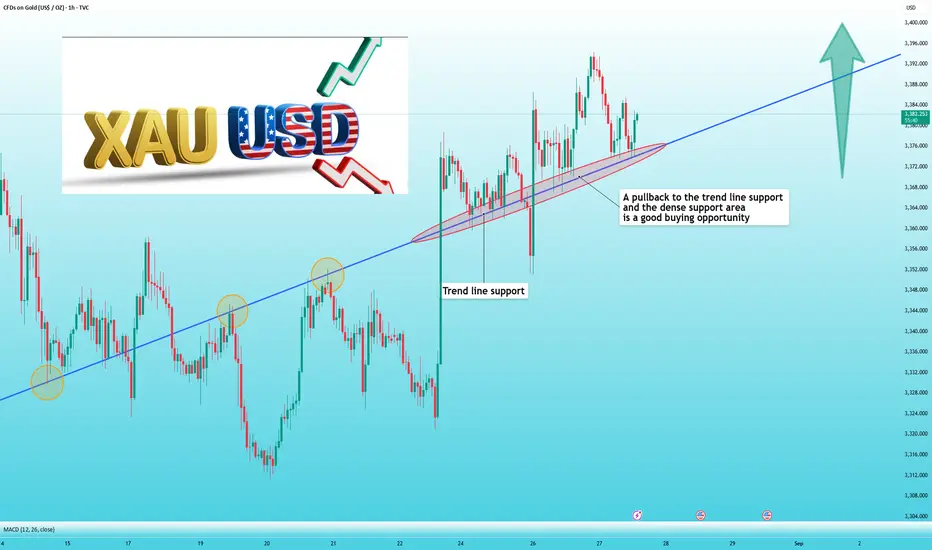
The gold rally is not over yet, stabilizing at 3400 is the keyThis week, Trump once again severely undermined the independence of the Federal Reserve. He has been attacking Chairman Powell for months and now threatens to fire Fed Governor Tim Cook. His actions are all part of his quest to pressure the Fed into cutting interest rates, ultimately forcing his will and ultimately achieving a rate cut, perhaps even a larger one.
Influenced by the Fed's independence and the expectation of rate cuts, gold prices have continued to rise this week, approaching the high of 3,400 points.
I personally believe that as long as gold doesn't fall below 3,350, it's only a matter of time before it breaks above 3,400.
From the 1-hour chart, we can clearly see that gold is steadily rising, supported by the trend line. Buying on a pullback to the trend line is a good opportunity, with a take-profit and stop-loss in place, presents a significant profit opportunity.
Currently, the optimal buying range for gold is between 3,365 and 3,375 OANDA:XAUUSD , with a target price of $10-20 and a stop-loss of $10.
📣If you have different opinions, please leave a message below to discuss
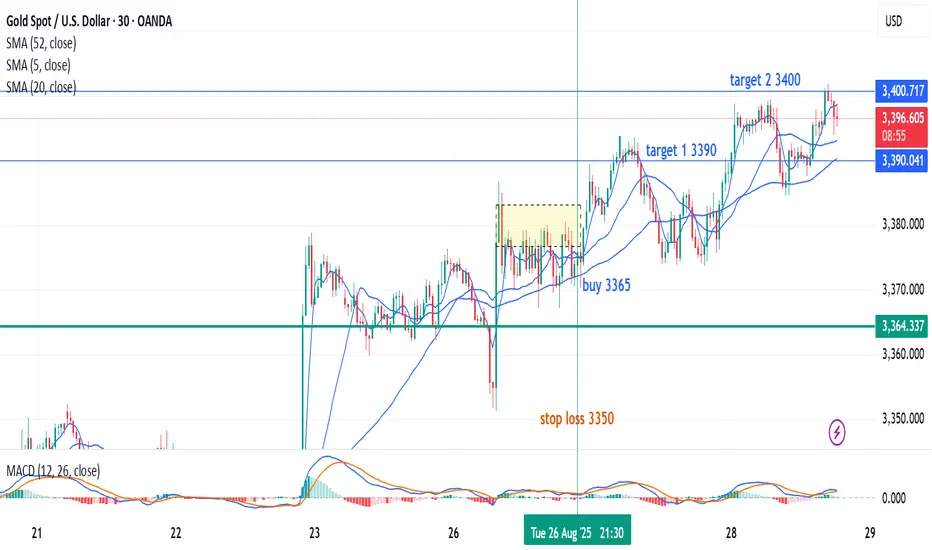
Tue 26 Aug Gold Trade Update - Target 1 and Target 2 reachedOn Tuesday 26 Aug, I shared a gold trade idea (please refer to previous post)
Buy 3365
stoo loss 3350
Target 1: 3390
Target 2: 3400
Target 3: 3420
Target 1 and Target 2 reached !
Hooray !
Target 3 might have some challenge, price might come down before going up again.
Generally speaking, Target 2 can take profit already.
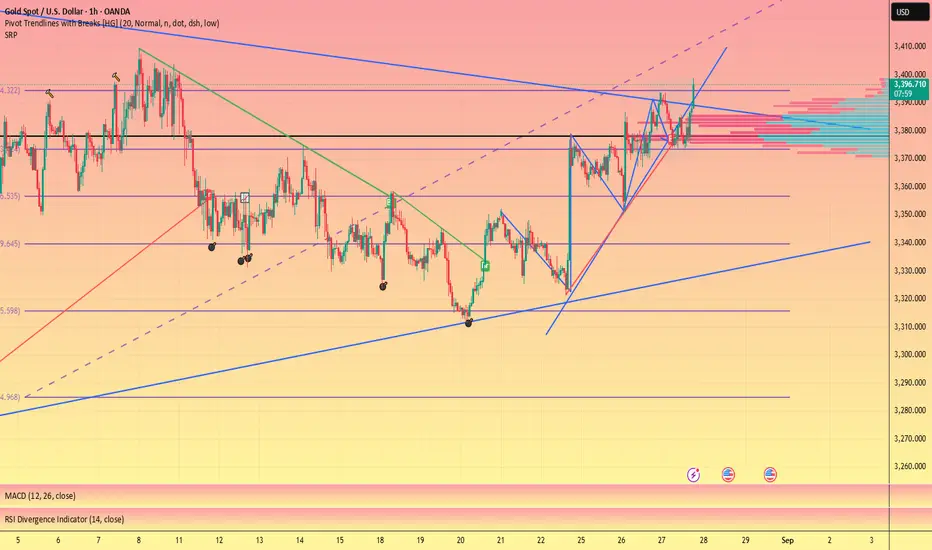
3400, the upper edge of the triangle, is gold long or short?#XAUUSD OANDA:XAUUSD
I reminded you yesterday not to chase the rising prices easily. 💻Gold retreated today as expected, hitting a low near 3385.
Gold is currently in a consolidation phase and has not given a clear trading direction, or it is waiting for the release of initial jobless claims data.📊
As the price of gold rises, the short-term support also moves up. 🌈The focus below is on the 3390-3380 support line. 🥅If it falls back but does not break, you can consider going long.📈 Pay attention to the short-term resistance range of 3402-3412 on the upside. Once it breaks through, it is expected to set a new high. Otherwise, it will maintain a high-level fluctuation pattern during the day.📉

Safe-haven demand continues to hold support.Thus, after several consecutive sessions of increasing to a two-week peak, in response to signals of policy easing from Fed Chairman Jerome Powell as well as Mr. Trump's increasing pressure on the US central bank, gold prices have turned to decrease.
However, the decrease is quite small as safe-haven demand continues to maintain a strong support base.
The US PCE price index (used to measure inflation) released next Friday is expected to guide the gold market, with a consensus forecast of 2.6% for the overall index and 2.9% for the core index.
In the coming time, analysts warn that any erosion in the Fed's independence could boost demand for gold as a policy risk hedge.
In addition, global geopolitical and trade tensions remain persistent and are expected to continue to enhance the safe-haven value of precious metals.
On the afternoon of August 27 (Vietnam time), the US officially raised import tariffs on goods from India to 50%, double the previous rate of 25%, on the grounds that New Delhi continues to buy oil from Russia. This move could threaten trade relations between the US and India - one of Washington's most important partners, while pushing up prices of many commodities.

The probability of a 25 basis point rate cut is 87%.Investors have also bet on two declines in September and December. This limits the room for further declines in the USD, unless the Fed accelerates the pace of interest rate cuts in the rest of the year. However, this possibility is low as almost all Fed members are concerned about rising inflation again.
The decline of the euro also contributed to the USD's rise.
It can be seen that the USD's recovery is not strong enough to reverse the greenback's downward trend, but it has also negatively affected gold prices.
Gold is also under profit-taking pressure after the previous strong increases.
Precious metals are also less attractive when US stocks have positive developments. Stock markets around the world often have extremely active trading in September and October. The strong cash flow into this channel reduces the appeal of the gold market.

GOLD : 1D - X SETUP Hello , Welcome 🙏
We Are Looking X Setup On 1D Timeframe
BUYTRENDLINE + SELL TRENDLINE BREAKOUT
CISD + BUY ENGULFING ZONE
BUY ZONES ⬇️
3376 / 3360 - 3355 / 3350 - 3330
Good Luck With Your Trading

If it doesn't break 3400, be wary of a possible pullback#XAUUSD
Gold continued its upward trend tonight, consolidating again near 3390. Don't chase the rally at high levels!📊
Gold is near the upper edge of a convergent triangle.📐 As I told you before, whether it can effectively break through the edge of the triangle will determine the subsequent trend of gold in the short term. ⚖️
If it fails to effectively break through the upper range of 3395-3410 in the short term, then gold may still have the possibility of a pullback. 📉Otherwise, upward momentum will be fully opened. Exercise caution in evening trading.💻
There will be initial unemployment claims data tomorrow, so please pay attention to it.
XAUUSD Gold Intraday Analysis 27 Aug, 2025Gold continues to trade inside an ascending channel, holding bullish structure as long as the trendline support remains intact. Price is currently consolidating near the midline, with immediate support seen at 3375–3377. A successful retest and hold of this zone would confirm continuation toward the channel highs.
Upside targets remain at 3401, aligning with the upper boundary of the structure, while downside risk is limited to a break below 3366, which would invalidate the bullish scenario and open the door for a decline toward 3351.
Trade Idea:
Buy from 3375–3377
TP 3401
SL 3366.
