Gold Short-term: Selling Pressure Increases After Breaking 3340📊 Market Overview:
Gold broke 3340 due to strong selling pressure following hawkish Fed comments and strong USD data. Investor sentiment leans defensive, pushing gold down to 3328.
📉 Technical Analysis:
• Key resistance: 3335–3340
• Nearest support: 3320–3315
• EMA: Price below EMA09 → short-term bearish trend
• Candlestick / volume / momentum: Strong red candles with increasing volume indicate sustained selling pressure
📌 Outlook:
Gold may continue to decline in the short term if it fails to reclaim 3340, targeting support around 3320–3310.
💡 Suggested Trading Strategy:
🔻 SELL XAU/USD : 3335–3338
🎯 TP: 40/80/200 pips
❌ SL: 3340
🔺 BUY XAU/USD : 3319–3322
🎯 TP: 40/80/200 pips
❌ SL: 3315
Goldlong

Gold Price Analysis August 22The gold market in recent sessions has shown a rather weak bullish force, so the possibility of a decline at the end of the week is worth noting. Currently, the price is still fluctuating in the important border zone of 3359 - 3330.
Notable points:
3330 is still a key support zone. However, it is advisable to wait for a clear confirmation signal from the candle before taking action to avoid falling into the False Break trap.
When 3330 is broken, the buying reaction may only appear around 3303.
Absolutely limit trading against the trend when there is a clear breakout signal.
🎯 Reference strategy:
SELL: Activate when the price breaks and maintains below 3330 → Target 3285.
BUY: When the candle closes above 3340 → Target towards 3380.

XAUUSD Idea TVC:XAU is farming triangle and if it break then we will wait for retest but tomorrow is also something so we should wait for it

Gold Breakout Ahead of FOMC – Next Step Trading PlanGold Breakout Ahead of FOMC – Key Levels & Trading Plan
Gold surged strongly in line with MMFLOW’s previous outlook, breaking through short-term resistances and the descending trendline within just one session. This early breakout ahead of the FOMC meeting signals that bullish momentum is firmly in play.
Even though price moved before the actual FOMC release, the market confirmed our directional bias: after clearing liquidity below, Gold quickly bounced back, reclaiming higher zones. With positive fundamentals supporting the metal in the long run, the bullish case for XAUUSD remains intact.
Currently, structure shows a clean breakout of the bearish channel, and we are waiting for a retest of KeyLevels today to fuel the next bullish leg.
📊 MMFLOW Market Outlook
Primary Bias: Bullish – Buy the dips
Scenarios:
🔹 Buy opportunities near strong support levels
🔹 Tactical sells only at confirmed resistance with rejection
Daily chart left a strong bullish confirmation candle, suggesting that pullbacks are opportunities to reload long positions.
🔥 Trading Plan – Buy/Sell Zones & Scalp Strategy
✅ BUY SCALP
Entry: 3333 – 3331
Stop Loss: 3327
Take Profit: 3338 – 3343 – 3348 – 3352 – 3356 – 3360 – ???
✅ BUY ZONE (Swing/Position)
Entry: 3316 – 3314
Stop Loss: 3310
Take Profit: 3320 – 3325 – 3330 – 3335 – 3340 – 3350 – 3360 – ???
🔻 SELL ZONE
Entry: 3368 – 3370
Stop Loss: 3375
Take Profit: 3364 – 3360 – 3355 – 3350 – 3345 – 3340 – 3330
📌 Key Levels to Watch
Supports: 3332 – 3323 – 3315
Resistances: 3348 – 3362 – 3370 – 3383
🚨 Risk Note:
If price dips too deep into 331x, beware of potential liquidity traps. Always respect your TP/SL as volatility remains high around FOMC events.
✨ MMFLOW Reminder:
👉 KeyLevels = Profits.
👉 Buy the dips, ride the bullish pump.

XAUUSD Gold Intraday Setup 21.08.2025Gold has broken out of its bearish channel and is now showing signs of retesting the broken trendline. Price action suggests that the 3332/34 zone (highlighted with confluence from structure support and channel retest) will be key for buyers to step in. As long as price holds above this area, bullish momentum is likely to resume.
The target at 3357 aligns with previous resistance, making it a logical upside objective. A stop-loss below 3323 protects against a deeper retracement back into the bearish structure.
Trading Plan (Buy Setup):
Entry: 3332/34
Stop-Loss: 3323
Target: 3357

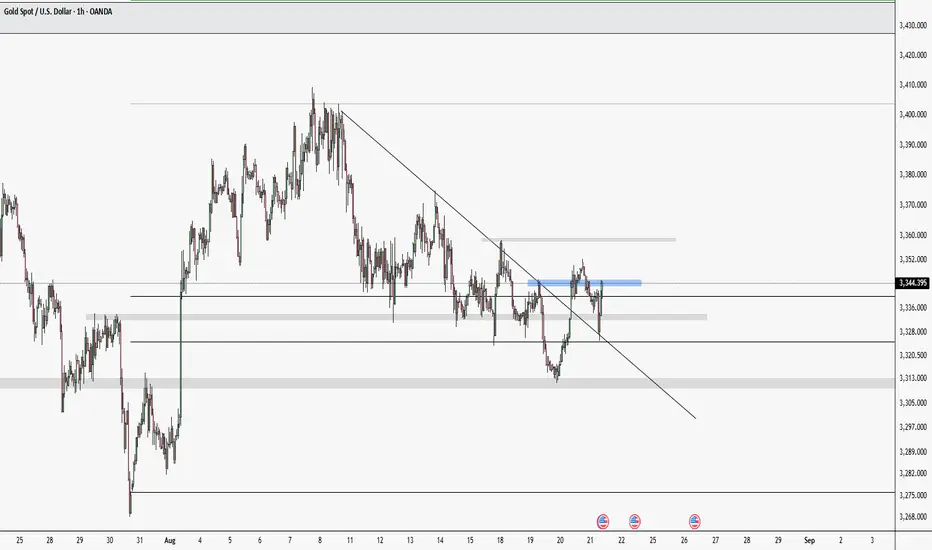
Bullish expectations - Gold range - Possible ATH move (1H)Making 1H & 4H accessible for full breakdown
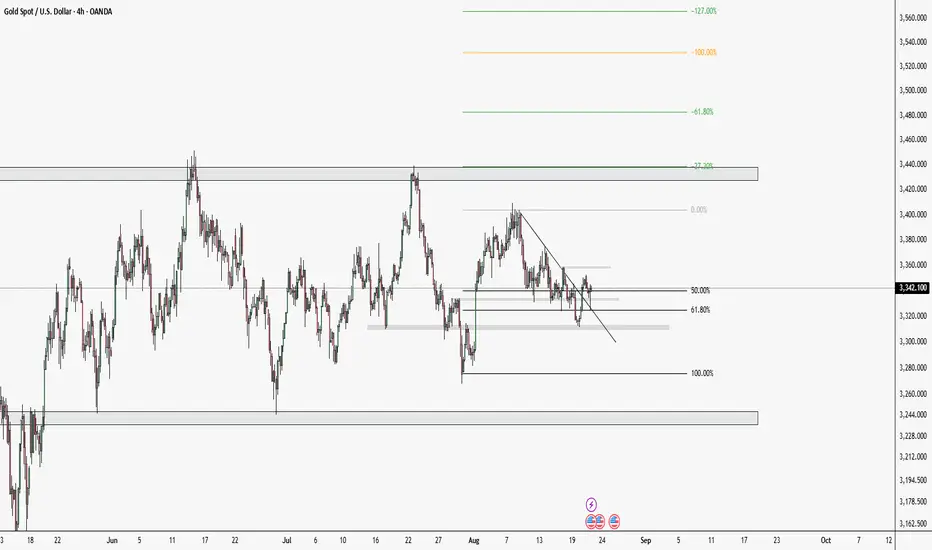
Based off the data from the intraday timeframes, 4H and 1H, I believe we have a possibility of gold continuing it's push to the widely expected 3500 price point.
On the 1H we have been on a minor downtrend as of late in what appears as a retracement from the high created on the 4H from dates July 09 - 22. From July 22-30 we can clearly see a retracement on the 4H to the 3270 area, which is respecting the 3280 area created July 9. Since that point we have ranged within the daily range with no lower lows being created.
As of August 19, we respected 3311, which is a common level of support/ rejection throughout the daily range. Looking at August 19, we respected that area as well with a healthy rejection once again. Referring back to the 1H, we can see August 17 & August 21 holding price around 3326. As long as we see a failure and a higher high created on the 1H and potentially the 4H we can expect more bullish expansion.
Referring back to the 4H, planting the fib at the highs and lows mentioned for the 4H before, the 100% expansion/target aligns w/ price making a HH & the 3500 being breached. As of right now, pa(y)tience is our best option until PA provides more definitive information before potential swings.
A small rebound is not a trend reversal, continue to short#XAUUSD
Gold was stimulated by news yesterday and hit a high of 3352 at one point, but failed to effectively break through and stabilize above it. In the short term, it did not completely reverse the unilateral trend.📊
At present, gold continues to fall and rebounds after testing the effectiveness of the support level of 3330-3320 below. 📈In the short term, pay attention to the 3350 mark above.🌈 Once it breaks through and stabilizes above 3355, it is expected to test the resistance near the previous high of 3370.📉
On the other hand, if gold fails to maintain a firm footing above this level, it will likely remain volatile in the short term.↘️
This is why I didn't immediately follow up with a short position after closing my short position near 3335, 🤔opting instead to wait and see the market. 👀Gold has been fluctuating repeatedly recently. Please be cautious when trading and beware of falling into traps set by market makers.🎁
Bullish expectations - Gold range - Possible ATH moveBased off the data from the intraday timeframes, 4H and 1H, I believe we have a possibility of gold continuing it's push to the widely expected 3500 price point.
On the 1H we have been on a minor downtrend as of late in what appears as a retracement from the high created on the 4H from dates July 09 - 22. From July 22-30 we can clearly see a retracement on the 4H to the 3270 area, which is respecting the 3280 area created July 9. Since that point we have ranged within the daily range with no lower lows being created.
As of August 19, we respected 3311, which is a common level of support/ rejection throughout the daily range. Looking at August 19, we respected that area as well with a healthy rejection once again. Referring back to the 1H, we can see August 17 & August 21 holding price around 3326. As long as we see a failure and a higher high created on the 1H and potentially the 4H we can expect more bullish expansion.
Referring back to the 4H, planting the fib at the highs and lows mentioned for the 4H before, the 100% expansion/target aligns w/ price making a HH & the 3500 being breached. As of right now, pa(y)tience is our best option until PA provides more definitive information before potential swings.
H4 GOLD BUY Gold Give A Bullish Fvg After Big Falling So We Are Expecting A Bullish Setup Also Its Filled The Below IFVG And Break The Buy Trendline So Now We Will Buy Now Targeting Previous High Lets Goo For It
FOLLOW US FOR MORE TRADES
TRADE IN DEPTH MARKET

XAUUSD: Trade Long GoldI will open a long position on gold again until the specified area reaches 3385-3387. I hope you are successful and profitable.

Gold Holds Steady Amid Consolidation Phase📊 Market Overview:
Gold is holding steady around $3,342/oz, slightly lower by ~0.1% as investors await Fed Chair’s speech at the Jackson Hole symposium. Meanwhile, geopolitical risks continue to support gold as a safe-haven asset.
📉 Technical Analysis:
• Key Resistance: $3,350 – $3,435
• Nearest Support: $3,300 – $3,310 (100-day MA)
• EMA: Price is trading above the 100-day MA but still below the 200-hour MA, signaling short-term recovery momentum but resistance ahead.
• Candle / Momentum: Market remains in a tight consolidation range; RSI shows potential cooling before the next move.
📌 Outlook:
Gold may edge higher in the short term if the Fed signals a dovish shift (rate cut), targeting the $3,400 zone. If policy remains unchanged, gold could consolidate further or retrace toward $3,300.
💡 Trading Strategy Suggestions:
🔻 SELL XAU/USD : $3,370 - $3,373
🎯 TP: 40/80/200 pips
🛑 SL: $3,376
🔺 BUY XAU/USD : $3,310 – $3,313
🎯 TP: 40/80/200 pips
🛑 SL: $3,307

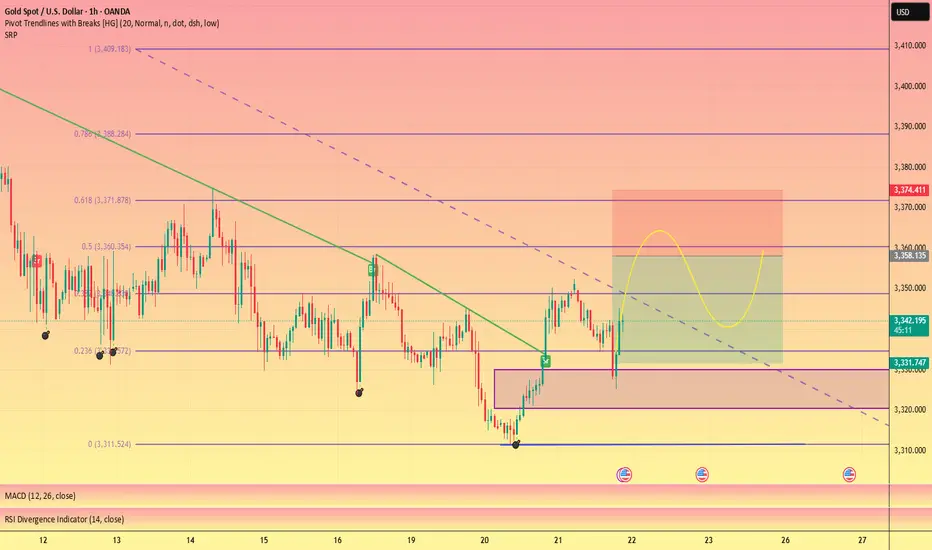
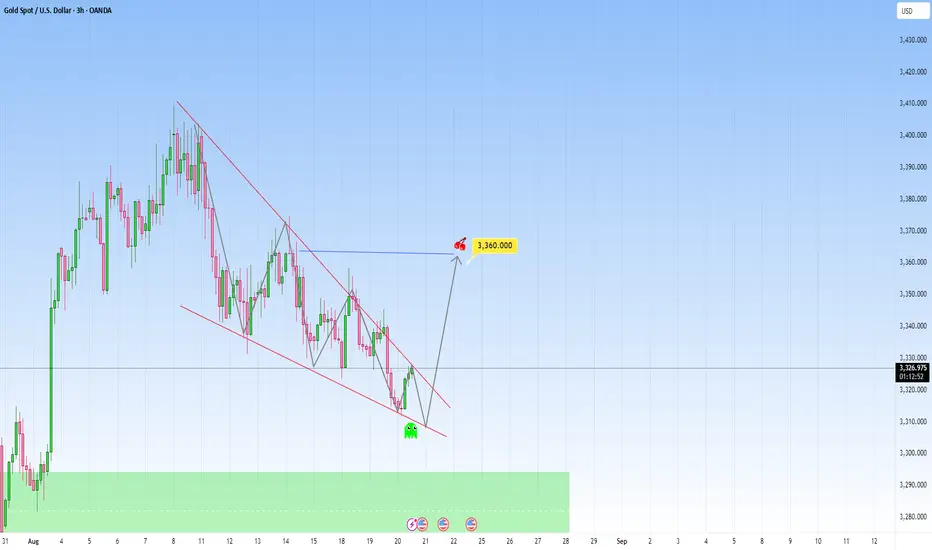
Gold in a falling wedge pattern: Ready for a strong ride upPrice on XAUUSD looks quite interesting right now, this recent has brought a new look to it, as it's forming a more optimistic pattern.
The most recent interaction here is particularly interesting, because it's already showing early signs of recovering and decreased bearish momentum. What may follow: low-volume candles suggesting exhaustion and potential upwards.
My target would be toward 3360. If this move plays out, it will make a beautiful play of a narrative that’s we've been following for Gold.
This setup is so compelling. It’s a story being shown, but still requires patience and confirmation.
Though a scenario for more downside is possible as we have a clear support zone below. Still, I am taking the side for more upside because of the pattern forming here.
XAUUSDHello Traders! 👋
What are your thoughts on GOLD?
Gold remains trapped in a tight consolidation range between key support and resistance zones.
In the short term, the ongoing decline is expected to extend toward the support area, where a bullish reaction may occur.
As long as price stays within this range, the optimal strategy is to buy near support and sell near resistance.
A clear breakout above resistance or below support is needed to confirm the next directional move
Don’t forget to like and share your thoughts in the comments! ❤️

XAUUSD/SELLAfter the release of the Federal Reserve minutes yesterday, gold prices rose to 3352 but didn't rise further. The minutes mentioned several key points, namely inflation and unemployment. Overall, the unemployment rate is more important than the inflation rate. Meanwhile, the renewed talks between Russia and Ukraine seemed uneventful, and the meeting went smoothly. As a result, gold prices fell again after the Asian market opened.
The current price is 3337, down approximately $15/ounce from 3352, indicating that upward pressure remains. During this pullback, we need to watch whether the decline can be halted around 3330-3335. If not, we need to wait for a lower level, around 3310. Today is Thursday. Focus on the impact of the initial jobless claims data on gold prices.
For trading, you can still refer to the current selling strategy. While waiting for a decline, confirm the presence of support below. Currently, there is no major news to boost gold prices. Remember to manage your trading risk. Set take-profit and stop-loss orders to prevent extreme market fluctuations from adversely affecting your account.

XAUUSD/BUYIt seems that bulls have seized a good opportunity. 3345 appears to have stabilized. Long positions can be more firmly established.
Buy at 3345, TP3360, SL3330

XAUUSD/BUYSure enough, gold prices rebounded after retreating to 3338, resulting in a short-term price increase of $8 per ounce.
The gold market is awaiting news to drive a rally. Just now, when it was about to hit 3350, it retreated. I interpret this as a tentative rise, as bulls are currently in control. This test is merely a test to see if bears will launch a counterattack. As expected, the bull-bear game is a tug-of-war. Both bulls and bears are now vying for the crucial 3345 level. This level serves as a short-term reversal point for the month. If bulls seize this level, the market will continue to rise. If bears seize this level, the market will experience short-term downward fluctuations.
In the latter half of the New York market, I believe the market will fluctuate within a range of approximately $10. The Swing Trading Center recommends continuing to buy.

XAUUSD/BUYAfter the New York market opened, the gold price hit 3350 before retreating. This indeed reached the profit target set by the swing trading center. The current price has retreated to 3342, but the decline has not continued. This is because the previous resistance level of 3345 has formed a certain support level after breaking through this level and then retreating. In short, the short-term focus should be on whether the 3340-3345 range stabilizes. If so, gold prices may rise again after the upcoming Federal Reserve news.

Gold Break Strong After Liquidity Sweep Next Target Before FOMCXAUUSD Update | Gold Breaks Strong After Liquidity Sweep – Next Target Before FOMC
Gold has made a powerful bullish comeback, exactly as anticipated in the MMFLOW Trading Plan. After clearing liquidity below, price quickly reversed and is now showing strong buying pressure. This move was no surprise, as the current market structure clearly supports a bullish breakout – and today we may even see price break above the H1 downtrend line ahead of the FOMC statement.
📈 Active Buy Entries from Plan:
✅ Buy 3314 → Now +340 PIPS
✅ Buy 3318 (DCA) → Now +300 PIPS
✅ Buy 3325 (DCA) → Now +230 PIPS
👉 For now, traders should stick with the bullish momentum. Short positions should only be considered if there is confirmed sell volume.
🔑 Key Trading Levels:
📍 3370 – Major level to watch for potential SELL setups.
Market reaction around this zone will be crucial, especially before FOMC, which is expected to bring high volatility.
⚡️ Trading Tip: Follow the trend, respect KeyLevels, and manage risk carefully. With FOMC around the corner, the market could deliver explosive opportunities.
✨ Once again – KeyLevels = Profits ✅

GOLD H4 SETUPGold Buy H4
Buy At Order Block Price 3300 / 3280
Lets Go A Clearly Looking Buy Setup
Target. 3430
Longterm Gold Setups
Try To Hold The Trade And Manage Your Trade Properly

GOLD: Falling Wedge, Time To Buy?My overall bias is still bullish. HL was formed above 3305. We did get a deeper pullback. Price tapped into H4 demand zone 3322–3332 which has a bullish FVG confluence. Sell-side liquidity below 3332 was swept.
✅ Primary Breakout Entry (conservative, higher probability)
Trigger: M15 break + close above 3352
Entry on retest: 3348–3352
SL (use your own discretion)
TP1 3362
TP2 3372
TP3 3400

GOLD: Squeeze to Rate Cut, then Blast-Off to $4200?The price of gold, a classic safe-haven asset, is currently in a state of flux due to several interconnected factors. Looking at future events and fundamentals, we can anticipate how they might impact its price points.
Powell's Rate Cut
An anticipated rate cut from Federal Reserve Chairman Jerome Powell on 17SEP25 is a key bullish signal for gold. Lower interest rates typically decrease the opportunity cost of holding non-yielding assets like gold, making them more attractive compared to interest-bearing bonds. If JPow begins to drop rates in September (and is dovish in comments regarding further cuts), we could begin to see the beginning of gold's next measured move to around $4200 (see purple target). If JPow doesn't cut, doesn't cut enough, or cuts but is extremely hawkish towards further cuts; expect a pullback towards the 200-day moving average and further ranging for a period until the next Fed Chairman is confirmed.
President Trump has recently called for the Federal Reserve to make significant cuts; in one instance stating that rates should be lowered by three percentage points from their current range. As of 19AUG25, Treasury Secretary Scott Bessent has indicated 11 possible candidates for the next Fed Chair position; expect that when confirmed, the next Fed Chair may significantly reduce rates (but do not assume the next Fed Chair will cut as deep as three percentage points).
BRICS Monetary Competition
Additionally, the push for de-dollarization by BRICS nations is a significant long-term driver for gold. Countries like China and Russia are actively increasing their gold reserves to diversify away from the U.S. dollar, creating sustained demand. This monetary competition fundamentally alters gold's role, positioning it as a key component of a new, multi-polar financial system. As central banks continue to accumulate gold, it strengthens the metal's standing as a universal reserve asset. This trend is likely to provide a strong floor for gold prices around its 200-day moving average, and any significant moves toward a gold-backed BRICS currency could lead to a monumental re-evaluation of gold's value, potentially pushing its price to the $4,000/oz range or higher over time.

GOLD H2 MAPPINGGold Taking Sell Sides Liquidity In Today Range So We Are Expecting Also The Below Liquidities
Then We Are Expecting A Bullish Rally Setup On Order Block A High Probability Setup With 90% Accuracy
So Lets Talk About Entry And Target , SL
ENTRY OB BOX AREA : 3300 , 3285
TP LEVELS 200 / 700 PIPS HOLD TARGET
SL AREA : 3267 , 3255
Manage Your Trade Properly And Follow Us For More Trades

XAU/USD) Bullish trend analysis Read The captionSMC Trading point update
Technical analysis of Gold (XAU/USD) on the 4H timeframe based on Smart Money Concepts (SMC).
---
Technical Breakdown – Gold (4H)
1. FVG (Fair Value Gap) Demand Zone
Price is approaching a demand/FVG zone around $3,315 – $3,320.
This is where institutional buying interest is expected to step in.
2. Market Structure
The overall move suggests that the market is making a retracement into demand before a potential bullish continuation.
The bullish projection is supported by price rejecting from the imbalance zone.
3. Bullish Scenario
After a dip into the FVG zone, price is expected to rebound upward strongly.
Two upside target points are marked:
Target 1: $3,374.75
Target 2: $3,408.53
4. Trading Plan Idea
Entry: Around $3,315 – $3,320 (inside FVG).
Stop Loss: Below $3,300 (to protect against deeper liquidity sweep).
Take Profit 1: $3,374.75
Take Profit 2: $3,408.53
Mr SMC Trading point
---
Summary
Bias: Bullish
Reason: Price approaching FVG demand zone + liquidity setup.
Setup: Wait for rejection/confirmation inside demand → Enter long → Target higher liquidity zones.
Please support boost 🚀 this analysis)
