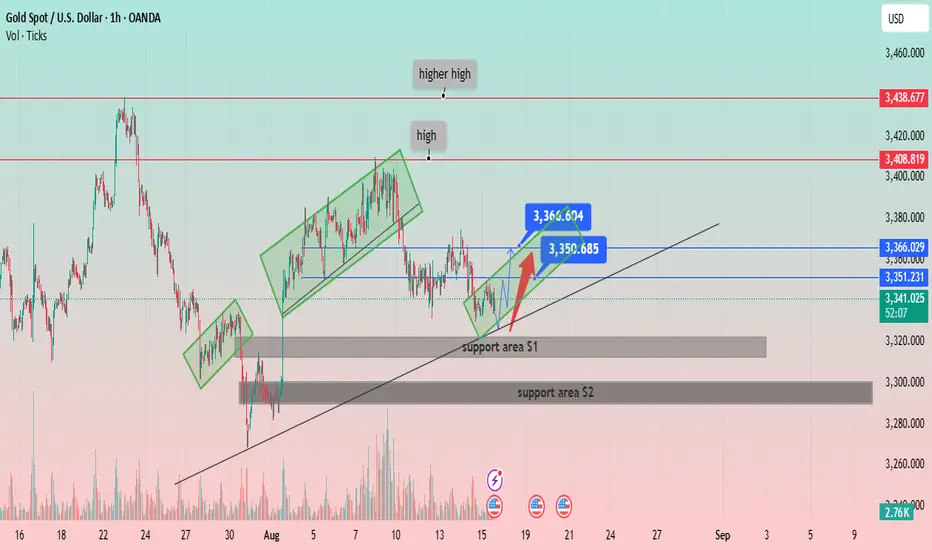
XAU/USD) Bullish trend analysis Read The captionSMC Trading point update
Technical analysis of Gold (XAU/USD) on the 4H timeframe based on Smart Money Concepts (SMC).
---
Technical Breakdown – Gold (4H)
1. FVG (Fair Value Gap) Demand Zone
Price is approaching a demand/FVG zone around $3,315 – $3,320.
This is where institutional buying interest is expected to step in.
2. Market Structure
The overall move suggests that the market is making a retracement into demand before a potential bullish continuation.
The bullish projection is supported by price rejecting from the imbalance zone.
3. Bullish Scenario
After a dip into the FVG zone, price is expected to rebound upward strongly.
Two upside target points are marked:
Target 1: $3,374.75
Target 2: $3,408.53
4. Trading Plan Idea
Entry: Around $3,315 – $3,320 (inside FVG).
Stop Loss: Below $3,300 (to protect against deeper liquidity sweep).
Take Profit 1: $3,374.75
Take Profit 2: $3,408.53
Mr SMC Trading point
---
Summary
Bias: Bullish
Reason: Price approaching FVG demand zone + liquidity setup.
Setup: Wait for rejection/confirmation inside demand → Enter long → Target higher liquidity zones.
Please support boost 🚀 this analysis)
Goldlong

Gold 15M OB Reaction – Targeting 3355Price is currently trading around the $3,333 level after reacting to the M15 and M5 Order Blocks (OB). The market is showing signs of a potential reversal from this demand zone, supported by the break of the descending trendline.
Entry Zone: Price is mitigating the M5 OB within the larger M15 OB.
Targets:
TP1: $3,339 – aligned with local liquidity ($$$) and previous highs.
Final TP: $3,357 – a major liquidity zone and supply area.
If price holds above the OB, we can expect bullish continuation towards TP levels. However, a break below $3,323 would invalidate this setup and signal deeper downside.
📊 Bias: Bullish (as long as OB holds).

Gold Is Consolidating in the Short Term📊 Market Developments:
Spot gold is hovering around $3,337/oz, as investors await Fed Chair Powell’s remarks at the Jackson Hole symposium (Aug 21–23) for signals on possible rate cuts. Meanwhile, geopolitical updates on U.S. diplomacy in Ukraine also influence sentiment.
📉 Technical Analysis:
• Key Resistance: $3,380/oz
• Nearest Support: $3,330–$3,335/oz
• EMA 09: Price is consolidating near support, no clear direction yet.
• Candlestick / Volume / Momentum: Neutral, waiting for fresh catalysts.
📌 Outlook:
Gold may range or edge higher short-term if the Fed signals dovishness. Otherwise, a pullback toward support remains likely.
________________________________________
💡 Trading Strategy Suggestion:
🔻 SELL XAU/USD at: $3,377–$3,380
🎯 TP: 40/80/200 pips
🛑 SL: $3,383
🔺 BUY XAU/USD at: $3,330–$3,333
🎯 TP: 40/80/200 pips
🛑 SL: $3,327

Detailed Gold AnalysisOverview: Gold is trading near 3340, consolidating near the apex of the symmetrical triangle pattern after recent bearish breakout. Prices successfully hold the key 3330 support. A breakout above the apex could open the path toward 3355 (Fib 0.382) and further toward the 3365 level.
Biasness: Gold might gain bullish support as optimism over potential peace talks between Russia and Ukraine is getting fade gaining safe-haven flows. Uncertainty around geopolitical developments and the weakness in US dollar will also support strong upside momentum.
Key Levels: R1- 3355 R2- 3365
S1- 3330 S2- 3300
Technical Analysis: The RSI is recovering from oversold territory around 46, suggesting early bullish momentum, while Bollinger Bands are tightening, indicating a potential volatility expansion ahead. Volume remains moderate but shows spikes near support levels, hinting at buyer interest. Overall, intraday traders should watch the triangle breakout direction, as it will dictate the next leg.
Data Releases: No major data releases are scheduled today, keeping gold steady as traders look ahead. Market participants now await tomorrow’s U.S. housing starts data for fresh direction.
Alternative Scenario: On the downside, a failure to hold above 3330 risks a drop toward 3298–3267.
While writing the report, gold is trending at 3340

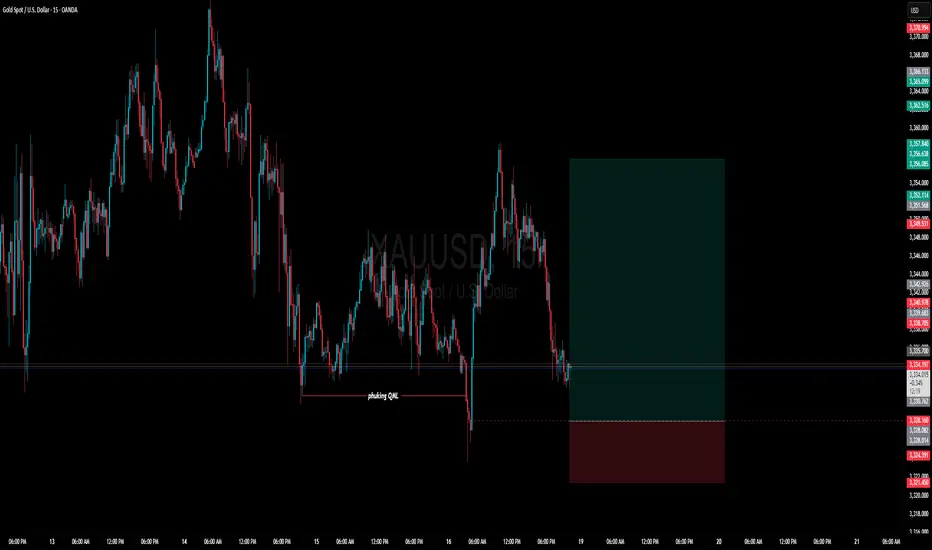
XAUUSD m15 CHART, Sharing a bullish phuking setupA bullish Quasimodo is forming — the last Lower Low created by the market is showing a good Order Block on the M5 timeframe. If this OB was standing alone, I wouldn’t consider it valid. But since it aligns with the last LL according to the QML structure, this OB can be valid. Keep SL tight.
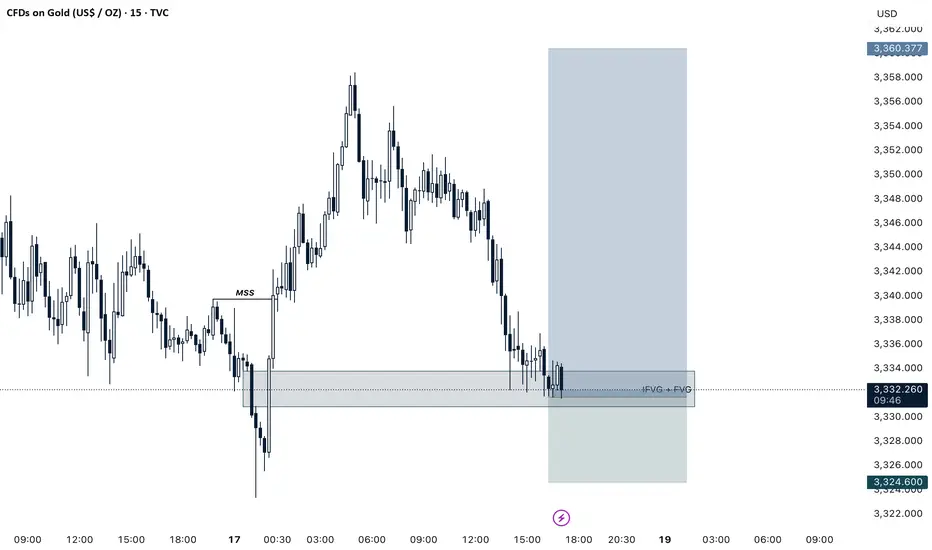
MSS + IFVG + FVG GOLD BUY SETUPGold Looking For Bullish With A Strong Setup
Strategy : MSS + IFVG + FVG
Lets Take Buy Trade Now Target 3360
Entry Price CMP
Manage Your Trades Properly And Follow Us For More Trades
XAUUSD: Elliot Wave Analysis 15 minHello friends, if you are viewing the gold chart on the 15-minute time frame, it seems that based on Elliott waves, we will have an upward wave towards 3389, followed by a continuation of wave C towards 3306, and then we need to see in which direction the trend will move.

Gold Recovers as Rate-Cut Hopes Strengthen📊 Market Summary:
• Gold (XAU/USD) rose slightly +0.5% to ~$3,350.55/oz, supported by growing expectations of Fed rate cuts and lower U.S. bond yields, which boosted safe-haven demand.
• However, easing geopolitical tensions have reduced strong safe-haven flows, putting mild pressure on gold.
📉 Technical Analysis:
• Resistance Levels:
• $3,400 – immediate resistance
• $3,420 – next key resistance if $3,400 is broken
• Support Levels:
• $3,330–$3,335 – strong support zone
• $3,310 – secondary support if $3,330 fails
• EMA & MAs: Price is holding above most short-term EMAs/MAs (MA5, MA10, MA20 → bullish; only MA200 remains bearish) → trend still bullish.
• Momentum Indicators: RSI ~62 (positive), Stoch & MACD remain bullish, ADX ~30 confirms a relatively strong trend.
📌 Outlook:
• Short-term: Gold could retest $3,400–$3,420 if dovish Fed signals and low yields persist.
• Risk: A hawkish Fed tone or easing geopolitical risks could drag gold back down toward $3,330 and possibly $3,310.
💡 Trade Strategy:
🔺 BUY XAU/USD: $3,330–$3,333
🎯 TP: 40/80/200 pips
❌ SL: $3327
🔻 SELL XAU/USD : $3,402–$3,405
🎯 TP: 40/80/200 pips
❌ SL: $3,408

XAUUSD (Gold) 1H – Buy Setup From Key Support ZoneGold has recently pulled back after multiple rejections from the $3,389 – $3,390 resistance zone, showing sellers stepping in. Price is now approaching a key demand area around $3,309, where buyers previously defended aggressively.
📉 If price taps into the $3,309 support zone, we anticipate a strong bullish reaction that could drive price back toward the $3,390 resistance.
🔑 Trade Idea
Entry: $3,309 zone (confirmation of bullish rejection)
Stop Loss: Below $3,265
Take Profit: $3,389 – $3,390
Risk–Reward Ratio: ~1:3
📊 Technical Breakdown
🔵 Support Zone: $3,309 – Key structure level where bulls defended in the past.
🔵 Resistance Zone: $3,389 – $3,390, strong rejection area marked by multiple failed breakouts.
✅ Bias: Bullish from support to resistance, unless $3,309 breaks.
⚠️ Invalidation: A clean breakdown below $3,265 would flip bias bearish toward $3,200.

Gold (XAU/USD) 15m Chart AnalysisGold is currently holding above the 3,345 support zone, aligned with the 200 EMA (blue line). Price tested this support area and showed a bullish reaction, indicating potential demand.
🔑 Key Levels:
Support: 3,344 – 3,345 zone
Resistance: 3,357
📈 Bias:
If price sustains above the highlighted demand zone, we may see a bullish continuation toward the 3,357 resistance level. The projection suggests a possible pullback before continuing higher.
⚠️ Watch out:
A clean break below 3,344 could invalidate this setup and open the way for further downside.

Wait for pre-meeting guidance, focus on 3343-3330#XAUUSD
The current market focus is mainly on the upcoming talks.🤝 As expected, the news of the meeting between Trump and Putin was leaked over the weekend. 💻We still need to wait and see the news in the next two days to see whether the Russia-Ukraine war issue can be effectively resolved. 💠
If peace talks between the two sides can be effectively facilitated and risk aversion is reduced, gold will remain weak.🐻 Conversely, if the talks fail, a retaliatory bullish rally is highly likely.📈
Last Friday, gold prices fluctuated very narrowly, failing to find a valid trading point. ⚖️The early morning opening at a new low not only effectively allowed short sellers to exit their positions,😝 but also allowed market makers to reap the profits of last week's long traders😩.
Since the short sellers have all taken profits in the early trading session, there must be greedy people and traders seeking revenge in the market who will take over and short sell at low levels,📊 otherwise gold would not have risen so quickly. 📈
So, theoretically speaking, before the talks are concluded, I think the market will definitely eliminate the traders who shorted at the low level this morning.🐂
The overall hourly line is still under pressure at the high resistance line of 3358.💥 We will first see whether it can fall below 3343 in the European session. 🐂Only after it breaks will it test the small support of 3330. Otherwise, the bulls will still have to counterattack at a low position. Today, we will mainly go long at a low level.📈
🚀 BUY 3343-3330
🚀 TP 3355-3365-3370

Gold (XAUUSD) Intraday Analysis – August 18On the H1 timeframe, gold is trading around 3,348 – 3,350 USD/oz after a short-term rebound from support. Price action and technical signals suggest the following:
1. Market Structure
The short-term trend remains bearish with lower highs being formed.
Price tested the EMA 100–200 resistance zone but failed to break above.
The previous gap zone has acted as an important pivot area.
2. Key Support & Resistance Levels
Immediate Resistance: 3,355 – 3,358 (EMA200 + supply zone)
Major Resistance: 3,370 – 3,380 (resistance area)
Immediate Support: 3,344 – 3,345
Strong Support: 3,330 – 3,320 (support zone aligned with Fibonacci 61.8%)
3. Technical Indicators
EMA 20–50: slightly turning upward, but still below EMA200 → suggesting only a corrective bounce.
RSI H1: around 55, showing room to move lower.
Volume: recent bullish candles lack strong volume → possible bull trap.
4. Trading Strategies
Sell Setup (trend-following):
Entry: 3,349 – 3,355
SL: above 3,370
TP1: 3,335
TP2: 3,320
Buy Setup (counter-trend at support):
Entry: 3,320 – 3,325 (support zone)
SL: 3,310
TP1: 3,340
TP2: 3,355
Outlook
Gold is still under bearish pressure as long as it trades below 3,370. Only a confirmed breakout above this zone may shift momentum to the upside.
Save these price levels for your trading plan. Follow along for more refined strategies throughout the week.

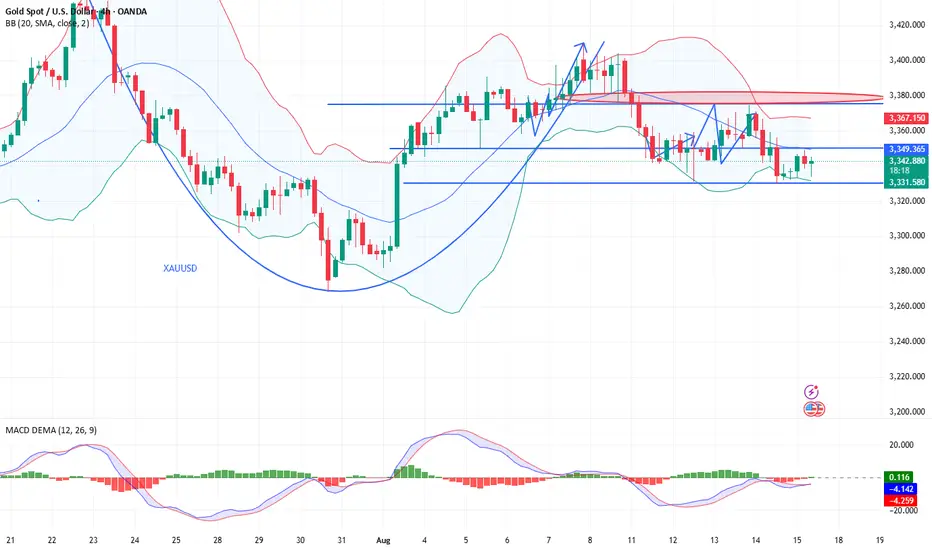
XAU/USD: Navigating the Uptrend and Key Support LevelsPrice Structure: Gold has been forming a series of higher highs and higher lows, indicative of a general uptrend. The chart labels a "high" and a "higher high," confirming this bullish structure.
Support and Resistance:
Two key support areas are identified:
Support area S1: A narrow zone around 3,320 USD. The price recently bounced off this area.
Support area S2: A broader, more significant zone around 3,290 USD, which appears to have been a strong support level in the past.
Several horizontal resistance levels are marked:
Immediate resistance: Around 3,351.231 USD and 3,366.029 USD.
Higher resistance: At 3,408.819 USD and 3,438.677 USD.
Channels and Trendlines:
The price has been moving within a series of ascending channels (highlighted in green rectangles), suggesting a stair-step upward movement.
A primary ascending trendline (black line) serves as a long-term support, with the price currently hovering just above it.
Recent Price Action and Projections:
The price recently broke out of a small downtrend and is showing signs of recovery from the "support area S1."
A potential price path is drawn with a red arrow, indicating a possible move towards the immediate resistance levels around 3,351 USD and 3,366 USD.
The chart highlights two specific price points, 3,360.604 USD and 3,350.685 USD, which likely represent a short-term trading range or target.
Volume: The volume spikes visible at key price points (e.g., at the low on July 30 and during the recent drop) indicate strong market activity.
Gold (XAUUSD) Brief Analysis- Gold (XAUUSD) is currently trading around 3350, consolidating within a symmetrical triangle pattern after finding support near the 3330–3338 zone (Fib 0.5 and trendline support).
- The RSI is hovering near 50, showing a balanced momentum, while prices have broken out of the short-term descending trendline, suggesting potential bullish continuation.
- For intraday trading, our bias remains bullish, and a sustained breach above the 3355 Fib 0.382 level could open the path toward 3365 and 3376 resistances.
- On the downside, immediate support lies at 3338, followed by 3328, and only a break below these levels would negate the bullish setup.
- Traders may look for buying opportunities on dips above 3355 with tight stop losses, targeting the upside levels.

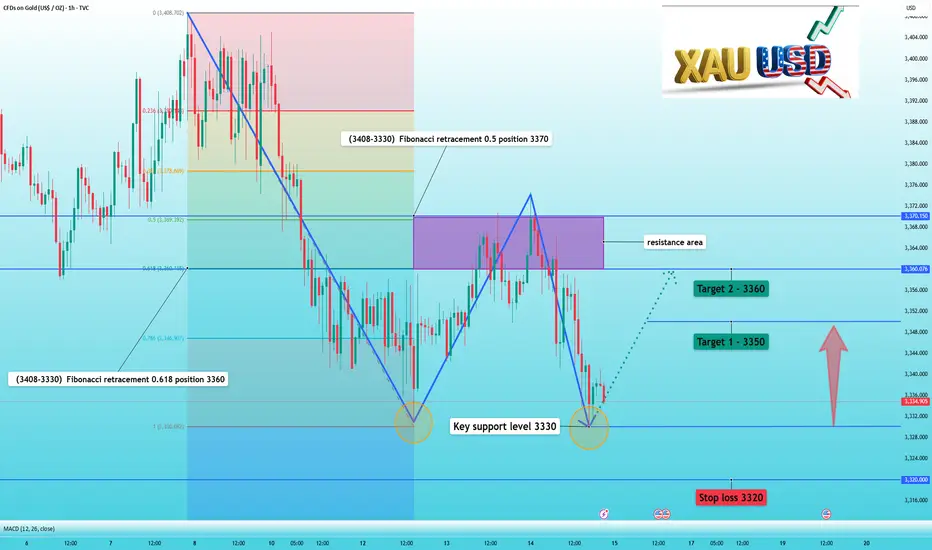
XAUUSD: 3330 becomes the key, buy if it doesn’t fall belowIn the previous article, we successfully predicted that gold prices would fall if they failed to break through 3370. This proved to be the case, with gold prices ultimately falling to our ultimate target of 3330.
From the 1-hour chart, it's clear that 3330 is a key support level. Gold prices rebounded from the decline on the 12th precisely at this level. Now that gold has stabilized after hitting 3330 again, will it rebound again?
I personally believe that a rebound around 3330 will occur, but the strength will not be too strong. It's important to be prepared to cash in on your gains.
🏆Trade setup is as follows:
📈Buy near 3330
✅Target 1 - 3350
✅Target 2 - 3360
🛑Stop loss 3320
📣If you have different opinions, please leave a message below to discuss
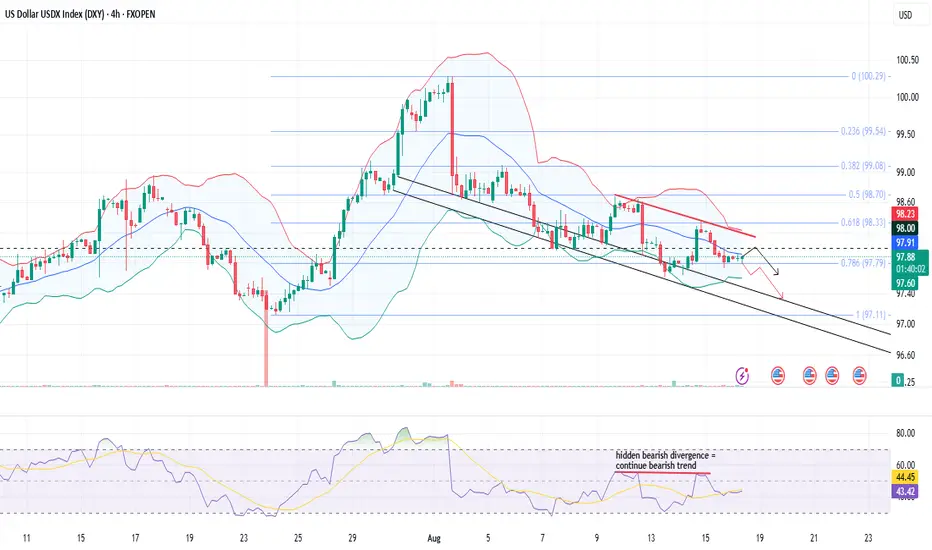
DXY Comprehensive AnalysisThe US Dollar Index (DXY) on the 4H chart remains under pressure, trading near 97.71 and holding below the key resistance zone of 98.20–98.30, aligned with the 20 SMA (middle Bollinger band) and 0.786 Fibonacci retracement (97.78), signaling a firm bearish bias.
Price action might continue to respect the descending trend, with recent candles showing rejection from the upper boundary and pointing toward a possible retest of 97.50–97.10 support levels. However, it will be crucial for prices to breach the fib level 0.786 and sustain lower.
Bollinger Bands are moderately compressed, suggesting controlled volatility, while RSI at 42 indicates weak momentum with a hidden bearish divergence (prices making lower highs and RSI making constant highs), reinforcing downside potential.
Unless the index reclaims 98.30 on strong buying, intraday traders may look for short opportunities on pullbacks, targeting 97.50 and then 97.10.
With no major data releases today, technical levels are likely to drive moves, and continued dollar weakness could support risk assets like equities and commodities, particularly gold and emerging market currencies.
XAUSUD: A large-scale buying opportunityGood morning, traders. Yesterday, I mentioned that the XAUUSD will initially decline after the Asian market opens. Our trading strategy of selling first and then buying has been effective and has shown some promising results. Gold prices hit a low of 3323 after the Asian session opened, a drop of approximately $12 per ounce. It then rebounded and is now trading at 3354. Long positions are continuing to profit. We await the target price of 3365. A new week, a new beginning. With the London session about to open, we'll have to wait and see whether it will push the XAUUSD to new heights.

GOLD TARGETS BUY STOPSgold targets buy stops from a reclaimed breaker block. An imbalance fill is a very strong point of interest , the breaker block aligns with an imbalance, this combination has proven to be lethal so many times, watch out for it

Gold Longs from 3,300 (11hr demand zone)Weekly Gold Analysis
For this week, I’m watching for short-term sell opportunities down into the 12H demand zone. At the moment, price is showing momentum to the downside, so we could see a setup form in the 12H supply zone before continuation.
However, my main focus remains aligned with the long-term trend, which suggests a potential rally forming from the 11H demand zone.
I’ve also noted a trendline forming above current price — meaning the reaction from the 12H demand zone could play out sooner than expected. That said, given the imbalance below, price may first need to mitigate a supply zone before breaking structure further to the downside.
Confluences for Gold Longs:
- Higher timeframe structure remains bullish overall.
- Significant upside liquidity still needs to be taken.
- An 11H demand zone remains unmitigated.
- For price to continue higher, a retracement is necessary.
- DXY analysis aligns with this bullish outlook.
P.S. Pro-trend trades take priority — but if a sell setup forms, I’ll approach with caution, lower risk allocation, and tighter TP targets.

The long-term trend of the gold remains bullish.The specified limits are suitable for purchase.
If the 4-hour candle closes below 3245.24, the 4-hour trend will be down.

Swing Trading OutlookThe market trend was flat over the weekend.
The prices of Bitcoin and Ethereum rose slightly before retreating slightly. There aren't any major market fluctuations.
We're still looking forward to next week's trends. Bitcoin is still in its bottoming phase. Periodic buying is a good option. The foreign exchange and futures markets will open in Asia on Monday. I'll be focusing on Wednesday's Federal Reserve interest rate decision. This is a key data point that will determine whether the US dollar rises or falls. It also serves as an important data point for our trading products.
My approach is to continue to sell at high levels before the interest rate decision. Then, monitor market sentiment. I'll focus on GOLD/XAUUSD, the two most impactful products. Secondly, the foreign exchange market. So, the strategy is: sell first, then buy next week. The subsequent buying will be determined based on the direction after the interest rate decision.
I hope everyone enjoyed this holiday. Maintain an optimistic and positive attitude when trading at all times. Once your mindset is affected, many things will be difficult to do, not just trading. Dear traders, see you next week.

Gold Potential Bullish ContinuationAfter retracing to the approx. 3370 - 3380 zone, gold still seems to exhibit signs of overall potential Bullish momentum as the price action may form a credible Higher Low with multiple confluences through key Fibonacci and Support levels which presents us with a potential long opportunity.
Trade Plan:
Entry : CMP 3393
Stop Loss : 3286
TP : 3499 (Before All Time High)

Latest price increase and decrease forecastFrom a technical perspective, Thursday's daily chart showed a sharp decline, engulfing Tuesday's. Wednesday's consecutive rises marked the closing price near the middle Bollinger band. There's no definitive direction for now, and both ups and downs are possible. Therefore, the daily chart's performance is not important, but the H4 chart shows significant momentum. Currently, 3330 is a double bottom, with the closing price just above the lower Bollinger band. If a rebound occurs here, especially with strength in the afternoon, the Bollinger band will tighten and the moving averages will converge, confirming a volatile market today. If the market stabilizes above the middle Bollinger band at 3350, it can be confirmed that today is a rebound. The US market could also reach a high of 3365. Therefore, the rebound strength can be observed around the 3330 support level during the Asian and European sessions. If it breaks through 3330, gold could continue its decline to the 3310-3300 range.
Trading suggestions: If the market rebounds first, short near 3346, with a stop-loss above 3352. If the market weakens, short near 3341, with a stop-loss above 3347. If the market declines first, short below 3300, or go long near 3320, with a stop-loss below 3315. If you currently have short positions at low levels and long positions at high levels and are unsure how to proceed, please leave a message for Charlie. FX:XAUUSD ACTIVTRADES:GOLD ICMARKETS:XAUUSD FOREXCOM:GOLD VANTAGE:XAUUSD FOREXCOM:GOLD VANTAGE:XAUUSD