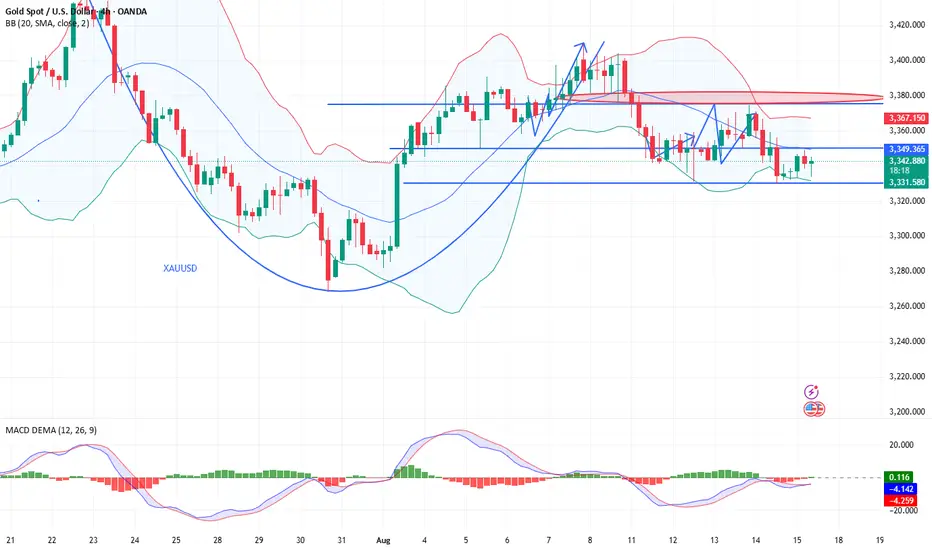
Latest price increase and decrease forecastFrom a technical perspective, Thursday's daily chart showed a sharp decline, engulfing Tuesday's. Wednesday's consecutive rises marked the closing price near the middle Bollinger band. There's no definitive direction for now, and both ups and downs are possible. Therefore, the daily chart's performance is not important, but the H4 chart shows significant momentum. Currently, 3330 is a double bottom, with the closing price just above the lower Bollinger band. If a rebound occurs here, especially with strength in the afternoon, the Bollinger band will tighten and the moving averages will converge, confirming a volatile market today. If the market stabilizes above the middle Bollinger band at 3350, it can be confirmed that today is a rebound. The US market could also reach a high of 3365. Therefore, the rebound strength can be observed around the 3330 support level during the Asian and European sessions. If it breaks through 3330, gold could continue its decline to the 3310-3300 range.
Trading suggestions: If the market rebounds first, short near 3346, with a stop-loss above 3352. If the market weakens, short near 3341, with a stop-loss above 3347. If the market declines first, short below 3300, or go long near 3320, with a stop-loss below 3315. If you currently have short positions at low levels and long positions at high levels and are unsure how to proceed, please leave a message for Charlie. FX:XAUUSD ACTIVTRADES:GOLD ICMARKETS:XAUUSD FOREXCOM:GOLD VANTAGE:XAUUSD FOREXCOM:GOLD VANTAGE:XAUUSD
Goldlong
Profitable 10-Minute Selling of GoldBased on the analysis in the previous article regarding the decline in gold prices, investors who followed the sell trend certainly made some profit. The drop was approximately $10 per ounce, and since it's Friday, this profit is quite positive. Market volatility is expected to be minimal as the market nears its closing. If you're serious about trading, consider buying at a low price.
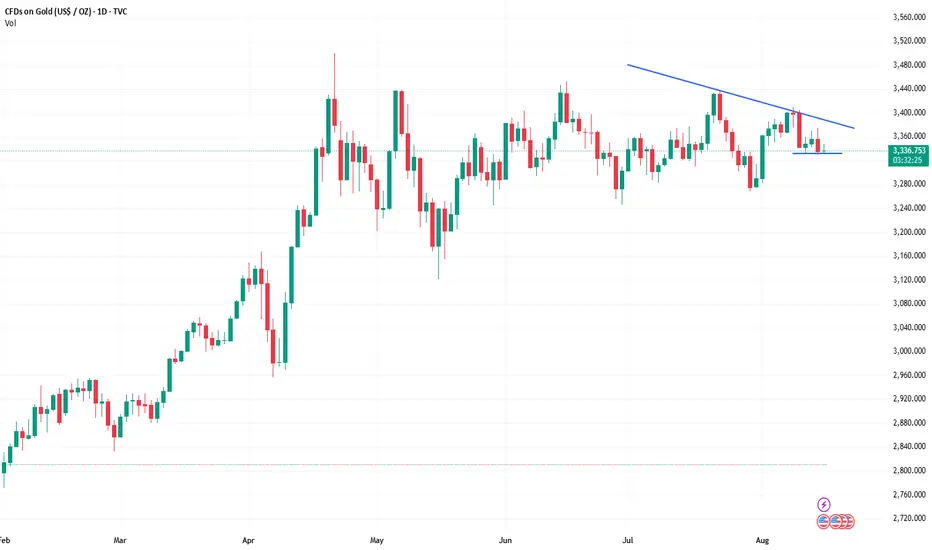
Gold fluctuates, waiting for an effective breakthroughThe MACD is below the zero axis and has already diverged from the bottom, indicating it's poised for a short-term rebound. Each short-term rebound followed a similar pattern to the current MACD. It simply diverges once, twice, or even three times before a sudden surge. Therefore, as long as the price falls below 3330 and then declines again, it's a good opportunity to ambush and buy from a low position. This could also be the next short-term low. Over the past four months of consolidation, the lows have clearly been gradually moving higher, and the end of the converging triangle has been gradually narrowing. One day, a major unilateral breakout will occur. Patiently wait for a return to the bullish trend.
Pay attention to the channel trend resistance line 3358-60. This position is actually the oscillation center axis point of 3330-3380. If the rebound is under pressure here, you can buy on highs and then fall back; once the hourly line closes positive and effectively stands on this position, give up the bearish view; and the low bullish position focuses on the 618 division, the previous top and bottom conversion, the lower track of the channel, etc.; as long as you dare to pull it down, you must dare to be bullish when a stabilizing K appears. The lower the effect, the better, because the lower it is, the more aggravated the divergence effect. FOREXCOM:XAUUSD ACTIVTRADES:GOLD ICMARKETS:XAUUSD ACTIVTRADES:GOLD EIGHTCAP:XAUUSD CMCMARKETS:GOLD VANTAGE:XAUUSD CMCMARKETS:GOLD VANTAGE:XAUUSD
XAUUSDThe bull market seems to be on the verge of another attack next week. The bottom may have formed a double bottom structure.

GOlD to 3394As it has broken the last low, it can go back to to 3310 after tapping 3394, but it is not needed, it can also keep crawling to 3450 and further
right now its a Clear Flag to buy it at least to 3394
gg
XAUUSD Potential Long OpportunityXAUUSD is currently in a bearish trend and is approaching the support level at $3332 which is the Asian lows for the day. Expecting a bounce form this level towards the Asian highs at $3349 which is just below the major pivot level of $3351.
Price is still trading below all 3 moving averages and in the in the bearish region of the RSI thus it is a pullback trade.
Not sure if Gold has enough momentum to break pass the pivot level at $3351 especially with the bearish momentum we are seeing, thus looking to take an intraday long trade and ride the wave to the Asian High before reevaluating my position.

BUY GOLDGoing for a good buy, on gold ( XAUUSD )
Always remember to close when in profit and hold if necessary, move SL to BE
Gold prices remain volatile, waiting for direction selectionGold prices (XAU/USD) rebounded modestly during Friday's Asian trading session, recouping some of the previous day's losses, but bullish momentum was limited. The dollar's previous rally, buoyed by strong US Producer Price Index (PPI) data, lacked sustainability. Investors widely expect the Federal Reserve to resume its interest rate cut cycle in September, supporting gold.
According to data released by the US Bureau of Labor Statistics, the PPI grew 3.3% year-on-year in July, exceeding market expectations of 2.5% and significantly higher than June's 2.4%. Despite this, the CME FedWatch tool shows a 90% probability that the Fed will cut interest rates by 25 basis points in September, with a cumulative 50 basis points cut expected by year-end.
Furthermore, market sentiment was supported by multiple positive factors, including easing trade concerns between the US and Asia and the potential for a ceasefire in the Ukrainian conflict following the US-Russia summit. These factors have boosted global risk appetite and limited further gains for gold as a safe-haven asset.
Analysts point out that amidst a rebound in risk appetite, gold's short-term performance may hinge on upcoming data releases such as US retail sales, the New York Fed manufacturing index, and the University of Michigan's consumer confidence index. These indicators could influence the US dollar and, indirectly, gold prices.
Daily chart analysis shows that gold prices are encountering significant resistance near the 100-hour moving average (around $3,355). Multiple rebounds have failed to break through this level, indicating that short-term selling pressure remains significant.
If prices break through this level, they could test the $3,375 and $3,400 levels. However, a break below $3,330 support could trigger an accelerated decline, potentially targeting $3,300 or even lower. Technical indicators show weak daily volatility, and the short-term trend remains downward.
The current rebound in gold is more of a technical correction than a trend reversal. Amidst a lack of sustained US dollar buying and lingering expectations of a Fed rate cut, gold prices are likely to remain range-bound in the short term.
However, if market risk sentiment further heats up, gold's safe-haven properties may continue to weaken. We need to pay attention to the effectiveness of the $3,330 support. Once it is lost, the downside space will open up quickly. FOREXCOM:XAUUSD ACTIVTRADES:GOLD ICMARKETS:XAUUSD FOREXCOM:GOLD ICMARKETS:XAUUSD CMCMARKETS:GOLD ICMARKETS:XAUUSD ACTIVTRADES:GOLD

The gold market is still stuck in a solid accumulation patternWorld gold prices fell after the US's key inflation report released results that were much higher than expected.
The US producer price index (PPI) in July increased by 0.9% compared to the previous month, much higher than the flat level in June and far exceeding the forecast of 0.2%. This is the strongest increase since June 2022.
This report reinforces the view of the "hawks" in US monetary policy, who do not want the US Federal Reserve (FED) to cut interest rates soon. Compared to the same period last year, the total PPI increased by 3.3% - the highest level in 5 months and exceeded the forecast of 2.5%. Core PPI (excluding food and energy) also increased by 0.9%, higher than the forecast of 0.2%.
On a year-on-year basis, the core PPI increased by 3.7% compared to the previous 2.6%. Hotter-than-expected PPI data in July only slightly reduced the chances of a 25 basis point Fed rate cut in September, but all but eliminated the possibility of a 50 basis point cut that a few investors had previously expected.
GOLD - XAUUSD - opportunity arise! let's goTeam, we have been blessed with a very successful trade with gold. Unfortunately I do not trade often until i find good opportunity
Here is the strategy to enter LONG gold
Current Price Zone: 3337–3339
• SL: 3328 as discussed earlier
If Price Hits 3344 (first breakout)
• Move SL to 3335 → Protects the bulk of gains while keeping room for a push to 3354.
• If Price Hits 3354 (next resistance)
• Move SL to 3344 → Secures profit from the breakout zone in case of a quick pullback.
If Price Hits 3365–3370
• Move SL to 3354 → This will lock in solid gains and let you ride in case gold aims for 3380+.

Gold Holds Around $3,350 After Volatile Swings📊 Market Overview:
Gold is currently steady around $3,350/oz after intraday moves between $3,341 and $3,375, according to Investing.com. Reuters reports spot gold near $3,357.65/oz, supported by expectations of Fed rate cuts and a softer USD.
📉 Technical Analysis:
• Key Resistance: $3,400
• Nearest Support: $3,341 – $3,342
• EMA 09: Price is hovering near the 9-day EMA, showing a short-term neutral bias.
• Candlestick / Volume / Momentum: Small-bodied candles with long wicks indicate market indecision, awaiting clear macroeconomic cues.
📌 Outlook:
Gold may range sideways around $3,350 in the short term unless new economic data triggers strong movement. A weaker dollar or stronger rate-cut expectations could lift prices toward $3,360–$3,400, while renewed USD strength may pressure gold down to $3,340 or lower.
💡 Suggested Trading Strategy:
SELL XAU/USD: $3,362 – $3,365
🎯 TP: 40/80/200 pips
❌ SL: $3,368
BUY XAU/USD: $3,340 – $3,343
🎯 TP: $3,360
❌ SL: $3,337

Gold consolidates at 3355, NY falls back to keep low and long#XAUUSD
Gold surged and then retreated during the day,🚀 reaching a high near 3374 and a low near 3341. It is currently consolidating around 3355. 📊
From a medium-term perspective, the previous upward trend of gold has not been completely broken, 📈but from the 2-hour chart, the MACD indicator shows signs of forming a death cross, adding a hint of uncertainty to the market. 🎲
In the short term, gold has repeatedly tested the 3365-3375 range but has not yet been able to break through. This resistance range can be considered as a temporary resistance level.🐻
The current PPI data is significantly bearish, and the DXY technical indicator is expected to form a golden cross. A stronger US dollar may put some pressure on gold. 📉However, gold has repeatedly tested the 3340-3330 support level without breaking, demonstrating that this support level has some resilience. 🐂If the support level of 3340-3330 is touched during the NY period and is not broken, you can consider going long with a light position,📈 but be sure to set a SL.⚖️
🚀 BUY 3340-3330
🚀 TP 3355-3365

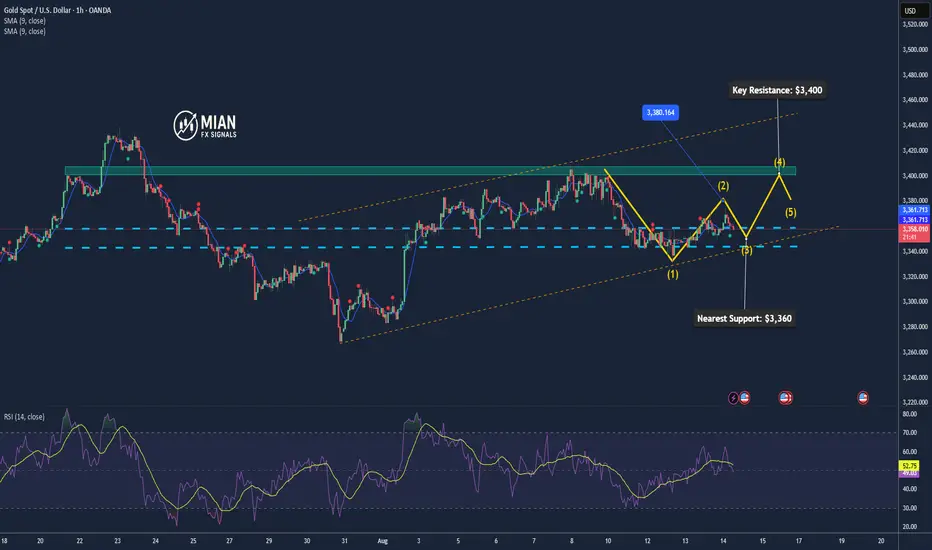
Gold Extends Rally as Rate-Cut Expectations Rise📊 Market Overview:
Gold prices extended gains for the third consecutive session, supported by rising expectations that the US Federal Reserve will cut interest rates in September, following softer US inflation data and a weaker US dollar.
📉 Technical Analysis:
• Key Resistance: $3,400 / $3,435
• Nearest Support: $3,358–$3,360 / $3,345
• EMA: Price is trading above EMA50 → bullish short-term signal.
• Candle / Volume / Momentum: Forming an ascending triangle pattern with positive momentum, suggesting potential for further upside.
📌 Outlook:
Gold may continue to rise in the short term if it breaks and sustains above $3,400. A drop below $3,360 could trigger a pullback toward $3,3345.
💡 Trade Strategy Suggestions:
🔻 SELL XAU/USD: $3,400–$3,403
🎯 TP: 40/80/200 PIPS
🛑 SL: $3,406
🔺 BUY XAU/USD : $3,350–$3,353
🎯 TP: 40/80/200 PIPS
🛑 SL: $3,347
XAUUSD Analysis todayHello traders, this is a complete multiple timeframe analysis of this pair. We see could find significant trading opportunities as per analysis upon price action confirmation we may take this trade. Smash the like button if you find value in this analysis and drop a comment if you have any questions or let me know which pair to cover in my next analysis.

XAUUSD – Channel Breakdown & Order Block ReactionPrice has broken below the ascending channel 📈 after failing to hold higher highs. A strong bearish drop has pushed price toward the 15M Order Block (OB) 📦 around 3,335–3,345, which may act as a demand zone.
🔍 Scenarios:
1️⃣ Bullish Reversal 🐂 – Buyers defend the OB, pushing price back above 3,360 and possibly toward 3,380+.
2️⃣ Further Drop 🐻 – If the OB fails, sellers could target lower liquidity zones.
⚡ Volume spikes during the breakdown show strong selling pressure, but the OB zone remains the key battleground for the next move.

Daily Market Momentum Analysis (Gold)Spot gold's upward momentum stalled during the Asian session on Thursday (August 14th). After hitting a three-day high near $3,375, it encountered some intraday selling and is currently trading around $3,358.52 per ounce, close to Wednesday's closing price. Global risk sentiment continues to be supported by two factors: optimistic expectations of a three-month extension of the US-China trade truce and positive signals from Friday's (August 15th) US-Russia summit aimed at ending the Russia-Ukraine conflict. This, in turn, has weighed on the safe-haven precious metal. However, multiple supportive factors remain favorable for bullish traders and provide a basis for potential bargain-hunting.
The US dollar continues to face selling pressure due to widespread expectations that the Federal Reserve will cut borrowing costs in September. Furthermore, traders have begun betting on the possibility of two Fed rate cuts before the end of the year, which should continue to be positive for gold, a non-interest-bearing asset. Against this backdrop, it would be prudent to await further follow-through selling to confirm whether the gold price rebound from Tuesday's one-week low of $3,331 has lost momentum.
Daily Market Drivers Analysis: Gold bulls hold off on aggressive bets amid rising risk appetite
Except for the Nikkei 225, Asian stocks extended their recent gains, tracking the US benchmark S&P 500 and the tech-heavy Nasdaq Composite, which posted record gains for the second consecutive trading day.
The US dollar rebounded slightly after hitting a two-week low early Thursday, but its upside is expected to be limited as market expectations for a more aggressive Federal Reserve rate cut are more aggressive than previously.
According to the CME Group FedWatch tool, the Federal Reserve is almost certain to cut interest rates by 25 basis points at its September policy meeting, with at least two more cuts expected before the end of the year.
This expectation was reinforced by US consumer inflation data, which was largely in line with expectations on Tuesday. Furthermore, the July US non-farm payroll report showed signs of labor market weakness, bolstering the case for further policy easing.
Meanwhile, US President Trump increased pressure on Federal Reserve Chairman Powell to cut interest rates. Furthermore, US Treasury Secretary Scott Bessant said the Fed should consider a 50 basis point rate cut next month.
Chicago Fed President Goolsbee said he was more concerned about last month's rise in core inflation than the unusually weak jobs report, and therefore may not support a September rate cut.
Atlanta Fed President Bostic acknowledged the overall weakness in the latest round of employment data and noted the potential for structural changes due to tariffs, but he declined to comment on a rate cut.
U.S. Treasury yields remained under pressure as investors assessed the potential impact of tariffs on the U.S. economy and awaited the release of the U.S. Producer Price Index (PPI) later in the North American session.
Gold's technical structure supports the view of dip buying at lower levels.
Gold broke through the $3,358-3,360 resistance level overnight, and the successful defense of the 200-period simple moving average support on the 4-hour chart earlier this week supports spot gold bulls. However, oscillators on the hourly and daily charts have yet to gain significant upward momentum, so it would be wise to wait for more follow-through buying before initiating further long positions.
Currently, the Asian session high (around $3,375) may constitute near-term resistance. A break above this level could potentially push gold prices towards the $3,400 mark. This level is closely followed by last week's swing high of $3,409-3,410. A successful break above this level would pave the way for further gains towards the intermediate resistance level of $3,422-3,423. Ultimately, upward momentum could propel gold prices above the $3,434-3,435 area, potentially challenging the psychologically important $3,500 peak reached in April.
On the downside, if gold prices break below support at $3,243-3,242 (the 200-period moving average on the 4-hour chart), they could find support near $3,331 (this week's low). If selling pressure persists, gold could accelerate its slide towards the $3,300 mark. A clear break below this level would turn bearish in the short term, opening up room for further declines. FX:XAUUSD VELOCITY:GOLD VANTAGE:XAUUSD CMCMARKETS:GOLD ICMARKETS:XAUUSD CMCMARKETS:GOLD VANTAGE:XAUUSD MCX:GOLD1! FX:XAUUSD

World gold price recoversWorld gold prices recovered, supported by the drop in the USD index to a three-week low and the decline in US Treasury bond yields in the middle of the week.
Gold and silver markets also saw buying as many Wall Street firms forecast the Federal Reserve will begin cutting interest rates in September, amid a weakening labor market and relatively low inflation.
Economists at Nomura expect the Fed to cut its key interest rate by 25 basis points at its September FOMC meeting, followed by two more cuts in December and March. The market is also pricing in this expectation, with another cut in December.
US inflation data released on Tuesday showed the core index (excluding food and energy) rose 3.1% in July compared to the same period last year, slightly higher than forecast but not considered to be worrying.

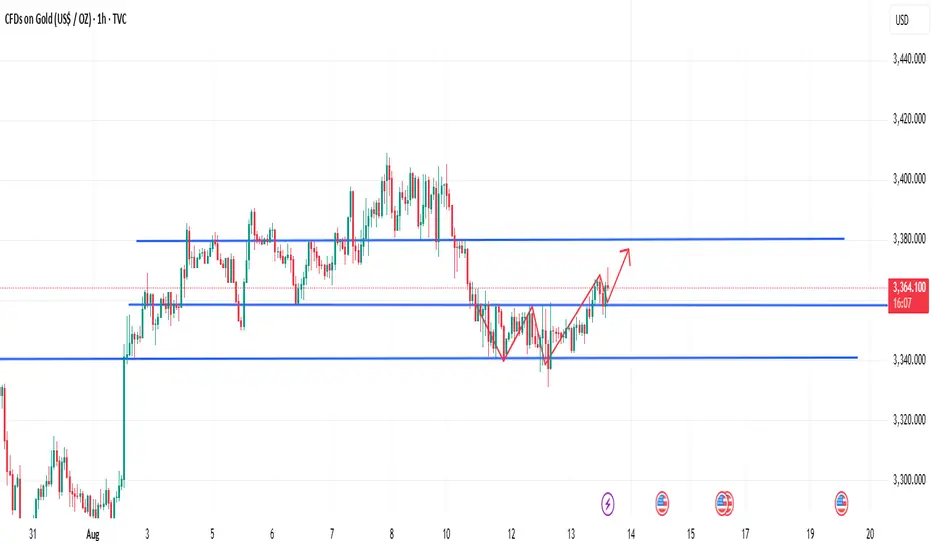
Gold Gains Amid USD Weakness📊 Market Overview:
Gold rose modestly as the U.S. dollar weakened following softer-than-expected July CPI data, increasing the likelihood of a Federal Reserve rate cut in September. Geopolitical tensions surrounding the Trump–Putin meeting and ongoing trade war developments further supported demand for safe-haven assets like gold.
📉 Technical Analysis:
• Key Resistance: $3,360–$3,361 (near EMA50 area), $3,375–$3,380 (major resistance zone, 0.618 Fibonacci & option barrier)
• Nearest Support: $3,350–$3,351 (break below may lead to downside at $3,325), additional supports at $3,336, $3,324, $3,313
• EMA: Short-term trend neutral, slight bearish bias near resistance
• Candlestick / Volume / Momentum: RSI on H1 around 45–50 (neutral), volume declining, possible upcoming breakout
📌 Outlook:
Gold may continue to edge higher in the near term if it breaks resistance at $3,361 with strong volume and the USD remains weak. Otherwise, failure to surpass $3,375–$3,380 could lead to pullback toward support at $3,350 or further down to $3,330–$3,325.
________________________________________
💡 Suggested Trading Strategy:
🔺 BUY XAU/USD
Entry: 3,320 – 3,323
🎯 TP: 40/80/200 pips
❌ SL: 3,317
🔻 SELL XAU/USD
Entry: 3,375–3,378
🎯 TP: 40/80/200 pips
❌ SL: 3,381

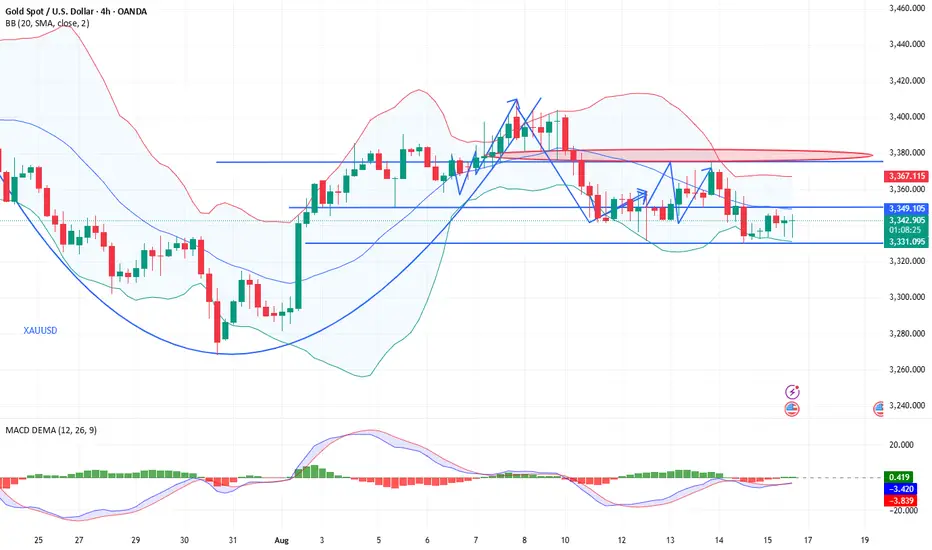
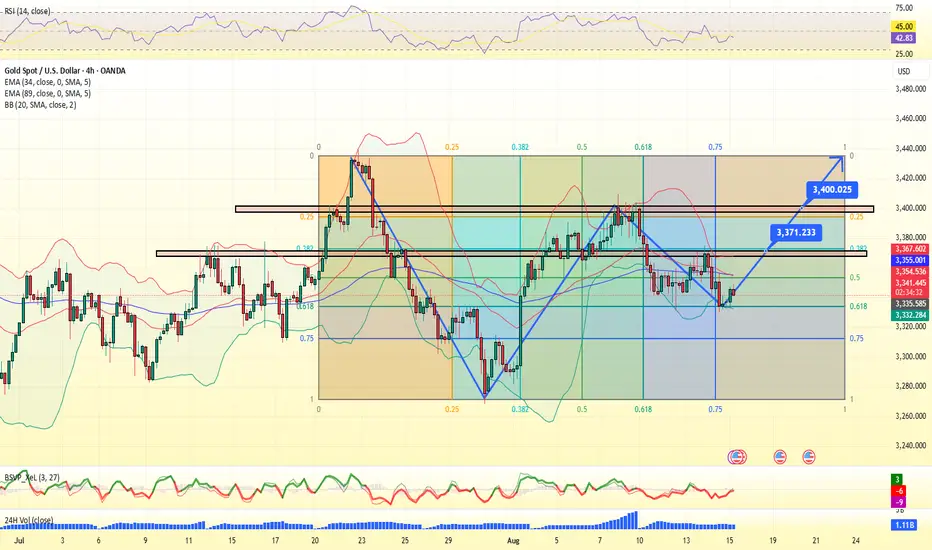
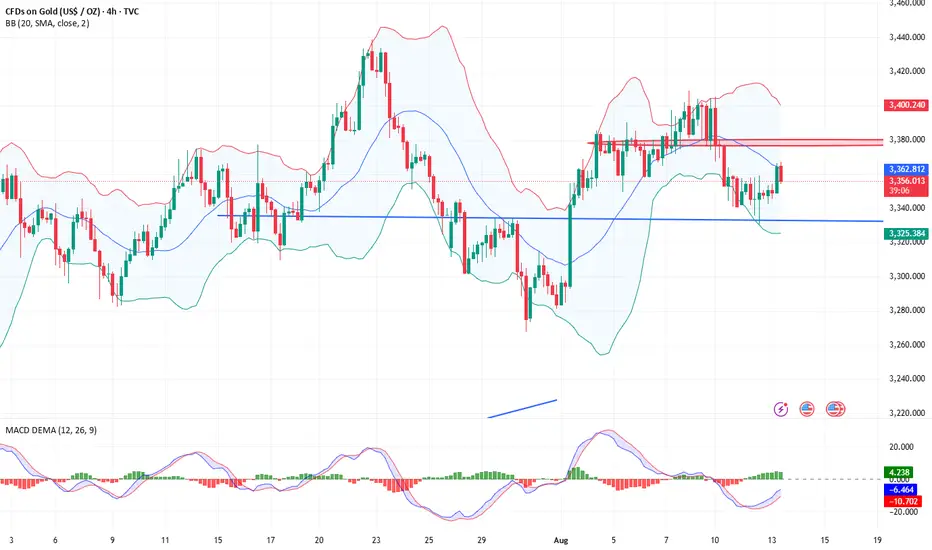
The pullback is for a better riseGold is currently showing signs of gradual technical recovery on the 4-hour chart after a period of consolidation. The price is slowly breaking out of the previous low-range oscillation zone, with short-term moving averages beginning to curve upward and diverge, indicating a potential strengthening trend in the near term. Moving forward, watch for a possible secondary upward surge after a retracement and consolidation. In the short term, keep an eye on the resistance zone around 3380.
On the hourly chart, there has been a minor pullback, but the momentum and follow-through remain limited. The expectation is that after a brief adjustment, the upward trend may continue with further room for gains.
Gold rebounded, but its future trend is still full of variables.Spot gold (XAU/USD) saw a second consecutive day of buying on Wednesday (August 13), attempting to build on its previous day's rebound from around $3,331. The latest US Consumer Price Index (CPI) data for July was largely in line with expectations, reinforcing market expectations of a September interest rate cut by the Federal Reserve. This data kept the US dollar at a more than two-week low and further supported gold, a non-yielding asset.
However, gold's intraday gains appeared to lack sufficient momentum, particularly as the US-Russia summit, potentially contributing to an end to the Russia-Ukraine conflict, has somewhat suppressed its safe-haven properties. This shift in market sentiment suggests that holding long gold positions remains prudent without strong follow-on buying.
US Consumer Price Index (CPI) data for July showed that the CPI remained unchanged at 2.7% year-on-year, but the core CPI (excluding food and energy prices) rose to 3.1%, exceeding expectations of 2.9%. While this data failed to stoke market concerns about inflation, signs of labor market weakness still support expectations that the Federal Reserve may cut interest rates twice before the end of the year.
CME Group's FedWatch tool also indicates that the market generally expects the Fed to cut interest rates, which may put pressure on the US dollar in the coming days, further benefiting gold.
Technical Analysis
From the chart, gold's current price trend shows some signs of recovery. After falling to the $3,331 area, the price found support and rebounded on August 13, breaking through the previous day's high. This suggests that bullish momentum has strengthened in the short term and may continue to push gold prices to test higher resistance levels.
The Bollinger Bands indicate that the price is currently near the middle band of the Bollinger Bands, and the bands are showing a certain expansion pattern, indicating increased market volatility. If the price maintains this level, it may open up further room for growth, further testing the resistance level of $3,400.
The MACD indicator shows that the current MACD lines have begun to converge, and the green histogram is shortening, indicating a rebound in bullish market momentum. However, attention remains to be paid to whether the MACD will form another death cross, leading to a price pullback.
Market Sentiment Observation:
Current market sentiment is mixed. Gold's rebound is supported by expectations of a Fed rate cut and easing global trade and geopolitical risks. Nevertheless, strong stock market performance may weaken gold's safe-haven demand, especially amid growing optimism about the global economy.
The S&P 500 and Nasdaq hit record highs, while Japan's Nikkei 225 index broke through 43,000 points. These positive stock market performances may weaken demand for gold, especially as market sentiment favors a risk-on outlook.
Market Outlook:
Bullish Outlook:
Gold is likely to continue to be supported in the short term by a weak dollar and expectations of rate cuts, with prices expected to test the previous high near $3,409. If gold breaks through and stabilizes above this level, further upside potential is likely, potentially targeting the $3,450 area.
In the long term, if global economic uncertainty persists and the Federal Reserve maintains its pace of rate cuts, gold is likely to remain relatively strong.
Bearish Outlook:
However, if the stock market continues to strengthen and the global economy recovers further, gold's safe-haven demand may gradually decline. In this case, gold's upward momentum may weaken, and prices may retreat to support levels around $3,329 or even lower.
Overall, in the current market environment, gold's short-term trend still needs to closely monitor changes in the stock market, the US dollar, and the global geopolitical situation, and traders should adjust their positions flexibly based on these factors. PEPPERSTONE:XAUUSD ACTIVTRADES:GOLD VANTAGE:XAUUSD ACTIVTRADES:GOLD EIGHTCAP:XAUUSD FOREXCOM:GOLD PYTH:XAUUSD CAPITALCOM:GOLD
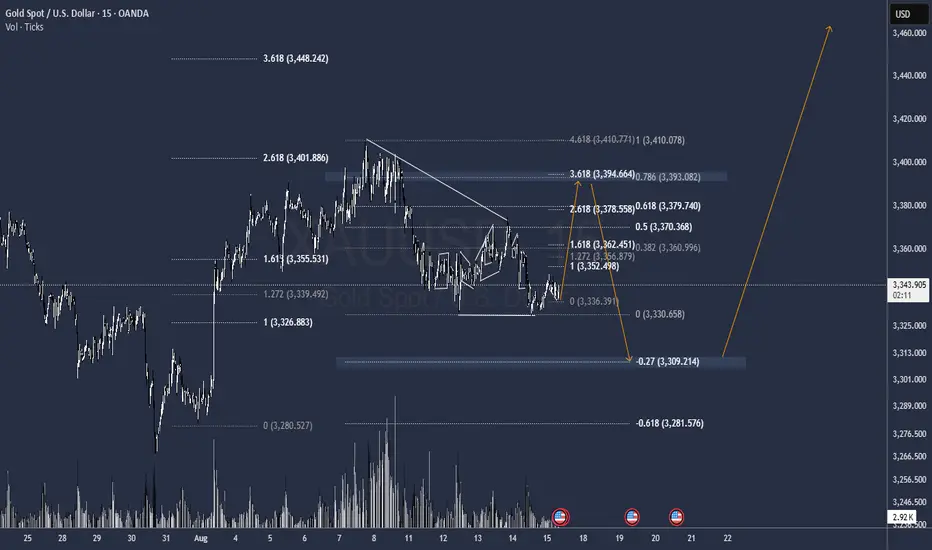
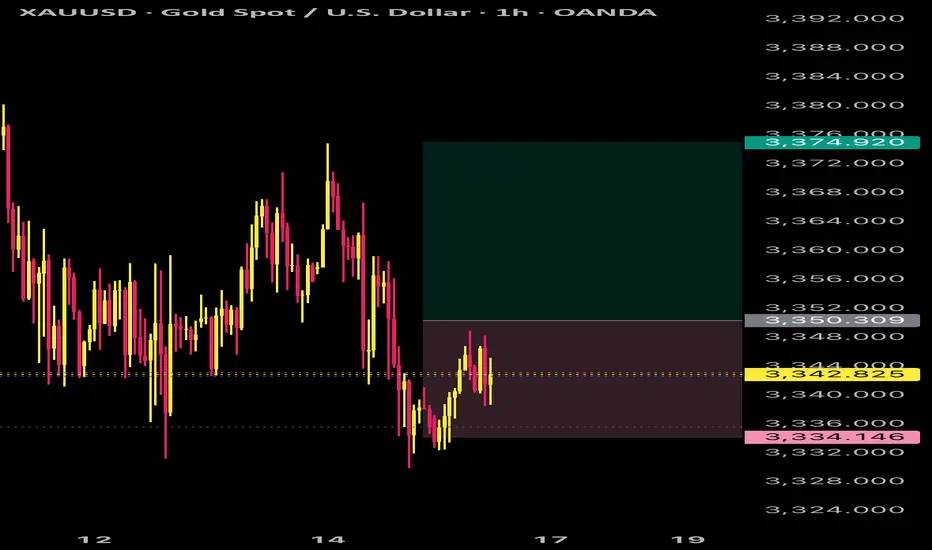
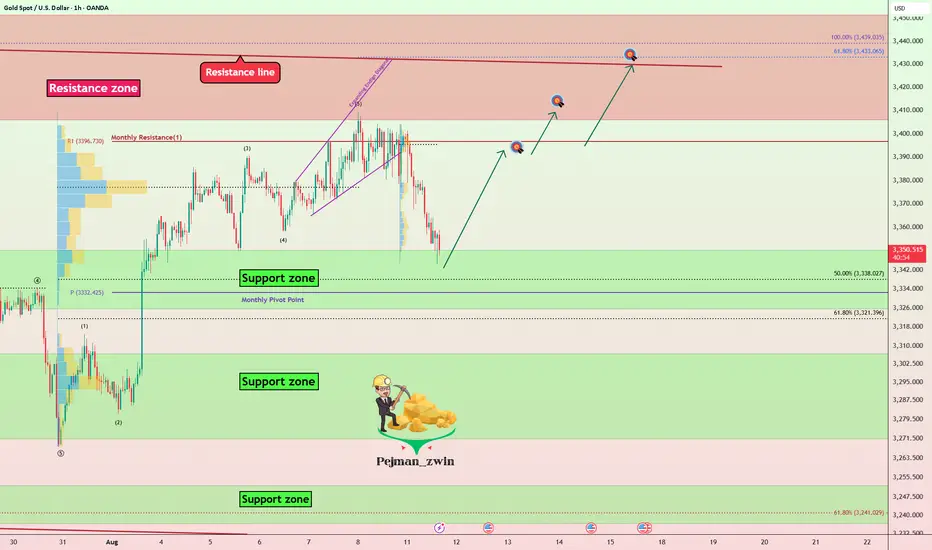
Gold Correction Ending — Time for the Next Rally?Gold ( OANDA:XAUUSD ) is currently moving near the Support zone($3,350-$3,326) and the Monthly Pivot Point .
In terms of Elliott Wave theory , it seems that Gold is completing a corrective wave, and we should wait for the next impulse wave .
I expect Gold to start rising from the Support zone($3,350-$3,326) and rise to at least $3,393 .
Second Target: $3,407
Third Target: $3,427
Note: Stop Loss (SL) = $3,317
Gold Analyze (XAUUSD), 1-hour time frame.
Be sure to follow the updated ideas.
Do not forget to put a Stop loss for your positions (For every position you want to open).
Please follow your strategy; this is just my idea, and I will gladly see your ideas in this post.
Please do not forget the ✅ ' like ' ✅ button 🙏😊 & Share it with your friends; thanks, and Trade safe.
XAUUSD UPDATE Gold will be buying and had already triggered my trade but will take partials if necessary and keep following the structure carefully, zero indicators used

GOLD Potential Bullish Breakout OpportunityGold seems to exhibit signs of a potential Bullish Breakout on the Shorter timeframes as the price action may form a credible Higher High with multiple confluences through key Fibonacci and Support levels which presents us with a potential long opportunity.
Trade Plan:
Entry : CMP
Stop Loss : 3327
TP 0.9 - 1: 3398 - 3402
