Gold Poised for Mild Rebound amid Tariff Relief📊 Market Movement:
Gold eased after President Trump announced tariff exclusions on imported gold bars, easing prior market uncertainty. Safe-haven demand stays supported by macroeconomic and Fed policy concerns.
📉 Technical Analysis:
• Key Resistance: $3,385 – $3,410 – $3,460
• Nearest Support: $3,330 – $3,332
• EMA: Price fluctuates around medium-term EMA.
• Candlestick / Momentum: Ascending triangle, neutral RSI, rising volume → mild accumulation signs.
📌 Outlook:
Gold may see a mild rebound in the short term if trade policy remains stable and the Fed keeps rates unchanged. Strong US economic data could pressure prices downward.
________________________________________
💡 Suggested Trading Plan
🔻 SELL XAU/USD: $3,410–$3,413
🎯 TP: 40/80/200 pips
❌ SL: $3,416
🔺 BUY XAU/USD: $3,330–$3,333
🎯 TP: 40/80/200 pips
❌ SL: $3,327
Goldlong

GOLD H4 PRICE UPDATE #XAUUSD#XAUUSD #GOLD #XAU
Gold Consolidating Between 3360 / 3340
First #GOLD Want To Take Breakout From Buyside Or Sell Side
If Gold Take The Buyside liquidity Then We Considering Sell Trades
Target the blue box (Engulfing Bullish Box) + (Order Block Box)
#GOLD JUST FLY FROM OUR BUY CISD ENTRY
#GOLD SMT Then Fly
Gold Buying From 3,300 Or 3,280
Targeting Price 3400 With Breakeven
Gold Selling From 3,440 / 3,460
Targeting Price 3,300 / 3,280

GOLDEN GOLD XAUUSD Gold now hasn’t triggered ,so made some adjustments and will wait patiently and wait for the trade to be valid or triggered

xauusd (GOLD): a signal Hi guys!
Key Technical Points:
Ascending Channel:
Price action has been moving within a well-defined ascending channel.
Currently, the price has pulled back and is approaching the lower boundary of this channel.
This lower boundary often acts as a support area where buyers might step in.
Support Zone (Red Box):
The red highlighted area, around $ 3,340-$ 3,350 USD, is a key support zone.
This zone aligns w ith the lower boundary of the channel , adding more weight to the support.
Price is currently testing this area, which could act as a springboard for the next upward move.
Resistance Zone (Blue Box):
The upper resistance zone between roughly 3,425 and 3,440 USD is a major target for bulls.
This is a previous high area where sellers might re-enter the market.
-------------------------------------------------------
Trade Idea:
Long Position:
Entry could be considered near the lower boundary of the channel and the red support zone (around 3,340-3,350 USD).
Stop loss placement: Just below the red support zone to limit downside risk.
Target: The upper resistance zone at around 3,425-3,440 USD.

Has Gold finally topped?Since December 2024, gold has held above a key diagonal support line (see chart).
On 25 July 2025, price broke below a medium-term diagonal support — and recent action looks more like a break-and-retest than a full recovery.
The Chaikin Money Flow is also showing negative divergence, suggesting buying pressure is weakening even as price tried to push higher. That’s often a warning sign for potential trend reversals.
Could this be the start of a deeper move down, or just a pause before new highs?
What’s your take — has gold topped?

XAU/USD Bullish Bounce from Demand Zone !Gold (XAU/USD) on the 4H chart is showing a potential bullish reversal setup. Price has pulled back into a Fair Value Gap (FVG) and high supply/demand zone near 3,329–3,315, aligning with the 0.382–0.5 Fibonacci retracement.
Key Points:
Support Zone: 3,329–3,315 (demand + FVG).
Bullish Rejection Expected: Price may bounce from this zone, targeting upper resistance levels.
Upside Targets:
TP1: 3,356
TP2: 3,375
TP3: 3,440–3,459 (major resistance)
Invalidation: A daily close below 3,315 could open room for deeper downside toward 3,278–3,245.
Indicators: EMA(9) and Ichimoku showing potential for trend resumption if price closes above 3,362.
Overall, the chart suggests a buy setup on bullish confirmation, aiming for the 3,375–3,459 zone.

3400 failed again, what will be the subsequent trend?Breaking News: Trump signed the Sino-U.S. tariff "truce" agreement at the last minute, deciding once again to extend the deadline by 90 days starting from August 12. Another three months—the Sino-U.S. tariff risks have been temporarily averted. This news came as no surprise, so the market reaction has been muted. Next, all eyes are on the Trump-Putin meeting on August 15, which the market sees as the last opportunity to end the Russia-Ukraine war, making it a highly anticipated event.
Tonight, the CPI data will be released, and its trend will directly influence market expectations about whether the Fed will cut rates in September. As such, this data is certain to have a major impact on gold prices. If inflation exceeds expectations, gold may initially rally but then pull back, as rising inflation data is bullish in itself but would reduce rate-cut expectations, which is bearish. If the data falls short of expectations, gold may dip first before rising.
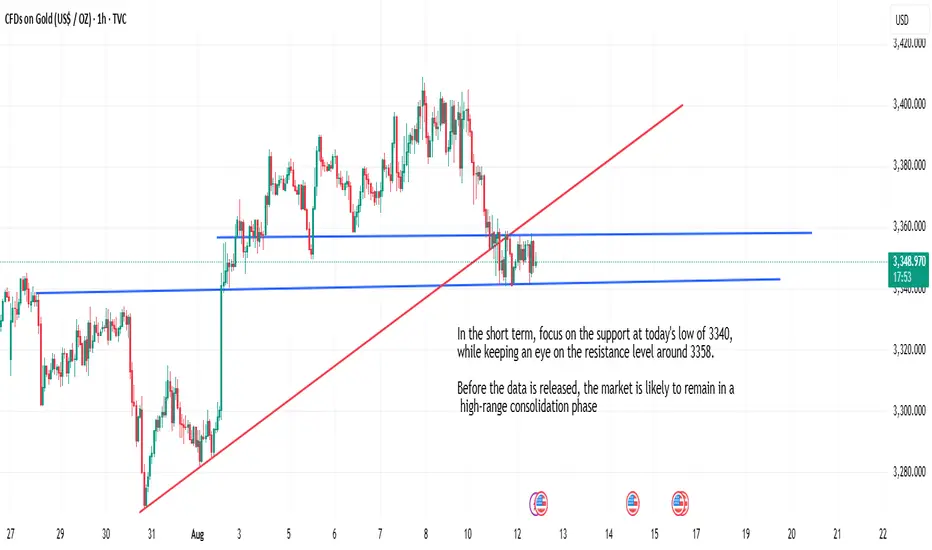
Last night, gold broke below last week’s starting rally point of 3,345, hitting a low near 3,340, indicating weak momentum. The 3,340 level is a critical support—a break below it would suggest that gold’s unilateral rise from 3,270 may shift back into a consolidation phase.
Technically, gold has managed to hold above the key support of the 200-period SMA on the 4-hour chart, currently positioned around the 3,344-3,342 range. Given that the oscillators on this chart reflect bearish momentum, a decisive break below this support could push gold toward the next intermediate support at 3,320.
Conversely, if prices rebound and break above the 3,358-3,360 zone, strong resistance is likely to emerge near 3,380.
Thank you all for your likes, comments and follows, we really appreciate it!
XAUUSD/ GOLDEN OPPORUNITYTeam, last week, we short GOLD at 3403-3406
we have successfully did 5 times with target ranges at 3385-80
We are NOW going long at 3346-3350 range, with STOP LOSS at 3335
Tonight CPI coming out, we expect higher than anticipate.
we expect gold to move fast toward our target
Target 1 at 3362-65 - bring stop loss to BREAKEVEN, and make sure take 50% partial
Target 2 at 3372-3386 ranges
LET'S GO

Gold Retesting Support 3,350–3,345-Short-Term Buying Opportunity📊 Market Overview
Gold is currently trading around 3,350 USD/oz, slightly higher than the previous session thanks to expectations that the Fed will cut interest rates amid a weakening USD. The market remains cautious ahead of upcoming U.S. inflation data, which could provide new momentum for gold prices. Additionally, President Trump’s confirmation that gold imports will not face tariffs has helped stabilize investor sentiment.
📉 Technical Analysis
• Key Resistance: 3,400 – 3,410 USD/oz
• Nearest Support: 3,345 – 3,350 USD/oz
• EMA09: Price is currently below the EMA09 on the H1 timeframe → short-term downward pressure still persists.
• Candlestick / Volume / Momentum: After a sharp drop on August 11, price is sideways around the support zone; RSI on H1 is about 56, not yet overbought, indicating potential for a rebound if support holds.
📌 Outlook
Gold could rebound short term from the 3,350–3,345 zone if U.S. inflation data comes in lower than expected and the USD continues to weaken. However, if price breaks below 3,345 with strong selling pressure, the downtrend may extend to 3,335 or 3,330.
💡 Suggested Trading Strategy
BUY XAU/USD: 3,346 – 3,343 USD/oz
🎯 TP: 40/80/200 pips
❌ SL: 3,339 USD
SELL XAU/USD: 3,407 – 3,410 USD/oz
🎯 TP: 40/80/200 pips
❌ SL: 3,413 USD

CPI is about to be announced, 3342 life and death lineGold prices rebounded during the Asian and European trading hours on Tuesday (August 12), stalling their rebound. Spot gold briefly rose 0.4% to around $3,357/oz, but the rebound lacked momentum and has now retreated to around $3,346.82/oz, still near the previous day's one-week low. Market expectations are that the Federal Reserve will resume its rate cut cycle in September, but this expectation limits the dollar's potential for recovery, which in turn provides some support for gold, a non-interest-bearing asset.
However, gold bulls appear reluctant to make large bets, opting instead to await the latest US inflation data. This key data will provide fresh clues about the Fed's rate cut path, in turn impacting dollar demand and providing a substantial boost to gold prices. Meanwhile, the extension of the US-China trade truce and optimistic expectations for a US-Russia summit aimed at ending the war in Ukraine could pose bearish factors for gold.
Market Dynamics: Gold prices benefited from Fed rate cut bets, while US dollar demand remained subdued.
Gold prices fell sharply on Monday as easing geopolitical tensions weighed on traditional safe-haven assets. Investors are pinning high hopes on Friday's US-Russia summit, believing it will increase the likelihood of an end to the long-running Russia-Ukraine conflict. Furthermore, continued buying of the US dollar contributed to a sharp drop of approximately 1.65% in precious metals overnight.
Market participants are generally betting on a 25 basis point interest rate cut by the Federal Reserve in September, with at least two more by year-end. This expectation is bolstered by a recent string of disappointing US economic data, including the closely watched non-farm payroll report, which suggests the economy may be weakening.
However, traders are likely to refrain from making large directional bets, opting to wait and see ahead of US inflation data, which could provide further clues about the interest rate outlook.
The US Producer Price Index (PPI) will be released on Thursday, followed by US retail sales data and the Michigan Consumer Confidence Index on Friday. Furthermore, speeches by several key Federal Reserve (FOMC) officials will also influence the US dollar's short-term trajectory and provide significant support for gold prices.
On the trade front, US President Trump signed an executive order on Monday extending the US-China trade truce for three months, easing market concerns about a trade war between the world's two largest economies. Trump previously stated in a social media post that gold would not be subject to tariffs, but provided no further details.
Gold bears need to wait for a break below the key support level near $3342.
Technically, gold has successfully held the key support level of the 200-period SMA on the 4-hour chart, currently located in the $3344-3342 range. Given that oscillators on the chart are showing downward momentum, a break below this support level could drag gold towards the intermediate support level of $3315 and, subsequently, the $3300 mark. Any subsequent selling would be seen as a new trigger for short traders and pave the way for further declines in gold prices.
Conversely, a rebound above the $3358-3360 area could face strong resistance near $3380. A sustained break above this resistance level would allow gold to make another attempt to conquer the $3400 mark. A further break above last week's swing high of $3409-3410 would reverse the current bearish outlook and push gold prices towards testing the next key resistance level of $3422-3423. Upward momentum could extend to the strong horizontal resistance level of $3434-3435. A clear break above this resistance could challenge the historical peak of $3500 reached in April.
Overall, the gold market is currently caught in a tug-of-war between expectations of monetary policy easing and easing geopolitical risks, with technical indicators showing signs of consolidation and volatility. Investors are advised to closely monitor this week's inflation data and exercise caution until key levels are breached. PEPPERSTONE:XAUUSD VELOCITY:GOLD PEPPERSTONE:XAUUSD ACTIVTRADES:GOLD VANTAGE:XAUUSD CMCMARKETS:GOLD

Gold prices have been hit hardGold prices have been hit hard, following a sharp rally over the weekend as traders await further clarity from the Trump administration on its gold import tax policy.
The commodity had been exempted from the tax since April, but investors are still waiting for clearer signals on its long-term direction.
Joseph Cavatoni, senior market specialist for North America at the World Gold Council, said that different segments of the gold market are operating stably while waiting for further information.
According to Jim Wyckoff, senior analyst at Kitco Metals, the market rallied last week on the uncertainty surrounding tariffs, but is now seeing a sell-off as investors await more clarity from the White House.
On the economic data front, the US will release the consumer price index (CPI) on Tuesday and the producer price index (PPI) on Thursday. Wyckoff said that inflation data this week is particularly important after the weak jobs report. If the numbers come in higher than expected, the US Federal Reserve (Fed) could pause its interest rate cut plan in September, which would put downward pressure on gold prices.
EURUSD waiting for recovery to buy✏️EURUSD is still trading in an uptrend and is facing last week's top resistance at 1.170. The lower boundary of the price channel at 1.160 forms a 10-price boundary of the pair. Wait for support retests and buyers' reactions to trigger buying strategies towards the resistance at 1.181 next week
📉 Key Levels
Support: 1.159-1.145
Resistance: 1.169-1.181
BUY Trigger: Rejection of the support zone at 1.159
BUY zone 1.145 (Strong support zone)
Leave your comments on the idea. I am happy to read your views.

Gold long and short two-way layout ideasI write every article hoping to connect with those I'm connected with. I hope to help investors in need. Regardless of initial impressions, I should give them a chance to understand me. I believe that the fact you've read all this is fate, and investing is largely about fate. If you believe in fate and believe I can do something for you, you might want to talk to me.
Gold has been falling steadily today. Technically, the hourly moving average is turning upwards from its highs. This suggests a potential short-term rebound for gold bulls, and they may need significant news to stimulate their decline. Otherwise, they may struggle to achieve significant gains in the short term. With this hourly decline, there's little chance of a major rebound. The key level for gold remains around 3365-3380. After all, previous support levels have become resistance levels. If your current trading isn't ideal, I hope I can help you avoid investment setbacks. Feel free to discuss your options.
From the perspective of the 4-hour cycle structure, the lower support is focused on the 3340-3330 area, which is an effective support zone that has been verified many times; the upper resistance is focused on the 3365-3380 area, which may form a key suppression level in the short term. In terms of operation ideas, we should maintain a two-way strategy of shorting on rebounds and going long on pullbacks. According to the changes in the shape and momentum of prices touching key positions, we should flexibly adjust the entry direction, specific execution points and risk control plans. I will remind you as soon as the market touches key areas, so please pay attention in time.
Gold Trading Strategy:
1. Short gold in batches when it rebounds around 3365-3380, targeting 3350-3340.
2. Go long on gold when it falls back to around 3340-3330, with the target at 3355-3360.

The daily trend has not changed, go long on pullback#XAUUSD
Good morning, and a wonderful day. Last night we expected that if the 3390-3380 level below is effective, then gold will still have room to rise. After the morning opening, gold began to fall and adjust, reaching a low of around 3367, and the overall trend fell into a wide range of fluctuations. From a technical perspective, the daily moving average tends to converge upward, with the middle track located near 3357. Before it effectively falls below, the daily bullish trend remains unchanged. Paying attention to the 4H technical indicators, we find that the MACD indicator death cross with large volume tends to fluctuate and fall. In the short term, we should focus on 3380-3390 above. At present, we should focus on the support at 3350. If it fails to break through effectively, gold will rebound again. On the whole, it is recommended to go long when the price retreats to around 3360-3350 during the day, with the target at 3375-3385.
🚀 BUY 3360-3350
🚀 TP 3375-3385
Gold's decline does not mean a bearish trendGold opened high and closed low today, gradually declining from 3405 and then widening its losses, hitting a low of 3354 in the European session. The intraday short-term trend was clearly weak, with the price still unable to break through 3400 and stabilize. In last week's analysis, I emphasized that if this uptrend fails to stabilize above 3400, a downward turn is possible at any time.
However, in the medium and long term, the bullish outlook remains unchanged. Although 3400 hasn't been broken, after a deep correction, it will likely break again; it's just a matter of time.
It also requires the right opportunity, namely, news stimulus to drive the market. Focus on CPI data. Don't turn bearish based on today's decline; it could potentially rebound tomorrow. Therefore, we recommend avoiding short positions. Even if you do go short, wait for a rebound and use a stop-loss to maintain risk management.
Gold is currently trading sideways around 3360. If it rebounds before the US market opens and reaches the 3378-3380 level, short it with a stop-loss at 3390, targeting 3360-3350.
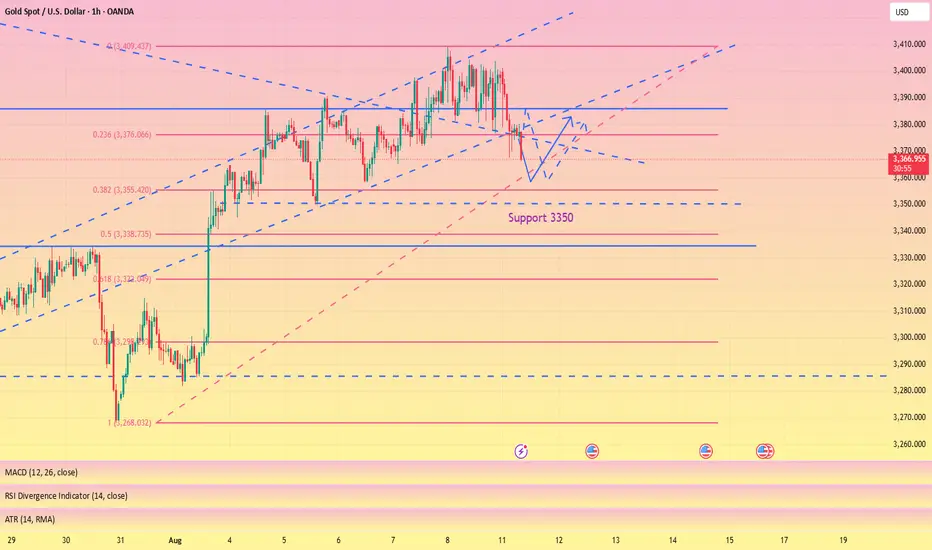
If there's no rebound before the US market opens and the decline continues, then consider a bullish trend around 3345. This was last week's starting point and coincides with the 50% retracement support level. A rebound could be expected if it reaches the watershed level of 3334, with a target around 3380. OANDA:XAUUSD VELOCITY:GOLD VANTAGE:XAUUSD CMCMARKETS:GOLD PYTH:XAUUSD FOREXCOM:GOLD EIGHTCAP:XAUUSD

How to correctly grasp the gold trading opportunities?At present, the suppression of 3410 is still quite strong. After testing the resistance, a short-term long-short reversal was formed, and it retreated and broke the 3380 low support. It is expected to test the 3360 and 3345 moving average supports below today. After falling below the 3380 bullish starting point, the short-term trend will temporarily be mainly downward. Only when it is close to the low support can a new layout be made. Therefore, wait patiently for the low point to be retreated and stabilized before considering going long on gold.

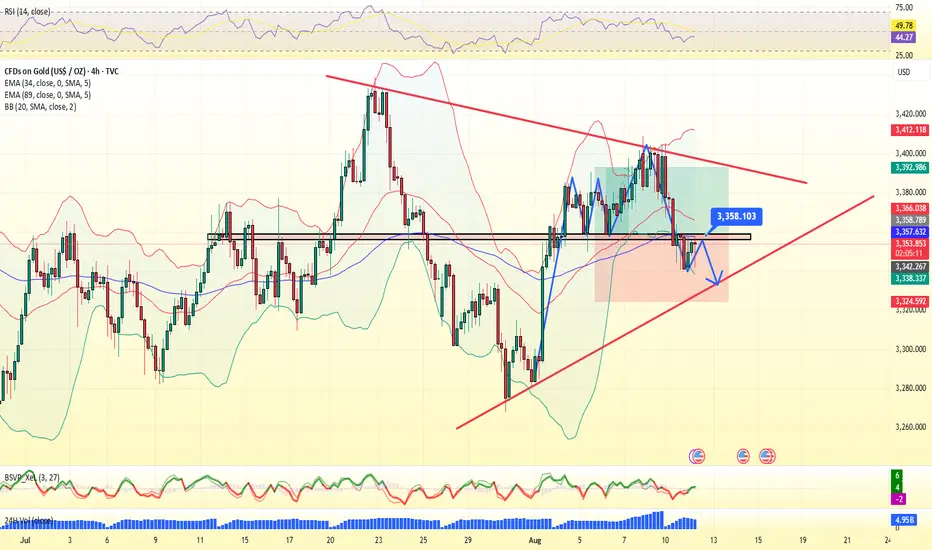
XAUUSD – Technical Analysis H1 (August 11, 2025)1. Overall Trend
On the H1 timeframe, gold is in a clear downtrend after failing to hold the resistance zone at 3,379 – 3,385. The EMA9 has crossed below EMA20, confirming short-term bearish pressure. Strong selling volume in recent candles indicates sellers are currently in control.
2. Key Support & Resistance Levels
Near-term resistance: 3,367 – 3,368 (EMA9 + descending trendline)
Major resistance: 3,379 – 3,385 (previous supply zone + 0.382 Fibonacci retracement)
Near-term support: 3,357 – 3,353 (recent local low)
Target support: 3,333 – 3,332 (0.618 Fibonacci retracement + strong demand zone)
3. Price Action & Pattern
Price has formed a Break & Retest pattern on the descending trendline.
The downside target is set around 3,332, with a potential R:R ratio of ~3.23 for short positions.
High selling volume suggests price may continue testing deeper support levels before any significant rebound.
4. Intraday Trading Strategies
Sell setup: Look for short entries when price pulls back to 3,367 – 3,368, SL above 3,379, TP at 3,333.
Buy setup (scalping): Consider buys only if price tests 3,332 and shows clear bullish reversal signals with declining sell volume.
Maintain strict risk management with R:R ≥ 1:2 and avoid FOMO during high volatility.
5. Conclusion
Gold remains biased to the downside in the short term, with 3,367 – 3,368 acting as the key decision zone for potential continuation shorts. Patience and confirmation signals are crucial for maximizing profit potential.
Follow for more high-quality daily gold trading strategies.

Gold Breaks Rising Wedge – Bearish Targets AheadGold recently broke down from a rising wedge pattern near the $3,385–$3,390 area, signaling potential bearish momentum. Price is currently trading around $3,360, staying below the broken wedge support and also below the main trendline. This breakdown aligns with a shift from short-term bullish to corrective/bearish movement. The trend has shifted bearish unless it reclaims $3,375–$3,388. Short-term bias favors more downside toward $3,350 and $3,342
Key Levels to Watch
- Immediate Resistance: $3,370 – $3,375 (wedge breakdown retest zone)
- Major Resistance: $3,388 – $3,395 (trendline and previous supply zone)
- Immediate Support: $3,350 – $3,352 (short-term Fib and horizontal support)
- Major Support: $3,335 – $3,340 (next demand area)
- Extended Downside Target: $3,322 (Fib 0.22 level)
Note
Please risk management in trading is a Key so use your money accordingly. If you like the idea then please like and boost. Thank you and Good Luck!


Gold Sideways, Awaiting Breakout Confirmation📊 Market Overview:
Gold on the H1 chart is consolidating between $3,375 and $3,404, with buying and selling pressure balanced ahead of U.S. CPI data. Narrow H1 candles suggest imminent volatility.
📉 Technical Analysis:
• Key Resistance: $3.400–$3.410
• Nearest Support: $3.358–$3.351
• EMA: Price hovering around EMA 50, with EMA 9 crossing below EMA 21 → short-term bias slightly bearish.
• Pattern / Momentum: MACD losing bullish momentum, RSI neutral at 48–50, Inside Bar pattern forming on H1.
📌 Outlook:
• A break below $3.351 could drive gold toward $3.333–$3.321.
• Holding above $3.370 and breaking $3.400 could target $3.410–$3.420.
💡 Suggested Trading Strategy:
🔻 SELL XAU/USD : $3.397–$3.400
🎯 TP: 40/80/200 pips
❌ SL: $3.403
🔺 BUY XAU/USD : $3.352–$3.355
🎯 TP: 40/80/200 pips
❌ SL: $3.349

Gold (xauusd): still bullishHello guys!
Price is moving inside an ascending channel.
Recently bounced from mid-channel support (“last kiss”) and heading toward channel resistance.
Potential upside target: $3,435 zone.
As long as the price stays above mid-line support, bullish momentum remains intact.

XAUUSD Buying Opportunity from Key Support ZoneXAUUSD – Gold Price Analysis for August 11, 2025: Buying Opportunity from Key Support Zone
In today’s session, gold (XAUUSD) on the H1 timeframe is pulling back after breaking the short-term support zone at 3,376 – 3,378 and moving down towards 3,356 – 3,358 – which aligns with the 0.618 Fibonacci retracement of the previous bullish swing. This is a key support area where buyers may step in if the market reacts positively.
1. Technical Analysis
EMA: Price is trading below the short-term EMA, showing sellers in control, but the gap is small, leaving room for a potential rebound.
Fibonacci: The 0.618 level around 3,356 acts as a technical pivot and strong support.
RSI: Approaching oversold territory, signaling a possible technical bounce.
Trendline: Price is testing the medium-term ascending trendline from late July. Holding this level would strengthen the bullish outlook.
2. Key Price Levels
Near-term Resistance: 3,376 – 3,378
Major Resistance: 3,383 – 3,384 and 3,393 – 3,395
Near-term Support: 3,356 – 3,358
Major Support: 3,340
3. Trading Strategies
Primary Scenario: Buy around 3,356 – 3,358, stop loss below 3,348, take profit at 3,376 – 3,378, extended targets at 3,383 – 3,393.
Alternative Scenario: If price breaks below 3,348 with strong volume, consider selling towards 3,340 – 3,328.
Today’s bias remains buying at support – taking profit at resistance. Traders should closely monitor price action at these levels to optimize entries.
Follow for more actionable gold trading strategies in the upcoming sessions.

London Gold Early Trading StrategyGold prices saw a slight rise early in the session before retreating due to a brief easing of safe-haven demand. Gold prices have resumed a broad range-bound pattern, with recent price action showing both up and down swings but lacking strong follow-through support. For now, it's best to avoid chasing the rally. As gold prices retreat to support, we recommend initiating a new position. The current price is 3,374 – enter now!
On the hourly chart, gold prices remain in a broad consolidation range. Key support at 3,365 (the previous low) remains holding, and the short-term trend remains tilted to the upside. After a sharp drop to 3,367 this morning, the rebound was strong, confirming solid support near 3,365. Therefore, we continue to buy on dips.
Markets move fast—keep an eye on resistance at 3,410. The big question is whether this consolidation is forming a top or just building momentum for another push higher. If gold keeps failing at 3,410, bears might finally step in. Either way, patience is key—don’t rush into trades just because it’s moving up or down.
