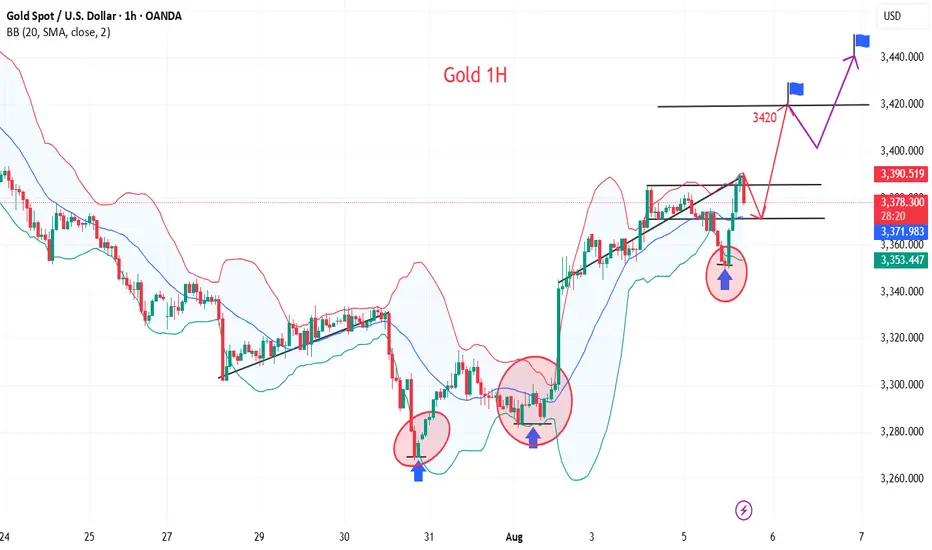
Gold Price Setup – Potential Rejection & Long ScenariosPrice is currently consolidating below the H4 Supply Zone after rejecting the ascending trendline twice.
Two key scenarios are in focus:
✅ Scenario 1 – Deeper Pullback to Demand Zone
A retracement into the 1H + 30M Order Block (OB) and liquidity zone near 3,341–3,355 (marked with $$$) could attract buyers.
If bullish momentum confirms, look for a continuation toward 3,388 and possibly the upper trendline near 3,400+.
✅ Scenario 2 – Immediate Push Higher
If price holds above the moving average and fails to break below 3,355, bulls could step in earlier, driving price back to test the trendline resistance.
Breakout of the trendline could target the higher supply region.
🔍 Key Levels to Watch:
H4 Supply Zone (3,440 area) for potential reversal.
3,341 OB Zone for liquidity sweep and reaction.
Trendline Resistance capping the upside.
Goldlong

Gold Slightly Pulls Back – Awaiting Fed & Dollar Direction📊 Market Drivers:
Spot gold slipped ~0.1% to $3,376/oz, pressured by a firmer USD and caution ahead of Trump’s Fed chair and governor appointments
📉 Technical Analysis
• Key resistance levels:
o $3,390: previous session high – near-term ceiling
o $3,410: weekly high – stronger upside barrier
o $3,435: medium-term resistance – break above confirms strong bullish continuation
• Nearest support levels:
o $3,365: current Asian session low
o $3,345: strong support zone – EMA50 on H4 chart
o $3,305: last week's low – breakdown here may trigger deeper pullback
• EMA: Price remains above EMA09 and EMA50, suggesting a short-term bullish bias, though momentum is slowing.
• Candlestick / Volume / Momentum: Low volume in Asian session; H1 candles show indecision (doji with long wicks), signaling a tug-of-war between buyers and sellers.
📌 Outlook:
Gold may consolidate or dip slightly short-term unless it decisively breaks above $3,395 to confirm a new bullish leg.
________________________________________
💡 Suggested Trading Strategy:
SELL XAU/USD: ~3,392– 3,395
🎯 TP: 40/80/200 pips
❌ SL: ~3,398
BUY XAU/USD : ~3,366 - 3363
🎯 TP: 40/80/200 pips
❌ SL: ~3,360

Gold is waiting to break through near the dense pressure rangeGold (XAU/USD) prices fell slightly during Wednesday's Asian trading session, retreating to around $3,370, snapping a four-day winning streak. Previously, gold prices had hit a nearly two-week high on Tuesday.
Gold's recent rally was driven by the Federal Reserve's policy outlook and safe-haven flows, but a recent shift in market sentiment toward optimism and a slight rebound in the US dollar index have put downward pressure on gold prices.
Risk assets generally rose, including a rebound in Nasdaq futures, temporarily cooling demand for safe-haven assets. Furthermore, the dollar's slight rebound also put pressure on non-interest-bearing gold.
Weak US data heightened economic concerns, supporting expectations of a rate cut this year.
Last Friday's weaker-than-expected US non-farm payroll data, coupled with Tuesday's release of the July ISM Services PMI, which fell to a multi-month low of 50.1, have fueled market concerns about the US economic outlook.
"Both the weak employment index and new orders suggest weakening momentum in the services sector, further strengthening the likelihood of a September rate cut by the Federal Reserve," analysts noted.
The market currently expects the Federal Reserve to implement a 25 basis point interest rate cut at its September policy meeting, with the possibility of a total rate cut exceeding 50 basis points this year. While this expectation has dampened dollar bullish sentiment and provided support for gold, the optimistic stock market sentiment has weakened gold's appeal as a safe-haven asset.
In trade-related news, the US President announced a new round of tariffs on imported semiconductors and pharmaceuticals, accelerating the pace of tariffs on areas such as automobiles, steel, and aluminum.
This move has heightened market concerns about global supply chain risks, maintaining cautious investor sentiment and potentially providing safe-haven support for gold in the medium term.
From a technical perspective, gold prices encountered clear resistance before reaching the $3,400 mark and failed to break through, shifting into a short-term consolidation pattern.
The 4-hour chart shows that gold found support at the 100-period simple moving average (around $3,350) and rebounded, indicating that bulls are still trying to maintain the initiative.
"Currently, hourly and daily oscillators remain positive, but if gold fails to hold above $3,400, it is likely to remain volatile in the short term," market participants noted.
Upward resistance lies at the key resistance zones of $3,400 and $3,430, respectively. A break above this would open an upward trend, targeting the all-time high of $3,500 reached in April.
Initial support lies at $3,350. A break below this would target the intermediate support of $3,322 and the $3,300 mark. A further break below this level could test the one-month low of $3,268.
Although gold prices are currently under short-term pressure, they remain supported in the medium term amidst a slowing US economy, rising expectations of interest rate cuts, and ongoing potential trade frictions. In the short term, the price is expected to fluctuate around the $3,400 level. Focus on speeches by Federal Reserve officials and next week's US CPI data, which may provide new direction for gold. OANDA:XAUUSD VELOCITY:GOLD EIGHTCAP:XAUUSD CMCMARKETS:GOLD PYTH:XAUUSD ACTIVTRADES:GOLD FX:XAUUSD

Gold Maintains Bullish Momentum – Eyes $3,400📊 Market Summary:
Gold surged past the $3,385 resistance to reach a new high at $3,390, driven by weaker-than-expected ISM Services PMI data. The U.S. dollar softened and Treasury yields dipped, fueling the rally. However, after hitting the peak, some profit-taking emerged, causing gold to pull back slightly and currently trade around $3,383.
________________________________________
📉 Technical Analysis:
• Key Resistance:
$3,390–$3,395 – short-term local high. If this zone breaks, the next target is $3,400+.
• Nearest Support:
$3,380, followed by the previous breakout level at $3,365, both likely to act as support during any pullback.
• EMA 09 (Daily):
Price remains above the 9-day EMA, confirming the continuation of the short-term uptrend.
• Momentum / Volume / Candlestick:
RSI is holding above 60 – bullish. However, a long upper wick near $3,390 suggests short-term selling pressure or hesitation.
________________________________________
📌 Outlook:
Gold is showing bullish momentum, with the uptrend confirmed after breaking above $3,385. If price holds above $3,380, there's a strong possibility of testing the $3,400 level. However, a failure to sustain above this zone could lead to a retest of $3,365.
________________________________________
💡 Suggested Trade Strategy:
🔺 BUY XAU/USD : $3,380–$3,383
🎯 TP: 40/80/200 pips
❌ SL: $3,377

XAU/USD(20250806) Today's AnalysisMarket News:
The US non-manufacturing PMI fell to 50.1 in July from 50.8 in June, below the expected 51.5. The ISM New Orders Index fell to 50.3 in July from 51.3 in June, with export orders contracting for the fourth time in five months.
Technical Analysis:
Today's Buy/Sell Levels:
3373
Support and Resistance Levels:
3413
3398
3389
3358
3348
3333
Trading Strategy:
If the market breaks above 3389, consider entering a buy position, with the first target at 3398. If the market breaks below 3373, consider entering a sell position, with the first target at 3358.

Gold rebounded near the key support level of $3,350.Spot gold edged higher during the US trading session after finding strong support near $3,350, reversing an earlier pullback. During the European trading session, gold prices briefly dipped due to improved risk appetite and a slight rise in US Treasury yields, failing to extend Monday's rebound. However, buyers stepped in near the 50-day simple moving average (SMA), pushing prices back from the day's low. The continued weakness of the US dollar, fueled by market confidence in a September Federal Reserve rate cut, supported gold's rebound.
Spot gold struggled to extend last week's rebound and is currently hovering around $3,350.
Last week, gold broke below an ascending triangle pattern, briefly hitting a one-month low, before finding support above the 100-day simple moving average (SMA), suggesting continued bearishness.
Currently, gold is trading slightly above the 50-day SMA, providing immediate support, followed by the 100-day SMA. Further declines could lead to targets near $3,275 and $3,200.
The Relative Strength Index (RSI) on the daily chart is in neutral territory around 55, indicating a lack of clear momentum. Meanwhile, the MACD indicator shows a golden cross with the DIFF crossing the DEA, and the MACD-histogram is positive, indicating accumulating bullish momentum. However, the overall reading is low, and further upward momentum is needed. A sustained golden cross and a larger candlestick pattern would be bullish.
On the upside, if bulls can reclaim the bottom of the broken triangle and decisively push above $3,380, the market could potentially move towards $3,450, or even revisit the all-time high. PEPPERSTONE:XAUUSD VELOCITY:GOLD FXOPEN:XAUUSD CMCMARKETS:GOLD VANTAGE:XAUUSD ACTIVTRADES:GOLD ACTIVTRADES:GOLD ICMARKETS:XAUUSD

Gold breaks through 3400 and is about to challenge a new high
💡Message Strategy
Fundamental Analysis: The Macro Environment and Policy Expectations Are Intertwined
From a fundamental perspective, the recent trend in gold prices is driven by multiple factors. First, rising expectations for a September Federal Reserve rate cut have become a key factor supporting gold prices. Last Friday's US non-farm payroll data, which fell short of expectations and saw a significant downward revision from the previous reading, fueled market concerns about an economic slowdown and pushed US Treasury yields lower.
The increased expectations for a rate cut have reduced the upside potential for the US dollar and US Treasury yields, indirectly providing support for gold.
In terms of market sentiment, a rebound in global stock markets has weakened gold's safe-haven demand. The MSCI World Index snapped a six-day losing streak, with the Asia-Pacific Index rising 0.6%. Japan's Nikkei 225 rose 280 points on Tuesday. Europe's STOXX 50 and STOXX 600 indices both rose approximately 0.4%. The UK's FTSE 100 approached its all-time high of 9,150 points. The three major US stock indices performed particularly strongly on Monday, with the S&P 500 rising 1.5%, the Dow Jones Industrial Average soaring 585 points, and the Nasdaq Composite Index rising 1.9%.
The recovery of risk appetite has made investors more inclined to chase high-yield assets, and the attractiveness of gold has temporarily declined.
📊Technical aspects
Technically, gold is likely to continue trading in a narrow range between its 50-day and 100-day moving averages. Key support levels at $3,350 and resistance at $3,385 will be the focus of near-term bull-bear trading. A breakout from fundamental data or news could signal a clearer trend for gold prices.
In the long term, slowing global economic growth, central bank gold purchasing, and persistent geopolitical risks will continue to provide structural support for gold.
If the bulls can regain their footing on the bottom of the ascending triangle pattern and break through the resistance level of $3,380, gold prices are expected to further challenge $3,440 and even retest the historical high.
💰Strategy Package
Long Position:3370-3375,SL:3350,Target: 3400-3420
GOLD TRADES IN 2025 TILL AUGUSTThat is the result of discipline and consistency.
follow for more swing analysis on indices, commodities,and currencies.

XAUUSD 8/4/25 followupPrice closed strongly above Sunday's open so I am just looking for retracements to the upside from here.

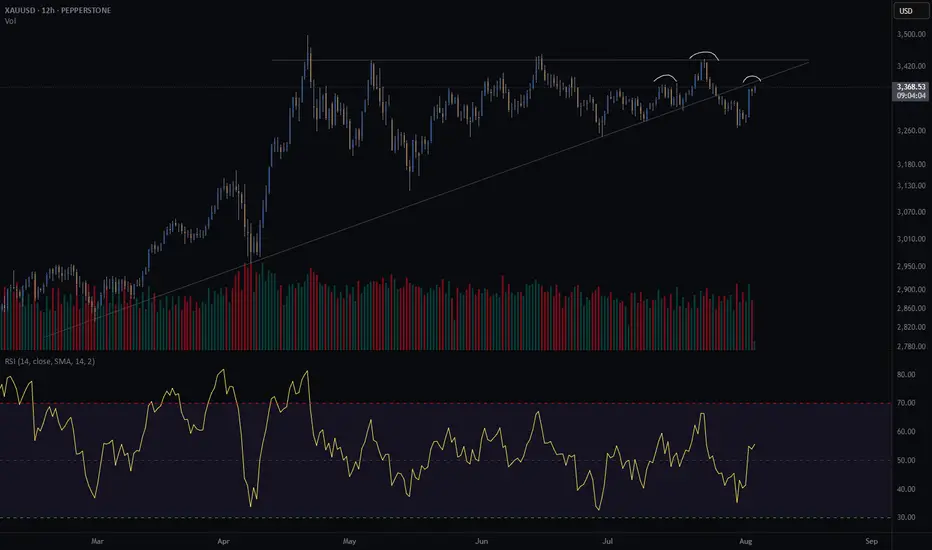
Gold crash (SHORT) - head and shouldersGold is at an interesting crossroad.
It broke through its diagonal support on Friday the 25th of July.
Price is retesting previous support. Does it turn into resistance?
Further confluence is a head and shoulders of the H8 and H12, with the right shoulder coinciding with the retest of the diagonal.
Since I am long gold with my investments, I am hesitant to short gold through my trading business. However, if my pattern is available, I take the trade. This will be a very short term trade - a few days at most if the trade goes in my favour.
Risk/reward = 12.6
Entry price = 3382.5
Stop loss price = 3396.2
Take profit level 1 (50%) = 3230
Take profit level 2 (50%) = 3181
The risk reward is exceptionally high. However, I have taken a more conservative approach with my entry because of my apprehension to short gold. For this trade I will enter at the extreme end of the range in which I will look for entries. This is the reason for such a high RR. It might result in me missing an entry.
XAUUSD Gold move 5 Aug 2025Price is currently reacting off a key 15-minute demand zone between 3352 and 3355, which has previously acted as a strong support level. Bullish rejection wicks within this area suggest buying interest and a possible short-term reversal.
The bias is bullish for a retracement move. A potential long opportunity exists from the 3352–3355 support zone, targeting the 3370 area, which aligns with a previous 15-minute supply zone and breakdown origin.
This setup is based on the expectation of a retracement toward 3370 before any further downside continuation. A clean break and close below 3352 would invalidate the idea and suggest continuation lower.
Confirmation through bullish price action within the zone is advised before execution.

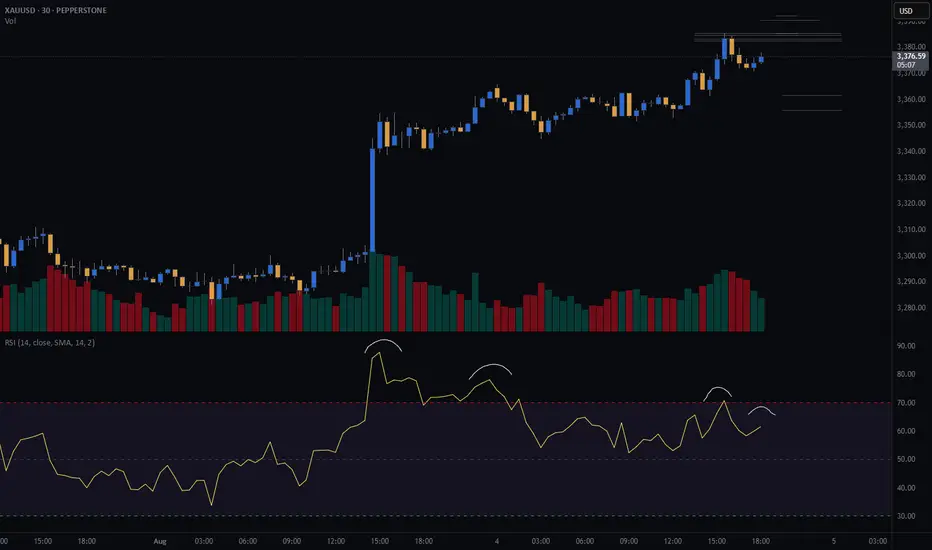
GOLD (XAU) SHORT - Double top 30minRisk/reward = 2.8
Entry price = 3382.5
Stop loss price = 3390.5
Take profit level 1 (50%) = 3361.7
Take profit level 2 (50%) = 3356
I am considering a short on gold.
Still need some variables to fall into place before I enter the trade.
There is nice RSI negative divergence showing declining momentum.
Further confluence:
- Potential head and shoulders on higher time frame
- At area of previous diagonal support which could be turned into resistance if the 30min double top plays out
Gold Eyes QML Resistance: Ready for a PullbackHelloooo!
Gold, after gapping up strongly, has now entered the green QML (Quasimodo Level) supply zone at roughly 3,380–3,390. This zone has acted as resistance before, so a reaction here makes perfect sense.
What I see:
Engulfed Level (3,315.66): Earlier support that got taken out. This is our logical pullback target once the QML zone does its job.
Hurricane Move: The big up-spike looks exhausted now that it’s hit the QML.
Bearish Reversal Odds: if sellers step in around current levels, expect a drop back toward 3,315.
Plan: Watch for bearish candles or a failed rally inside the 3,380–3,390 area. If we see clear rejection, target a swift move down to 3,315, with a further slide possible to the 3,260 demand zone if momentum holds.

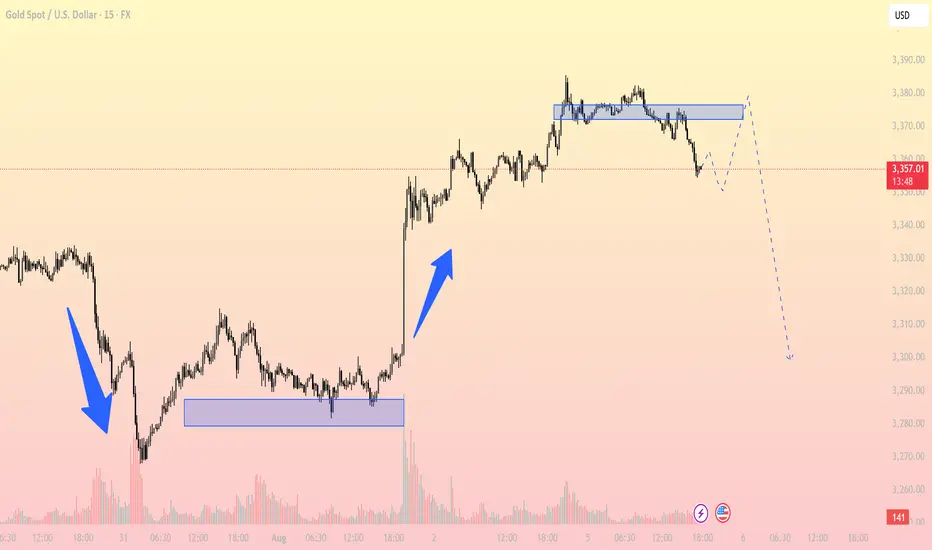
Gold Showing Distribution Signs – Is a Bearish Reversal in Play?Technical Analysis
1. Key Support & Resistance Levels
Short-term Resistance: 3,375–3,380 USD (previous consolidation zone now acting as supply)
Major Support: 3,300 USD (prior breakout base, possible Fibonacci target zone)
Intermediate Support: 3,335 USD (intraday low during the current correction)
2. Structure & Trend
The chart shows a strong bullish impulse on August 2, breaking out of a prolonged consolidation base.
After the breakout, price entered a distribution phase around 3,375 where momentum stalled and volume declined.
A clear breakdown from the distribution zone is now underway, suggesting increased selling pressure and a possible retest of lower demand areas.
3. Price Action Behavior
Price is currently attempting a pullback retest toward the broken structure near 3,370–3,375.
There’s potential for a small head and shoulders pattern, with the neckline near 3,335. A confirmed break below this level could accelerate the move down to 3,300.
4. EMA & RSI Outlook
EMA20 is beginning to turn downward and may soon cross below the EMA50, hinting at a short-term bearish trend shift.
RSI (not shown but worth watching) is likely cooling off from overbought levels, providing space for further downside.
Trading Strategy Ideas:
Sell on pullback to resistance:
Entry zone: 3,370–3,375
Target: 3,335 and 3,300
SL: 3,382
Short-term Buy if RSI oversold + bullish price action: 3,335
Target: 3,370
SL: 3,325
Gold is showing signs of weakness after a sharp rally. The breakdown from the distribution zone indicates a shift in sentiment. If price fails to reclaim 3,375 and confirms below 3,335, the 3,300 support could be the next key destination.
Follow to receive more high-quality trading strategies in upcoming sessions. Save this idea if you found it useful!
Can technical factors boost gold? (Must-read for traders)After three consecutive days of strong rebounds, spot gold has entered a period of sideways trading, trading around $3,370 in the European session, with a short-term seesaw pattern. A slight rebound in the US dollar index has weighed on gold prices, but market expectations of a September Fed rate cut remain supportive. Furthermore, lingering global trade uncertainty has prevented a significant decline in safe-haven demand.
Fundamentals:
Gold's recent upward momentum has been driven by weak US economic data and rising expectations of rate cuts. Last week's non-farm payroll data showed a significant weakening in the labor market, reinforcing market bets that the Fed will begin another round of rate cuts in September. The CME FedWatch tool shows that the market's expectation of a September rate cut has exceeded 90%. Meanwhile, US factory orders plummeted 4.8% in June, further highlighting economic weakness.
On the other hand, US President Trump signed an executive order last week raising tariffs on imports from dozens of countries, with the minimum tariff rate reaching 15% for countries with trade deficits with the US. With these measures about to take effect, this uncertainty continues to weigh on global market sentiment and supports gold's safe-haven properties.
However, a slight rebound in the US dollar partially offset gold's upward momentum. Traders will be watching the upcoming US ISM Services PMI data to determine whether the economic slowdown has spread to the services sector.
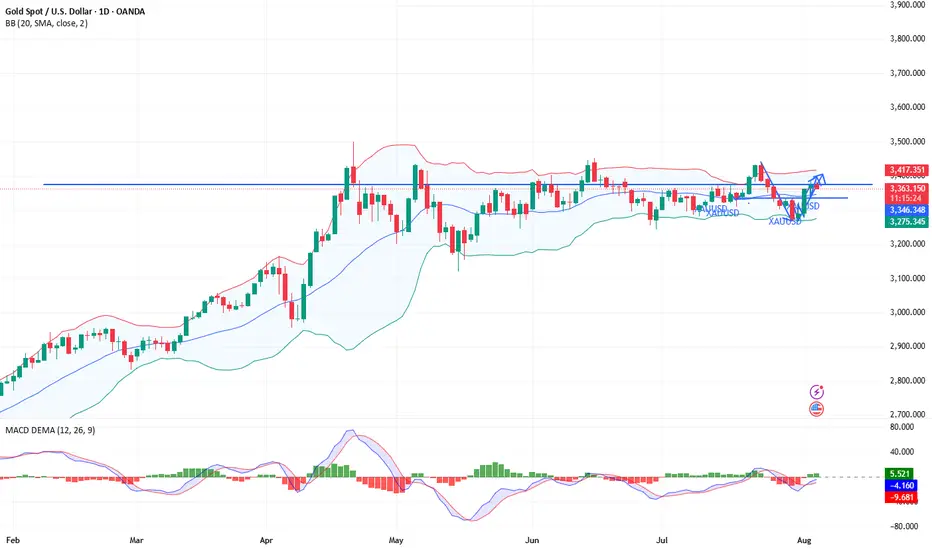
Technical Analysis:
On the daily chart, gold prices have recently traded between the middle and upper Bollinger Bands (3343.59) and 3411.09, failing to break through key resistance. The overall trend remains within the medium-term range, with no clear trend emerging.
The recent candlestick chart pattern forms a typical "sideways fluctuation" pattern, indicating significant pressure near the previous high of 3438.80, while the lower Bollinger Band (3276.09) provides support, suggesting a short-term "box consolidation" pattern.
On the MACD indicator, the fast and slow lines are near the zero axis, while the DIFF and DEA lines have formed a slight golden cross, but the angle is gentle. The red bar has limited momentum, indicating insufficient upward momentum and a lack of a strong rebound.
The Relative Strength Index (RSI) remained at 54.81, within the neutral to strong range, indicating a lack of clear short-term price direction. Market sentiment remains cautious. Further attention will be paid to whether the price stabilizes above the middle Bollinger Band or retreats to test previous support levels.
Market Sentiment Observation:
Current gold market sentiment is cautiously optimistic. Traders are pricing in a high level of interest in the Federal Reserve's rate cut, driving a short-term rebound in gold prices. However, the dollar's resilience remains, limiting gold's upside potential. Indicators show a lack of significant inflows into gold ETFs, suggesting the market has not yet fully shifted to a defensive position.
The technical chart shows a typical "consolidation platform," indicating that the market is awaiting clearer policy or data guidance. Investors remain interested in safe-haven assets, but their willingness to chase higher prices is weak. In the short term, market sentiment may continue to be constrained by fluctuations in external macroeconomic data and shifting policy expectations.
Market Outlook:
Bull Perspective:
Analysts believe that if gold prices break through the upper Bollinger Band at 3411.09 and the MACD indicator expands, further upside potential is expected, with the previous high of $3450 in sight. If the Federal Reserve signals a clear interest rate cut or if the US economy continues to weaken, gold could see a mid-term trend reversal and resume its upward trend.
Bear Perspective:
Analysts believe that if gold prices remain constrained in the 3400-3411 range and fall below the middle Bollinger Band and moving average support, a short-term pullback could occur, testing the lower support band at $3276. If the ISM Services PMI exceeds expectations and the US dollar strengthens again, gold could return to bearish momentum. FOREXCOM:XAUUSD ACTIVTRADES:GOLD ICMARKETS:XAUUSD CMCMARKETS:GOLD PYTH:XAUUSD FOREXCOM:GOLD ICMARKETS:XAUUSD CMCMARKETS:GOLDZ2025 CMCMARKETS:GOLD
Gold Extends Gains as USD Weakens📊 Market Overview:
Gold prices are extending their gains during the Asian and European sessions today, as the US dollar weakens following weaker-than-expected US jobs data. Rising unemployment and a softer Non-Farm Payroll report boosted expectations that the Fed may cut interest rates in September. The US 10-year Treasury yield also dipped slightly, supporting gold's safe-haven appeal.
📉 Technical Analysis:
• Key Resistance: $3,385 – $3,390
• Nearest Support: $3,365 – $3,370
• EMA: Price is trading above the EMA 09, indicating a short-term bullish trend
• Candles / Volume / Momentum: H1 candles show steady buying pressure with stable volume, but we should monitor potential profit-taking if price nears the $3,390–$3,400 zone.
📌 Outlook:
Gold may continue to rise in the short term if USD weakness persists and bond yields stay low. However, failure to break above $3,390 could lead to a pullback toward support levels.
💡 Suggested Trading Strategy:
🔺 BUY XAU/USD: $3,365 – $3,368
🎯 TP: 40/80/200 pips
❌ SL: $3,362
🔻 SELL XAU/USD : $3,392 – $3,395 (if reversal signal appears)
🎯 TP: 40/80/200 pips
❌ SL: $3,398

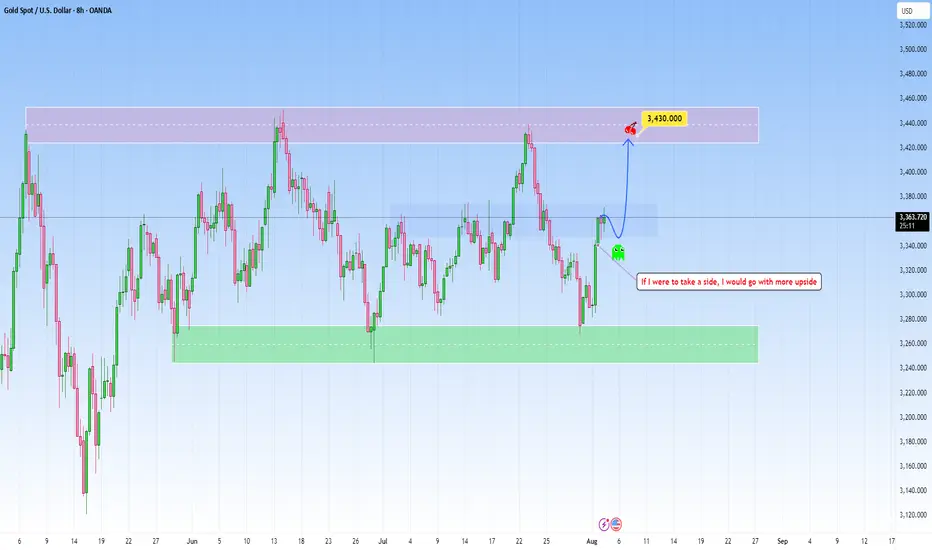
GOLD undecided: Looking for a positive outlookThe current market context on GOLD seems undecided and heavily influenced by news release and macroeconomic catalysts. The recent reversal from the support was pretty decisive, catching short-sellers off guard and forcing them to cover positions.
However, the structure has yet to produce a clean breakout beyond the mid-range, suggesting a lack of strong conviction from either side.
The probability of a pause or reversal here under this circumstances may increase substantially as well. But if I were to take a side I would definitely choose more upside , before any correction begins.
This is a high-risk zone for positioning without confirmation. The market is potentially preparing for a breakout or a fakeout, and patience is key. Wait for clear signs of intent before committing.
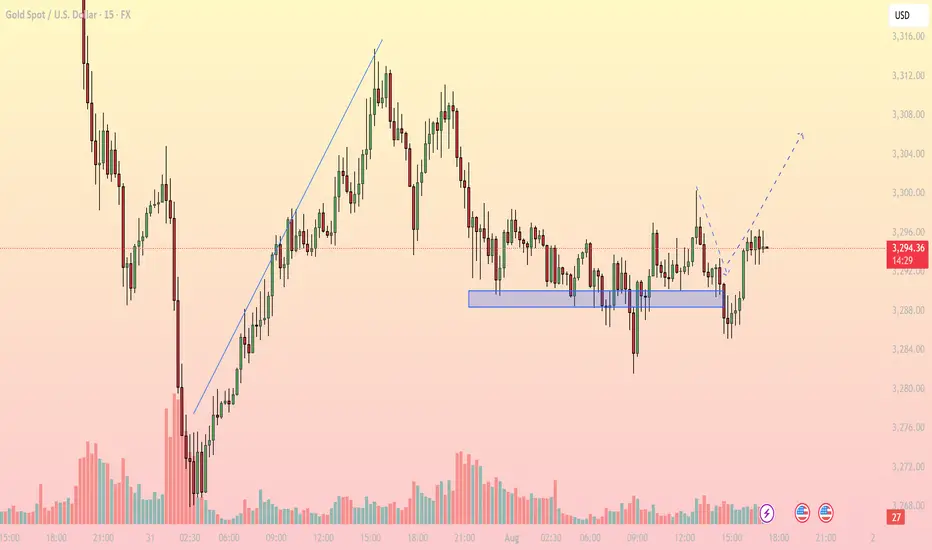
Bullish Rejection from Support, Upside in FocusMarket Overview: On the M15 timeframe, XAUUSD shows signs of a short-term bullish reversal after a prolonged sideways range around the key support zone of 3,286 – 3,289 USD. Price faked out below this support but quickly recovered, forming a V-shape reversal, suggesting strong buying interest has returned.
Key Levels to Watch:
Support Zones:
- 3,286 – 3,289: Strong intraday support, tested multiple times with sharp rejections
- 3,274: Next significant support if the above zone fails
Resistance Zones:
- 3,300 – 3,304: First resistance target aligned with the recent high
- 3,308 – 3,312: Higher resistance area where supply may emerge
Technical Indicators:
EMA: Price has reclaimed the short-term EMAs, indicating bullish momentum on lower timeframes
RSI: Rising above 50 but not yet overbought – there’s room for further upside
Volume: Increasing volume during the bounce confirms buying strength
Trading Strategy:
- Bullish Scenario (Preferred): Entry Zone: Watch for pullback toward 3,290 – 3,292
Stop Loss: Below 3,285
Take Profit 1: 3,300
Take Profit 2: 3,304
Extended Target: 3,308 – 3,312 (if bullish momentum continues beyond breakout zone)
- Bearish Scenario (Alternate): Only valid if price breaks and closes strongly below 3,286
Short Target: 3,274 – 3,270
Note: Counter-trend strategy – higher risk, requires strong confirmation
Conclusion: Gold is showing a bullish price structure on the 15-minute chart. As long as price holds above the 3,286 – 3,289 support zone, the path of least resistance appears to be upward, with 3,300 and 3,304 as the next logical targets. Monitor price action closely during the U.S. session for a potential long setup.
- Follow for more real-time gold trading strategies and save this idea if you find it helpful!
Technical indicators are bullish across the boardInfluenced by the NFP data, gold prices rose strongly, fully recovering last week's losses. The current gold market has broken the previous bull-bear equilibrium and remains in a strong upward trend. We are currently bullish but will not chase the rise. We will wait for gold to fall back and stabilize before trying to go long. Gold is currently in a sideways consolidation. If gold touches the upper short-term resistance of 3365-3370 again in the European session and encounters resistance and pressure, you can consider shorting with a light position and waiting for a pullback. If the gold price breaks up strongly, pay attention to the key suppression level above 3375-3385.
As the price of gold continues to rise, the support has moved up. Pay attention to the short-term support of 3345-3330 below. If it retreats and stabilizes, you can consider going long. Independent traders must strictly implement trading plans, and those who are not sure about the market must set stop-loss orders.
OANDA:XAUUSD

Gold rises for three consecutive days! Buy the dip or hold on?Market News:
Spot gold prices fluctuated at high levels in early Asian trading on Tuesday (August 5), currently trading around $3,380 per ounce. Driven by weak US economic data, rising expectations of a Federal Reserve rate cut, and intensifying global trade tensions, international gold prices continued their upward trend from last Friday, marking their third consecutive day of gains. Driven by expectations of a Fed rate cut, geopolitical risks, and a weakening US dollar, gold maintains strong upward momentum in the short term. From a medium- to long-term perspective, gold's investment value remains significant. Global economic uncertainty, ongoing trade conflicts, and the potential resurgence of inflationary pressures all provide solid support for gold. Investors should pay close attention to the US June trade balance and July ISM non-manufacturing PMI data, which will be released this trading day.
Technical Analysis:
Last week, gold closed with a long lower shadow, a bullish candlestick pattern. This is a clear sign of stabilization, and the price remains firmly within the middle band. This week, the upward trend may continue, with repeated attempts to test the resistance point derived from the lower band of the previous upward trend. This maintains a bullish outlook for the medium- to long-term trend, and represents a period of strength within this bullish trend. The daily short-term trend also remains bullish. The recent three-month consolidation period is a correction, with the lows gradually moving higher. The longer the sideways trend, the stronger the potential for a bull market continuation, both in terms of strength and timing, once it breaks higher. Last Friday, a strong bullish candlestick pattern formed at the bottom, stabilizing the 5-day moving average and returning to the converging triangle channel. This suggests a continued bullish outlook today. A pullback confirms support at the lower band of the converging triangle, approximately 3345-48, also the 10-day moving average. After testing support in today's Asian session, support is indeed present. Focus on the upper band around 3410.
Trading strategy:
Short-term gold: Buy at 3362-3365, stop loss at 3354, target at 3380-3400;
Short-term gold: Sell at 3407-3410, stop loss at 3419, target at 3370-3350;
Key points:
First support level: 3370, second support level: 3363, third support level: 3350
First resistance level: 3397, second resistance level: 3410, third resistance level: 3422

XAU/USD(20250805) Today's AnalysisMarket News:
Goldman Sachs: We expect the Federal Reserve to cut interest rates by 25 basis points three times starting in September; if the unemployment rate rises further, a 50 basis point cut is possible.
Technical Analysis:
Today's Buy/Sell Levels:
3367
Support and Resistance Levels:
3407
3392
3383
3352
3342
3328
Trading Strategy:
If the stock breaks above 3383, consider buying, with the first target price at 3392. If the stock breaks below 3367, consider selling, with the first target price at 3352.

GOLD is Flying High, I won't miss the rocketConfirmation:
If 4H price action closes above Previous Day's High (PDH), I will be looking for longs.
Within my Area of Opportunity (AoO), I have outlined targets with their success rate.

Gold Breaks Resistance – May Target $3400 Next📊 Market Overview:
• Gold continues to rally in early U.S. session as September rate cut expectations by the Fed rise due to weak jobs data.
• U.S. Dollar weakens and 10Y Treasury yield falls, supporting gold.
• Risk-off flows and long-term inflation concerns push safe-haven demand for gold.
📉 Technical Analysis:
• Key Resistance: $3,390–$3,400 (short-term breakout zone)
• Nearest Support: $3,365–$3,370
• EMA: Price is trading above EMA09 and EMA50, confirming bullish momentum
• Candles / Volume / Momentum: Consecutive bullish H1 & H4 candles above $3,375 confirm breakout. Volume increasing, suggesting strong buying pressure.
📌 Outlook:
Gold may continue rising toward $3,400 if current bullish momentum holds. However, short-term pullback or profit-taking near $3,395–$3,400 is possible after a rapid $50+ rally.
💡 Suggested Trade Setups:
🔺 BUY XAU/USD : $3,375–$3,378 (pullback buy)
🎯 TP: $3,395–$3,400
❌ SL: $3,372
🔻 SELL XAU/USD: $3,397–$3,400 (countertrend short)
🎯 TP: $3,375–$3,380
❌ SL: $3,403
