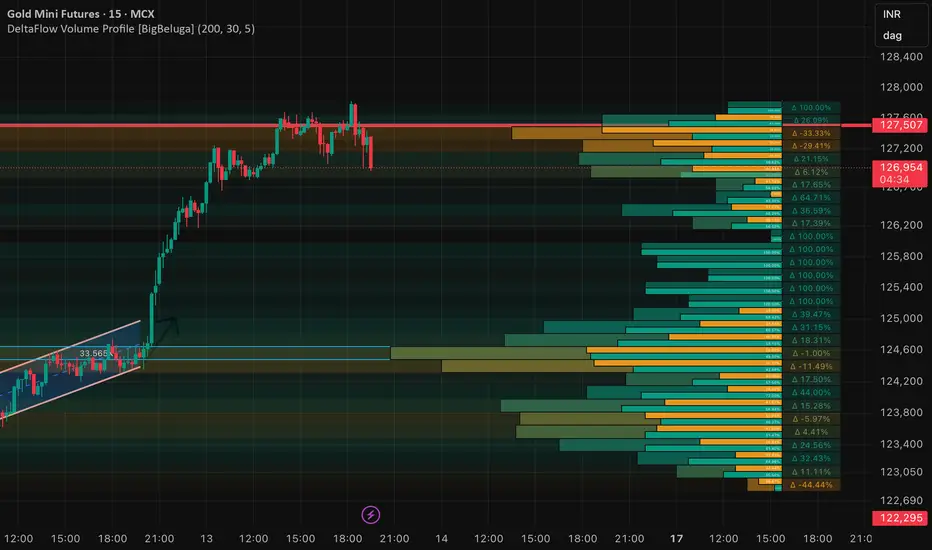
GOLD Near Levels of Interest and Buyer Aggession. Another Rally?Gold is near key levels where buyers aggression has been seen in the past. Another rally brewing in GOLD?
Recently US Govenrment reopening has raised chances of interest rate cuts in December which can boost Gold prices further. All eyes on key US data points coming around 2200-2300 IST
Follow me for more such updates
Goldlong
Gold Pulls Back to 4200 – Awaiting Direction Confirmation📊 Market Overview
Gold (XAU/USD) has just dropped from the resistance zone $4218–$4219 down to $4203.
The market is currently reacting near the support zone $4200–$4205, with buying pressure starting to appear, but short-term bullish momentum is weakening.
The H1 trend remains slightly bullish, with EMA20 & EMA50 pointing upward, providing support around $4205–$4210.
📉 Technical Analysis
• Main Trend: Slightly bullish (bullish bias).
• EMA20 & EMA50 H1: Upward sloping, support at $4205–$4210.
• Resistance: $4218 – $4222, further $4230 – $4235
• Support: $4205 – $4200, further $4195 – $4190
• RSI H1: Dropping from overbought → warning of a short-term pullback.
📌 Outlook
• The $4205–$4207 zone is a key support; if price holds, a rebound toward $4212–$4215 is likely.
• If price breaks below $4205, a deeper drop toward $4195–$4190 may occur.
• H1/H4 candle signals will determine the next breakout direction; priority is to BUY on support bounces and SELL on clear rejection at resistance.
________________________________________
💡 Trading Strategy
🔺 BUY XAU/USD: $4190 – $4193
• TP: 40 / 80 / 200 pips
• SL: $4186
🔻 SELL XAU/USD: $4233 – $4236
• TP: 40 / 80 / 200 pips
• SL: $4239

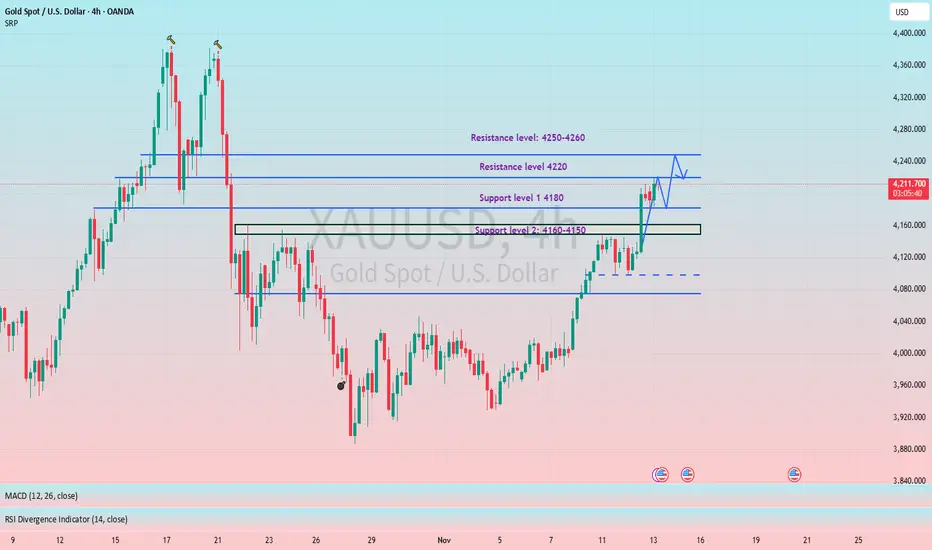
The bullish trend remains unchanged; we remain bullish on gold.#XAUUSD OANDA:XAUUSD TVC:GOLD
The daily chart is above the MA5 moving average, indicating that the bullish trend remains unchanged. However, we do not chase the price at high levels. Our core strategy is to wait for a pullback to support before going long. From the hourly chart, gold is fluctuating within the 4220-4180 range in the short term. If gold retraces to the short-term support of 4190-4180 during the European session, it is advisable to continue to go long on gold, with key support at 4160-4150. If the price rebounds to the previous high of 4250-4260, then yesterday's strategy remains valid.
XAU/USD – Key Levels Ahead of U.S. Data🌐 MARKET CONTEXT
Gold is trading in a pivotal moment as safe-haven demand remains elevated while the Federal Reserve’s future policy path becomes less certain. The recent report noted that gold prices reached over $4,213/oz on November 13, 2025.
Trading Economics
Meanwhile, broader macro commentary highlights that escalating global uncertainty is sustaining gold’s safe-haven appeal.
World Bank Blogs
Sentiment currently:
Risk-on for gold when geopolitical/fiscal concerns intensify or real yields fall.
Risk-off for gold if the USD strengthens or the Fed signals fewer rate cuts than expected.
For the upcoming London → New York sessions: expect heightened sensitivity to U.S. inflation/job data and strong reactions near structural zones. The bias today remains conditionally bullish, but we must remain alert for bearish reversal if price fails at key supply zones.
📉 TECHNICAL ANALYSIS (SMC + Liquidity Structure)
The price is showing signs of consolidation near major structural zones — this suggests a build-up of liquidity rather than a clean breakout.
Key structure to watch:
If support zones hold and we see a Change of Character (CHoCH) (i.e., lower-low becomes higher‐low) → bullish continuation.
If price reaches a major supply zone and shows a sweep or fake breakout then rejection → potential Break of Structure (BOS) to the downside.
Liquidity zones:
Demand clusters around the 4,081–4,083 and deeper around 3,990–3,988 represent potential absorption/accumulation areas.
Supply is concentrated near 4,080–4,078 (and the newly defined higher sell zone) — watch for liquidity hunt above and returning drop.
Confirmation cues: look for wicked candles, liquidity sweeps, mitigation bars, or M5/M15 structure break before entry.
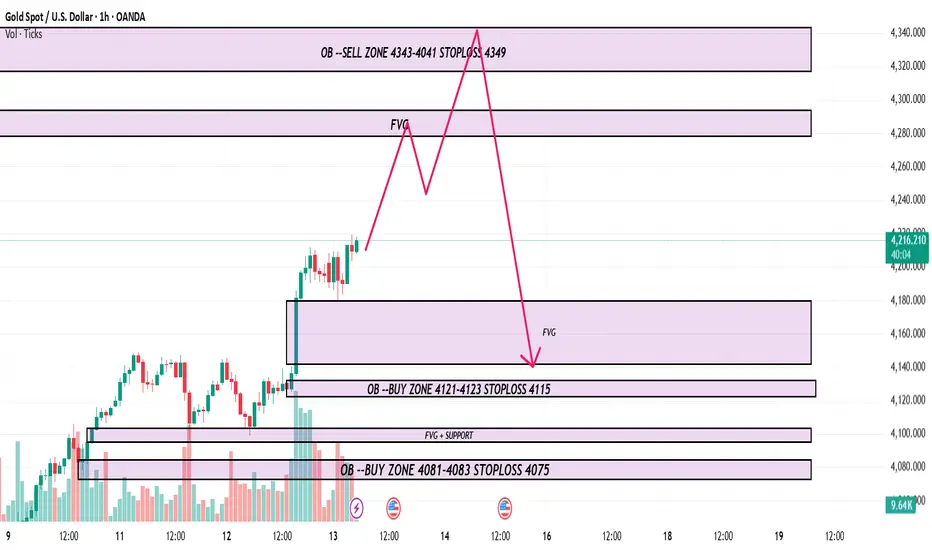
🔑 KEY PRICE ZONES
4,343 – 4,041 ▶️ Sell Zone – High-range supply cluster where short-bias may apply.
4,121 – 4,123 ▶️ Buy Zone – Structural demand zone for medium-term long setups.
4,081 – 4,083 ▶️ Buy Zone – Intraday demand / reversal potential.
3,990 – 3,988 ▶️ Buy Zone (deep support) – High reward if touched with confirmation.
Stop-loss levels:
Sell stop-loss: 4,349
Buy stop-loss (4,121 zone): 4,115
Buy stop-loss (4,081 zone): 4,075
Buy stop-loss (3,990 zone): 3,982
⚙️ TRADE SETUPS
✅ BUY SCENARIO 1 – STRUCTURAL DEMAND (MID)
Entry: 4,121 – 4,123
Stop-loss: 4,115
TP1: ~4,150 TP2: ~4,190 TP3: Open
Logic: Price returns to demand zone → confirmation required (sweep + rejection) → structural long.
✅ BUY SCENARIO 2 – INTRADAY REACTION DEMAND
Entry: 4,081 – 4,083
Stop-loss: 4,075
TP1: ~4,105 TP2: ~4,140 TP3: Open
Logic: Pull-back into middle zone -> quick reaction long for London session.
⚠️ SELL SCENARIO – SUPPLY REJECTION
Entry: 4,343 – 4,041
Stop-loss: 4,349
TP1: ~4,000 TP2: ~3,950 TP3: ~3,900
Logic: Price into upper supply zone → watch for rejection pattern or liquidity sweep above → short trigger.
🧠 NOTES / SESSION PLAN
Focus on buy setups in London session from 4,081 zone and deeper 3,990 zone.
Shift to sell setup if price moves into 4,343–4,041 and shows rejection during New York session.
Avoid entering immediately before major U.S. economic releases; look for confirmation (M5/M15) after news.
Risk-management: each trade max ~2% account risk; adjust size accordingly. Trail stop once TP1 achieved.
Expect choppy price action and fake moves; patience and structure confirmation are key.
🏁 CONCLUSION
Today’s plan: Bias leans bullish conditionally, with multiple buy zones at 4,121–4,123, 4,081–4,083, and 3,990–3,988 offering structured opportunities. However, a strong sell trigger remains valid at the supply zone 4,343–4,041, if rejection occurs. Trade should be guided by confirmation, strict risk control, and alignment with SMC structure.
XAUUSD: Gold is going to hit $5,000 USD. 1. Uptrend Confirmation:
• After a period of correction/sideways movement (from around mid-October to early November), the recent Heikin Ashi candles have started turning green/bullish (corresponding to the dark green color in your target zone).
• The green candle bodies are lengthening and have short or non-existent lower wicks, which is a classic sign of a strong and sustainable uptrend on a Heikin Ashi chart.
2. Short-term Resistance Breakout:
• The current price ($4,087.880) has broken above the previous short-term resistance area (the red line and the price zone around $4,003.410 - $4,091.265), and is above the moving averages (EMAs - the thin red and green lines), indicating that buying pressure has taken control.
3. Buy Trade Setup (Long Position):
• The chart shows a BUY trade setup with an entry price within the $4,091.265 region.
• Take Profit (TP) Target: Set at a very high level, $4,987.515. This implies an extremely strong expectation for price appreciation, possibly based on extended analysis (Fibonacci Extension) or large institutional price forecasts.
• Stop Loss (SL) Level: Set at $4,003.410, just below the old support/resistance zone, demonstrating clear risk control.

GOLD H1 – Awaiting CPI Data for Next Big Move🟡 XAUUSD – Intraday Smart Money Plan | by Ryan_TitanTrader (12/11)
📈 Market Context
Gold remains in a controlled retracement phase after a strong impulsive leg last week. The market is now consolidating within a defined 1H range, showing clear reactions near short-term EMAs as traders await today’s U.S. CPI release, a key driver of intraday volatility.
• A higher-than-expected CPI could reignite USD strength and push gold toward the discount zone.
• A softer CPI print may trigger a renewed push into the premium zone, inviting liquidity grabs above 4200.
Institutional flows remain balanced between short-term profit-taking and position building ahead of the inflation print, suggesting engineered liquidity sweeps before the real move unfolds.
🔎 Technical Analysis (1H / SMC Style)
• Structure: Market structure is still bullish but showing distribution signs at the top of the range.
• Premium Zone: 4201–4199 aligns with unmitigated supply — a prime area for potential sell-side reaction if CPI sparks a bullish liquidity sweep.
• Discount Zone: 4083–4081 overlaps with the 0.618 Fibonacci retracement and sits just above EMA100 — an ideal re-accumulation area for institutional buys.
• Liquidity: Equal lows near 4080 and equal highs near 4200 make both sides vulnerable to engineered stop-hunts before direction is confirmed.
🔴 Sell Setup (Premium Reaction Zone)
• Entry: 4,201 – 4,199
• Stop-Loss: 4,210
• Take-Profit Targets:
→ 4,140 (first liquidity pocket)
→ 4,102 (mid-range equilibrium)
→ 4,083 (discount zone confluence)
📌 Only valid if CPI causes a liquidity sweep into premium, followed by M5–M15 bearish BOS confirmation.
🟢 Buy Setup (Discount Reaction Zone)
• Entry: 4,081 – 4,083
• Stop-Loss: 4,074
• Take-Profit Targets:
→ 4,102
→ 4,140
→ 4,199
📌 Only valid if price sweeps 4080 liquidity and reclaims structure with bullish BOS on M15 timeframe.
⚠️ Risk Management Notes
• Wait for CPI-induced volatility before executing any setup.
• Avoid mid-range trades between 4100–4140 — this is equilibrium noise.
• Reduce size pre-news; volatility spikes can trigger premature stops.
• Scale partials at each liquidity pocket and trail stop-losses accordingly.
✅ Summary
Gold is consolidating ahead of CPI, with dual liquidity zones clearly defined:
• Sell zone: 4201–4199 (premium reaction area)
• Buy zone: 4083–4081 (discount re-entry area)
The market is likely to hunt one side of liquidity before revealing true intent. Traders should remain patient, trade from extremes, and align entries with confirmed structure shifts.
FOLLOW @Ryan_TitanTrader for real-time SMC updates ⚡

Gold continuation patternHere's exactly my idea, confirm it before you enter a trade! daily and 3H timeframe gaps. recommended to hit that gap only before it retraces back to 3600-3700 or above zone again.
Wait for that entry buy zone again. Or if you want to short this idea. look on 3H swept.
Chart is on daily. we might see 4180-4200, that's my short zone!
If you're having a good thoughts comment yours. this is a free community. Been dealing this moves. It's my base fibonacci level 1.61 above/retrace! before the price continues higher.
Follow for more. Watch only my zones entry buy/sell , Long/short! choose wisely.
To invest in my idea direct/private me here! with 70-30 split profit!

Gold
After a strong bullish move, I was expecting a correction.
Now the price has entered the correction phase, and I’m waiting at the marked level on the chart to take a long position if a proper signal appears ✅

Gold (XAUUSD): Buy setupGold (XAUUSD): Buy setup. A good setup is appearing in 1H timeframe. Wait for break and buy.
Cheers

Gold 30 m – Gatekeeper Zone: Momentum or Pullback1. Fundamental Overview
Gold (XAU/USD) finds support amid safe-haven demand and expectations for a Federal Reserve rate cut, which eases the opportunity cost of holding gold.
The relaxing risk-sentiment (e.g., government funding issues, geopolitical risks) is adding to underlying buying pressure.
On the flip side: A stronger U.S. dollar and improved risk appetite may cap upside in the near term.
Fundamental bias summary: Neutral-to-bullish. The backdrop remains supportive, but momentum needs to catch up.
2. Technical Analysis (30 Minute Frame)
Price recently approached the USD 4,150-4,155 zone but showed signs of hesitation.
Key levels to watch:
Resistance zone: ~ USD 4,150-4,200. A clear break and close above here on 30m would signal momentum.
Support zone: ~ USD 4,050-4,000. A break below this region risks a pullback.
Technical indicators: The RSI remains above mid-line, suggesting room for upside—but momentum is not yet decisive.
Technical bias summary: Slight bullish tilt only if a breakout above ~4,150 occurs. Otherwise, risk of consolidation or pullback increases.
3. Trade Plan & Key Levels
📌 Bullish Scenario:
Entry: Go long if price closes on a 30-minute candle above ~USD 4,150 and retests it.
Stop-Loss: Around USD 4,000, below key support.
Targets:
TP1: ~USD 4,250
TP2: ~USD 4,350 (if breakout is strong)
📌 Bearish Scenario:
Entry: Consider short if price rejects the 4,150-4,200 zone and breaks below USD 4,050-4,000 on 30-min chart.
Stop-Loss: Around USD 4,170.
Targets:
TP1: ~USD 3,900
TP2: ~USD 3,800
📌 Wait Mode:
If price remains trapped between ~4,050 and ~4,150 without clear trigger → hold off and wait for clarity.
4. My View for Today
I am leaning conditional bullish: the fundamentals support gold, but the trigger will be a technical breakout above ~USD 4,150. If that happens, upside momentum could run toward ~4,250+ levels.
If no breakout, the more likely scenario is sideways action or a pullback toward ~USD 4,000-3,900. I will not chase until a clear 30-minute confirmation emerges.

Gold Trade Setup: LongEntry: **$4100**
Stop Loss: **$4050**
Take Profit: **$4199**
Risk/Reward: **≈ 1.5:1**
Not financial advice — for educational purposes only.
**Tags:**
Gold XAUUSD Trading Setup PriceAction RiskManagement

XAUUSD-GOLD-4H / at a Crossroads: Symmetrical Triangle AnalysisDear Traders,
I’ve prepared a special XAUUSD–gold analysis for you. Gold is currently moving within a symmetrical triangle formation. If gold breaks upward within this triangle and closes a candle, the first target will be the 4160 level. If it breaks downward, the first target will be the 3800 level.
I share these insights because I truly value you. Each follower is precious to me, and together we are like a family here. Every like and show of support motivates me to continue providing these analyses. Thank you sincerely to everyone who stands by me.
With respect and affection.
-TraderTilki

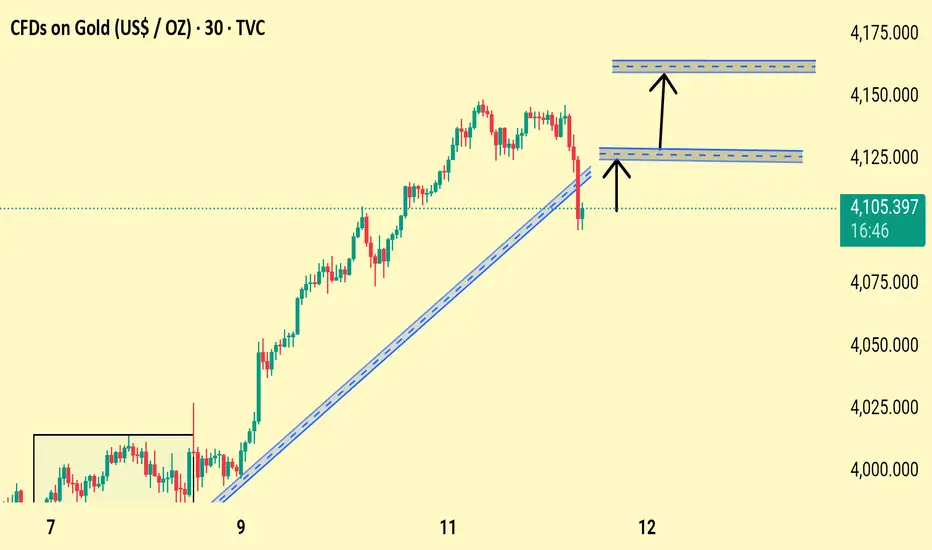
Gold Price Rebound Setup After Trendline Break – Bullish TargetsGold has pulled back sharply after breaking below the ascending trendline, but price is now stabilizing near the 4100 zone. Chart highlights two key bullish reaction levels around 4120 and 4158, where buyers may re-enter. A clean push above 4120 could open the path toward the upper resistance near 4158, signaling continuation of the broader uptrend.
✅ Trend Break but Recovery Attempt
Price broke below the rising trendline, showing short-term weakness. However, buyers quickly reacted, pushing price back above the 4100 level.
✅ Key Levels to Watch
Immediate resistance: 4120
Next bullish target: 4158–4160 zone
✅ Bullish Scenario
If gold holds above 4100–4105, price can retest 4120.
A breakout above 4120 should trigger momentum toward 4158–4160.
✅ Bearish Risk
A drop back below 4100 invalidates the bullish setup and may push price toward 4060.
Gold (XAUUSD) 15-Min: Structure & OutlookThe 15-min chart highlights we are tracking wave E of a contracting triangle in gold 15-min. Watching for price reaction at the Fibonacci area. Expecting to push up Chart marked with key levels and pivots.

ANFIBO | XAUUSD - Better Buy than Sell today [11.12.2025]Hello guys, Anfibo's here!
XAUUSD Analysis – Daily Trading Plan
Overall Picture:
OANDA:XAUUSD is currently trading within a sideways range between 4145 and 4100, showing signs of compression as the market awaits a potential breakout. After an extended bullish phase, price is now consolidating, creating equilibrium between buyers and sellers before the next directional move. The nearest key support zone lies between 4075 – 4095, followed by deeper demand areas around 4040 and 4006, which could serve as ideal buy setups if price retraces. Given the overall market structure and sustained bullish sentiment, I continue to favor Buy positions over Sell setups for today’s session.
Trading Plan for Today:
>>> BUY ZONE:
(1) ENTRY: 4075 – 4090
SL: 4070
TP: 4130 – 4150
(2) ENTRY: 4035 - 4045
SL: 4030
TP: 4090 – 4120 – 4150
(3) ENTRY: 4110 - 4115 (scalp/small vol)
SL: 4100
TP: 4140 - 4150
Risk Management:
- Prioritize Buy setups in line with the dominant trend; Sell only for short-term scalps.
- Keep stops tight, as a breakout can invalidate range setups quickly.
- Maintain a Risk:Reward ratio ≥ 1:2 on all trades.
- Avoid overtrading before the breakout confirmation.
Conclusion:
OANDA:XAUUSD is currently consolidating within a narrow sideways channel, but momentum continues to favor the bulls. As long as the price holds above 4075, the structure remains constructive, and the next bullish leg could form anytime upon breakout confirmation. My bias today stays bullish, focusing on buying dips near key supports and managing risk tightly until the market reveals its next move.
HAVE A WONDERFUL DAY, GUYS! ;)

Gold – Buy around 4100, target 4160-4199Gold Market Analysis:
Yesterday, we placed buy orders at 4134 and 4125, which are currently showing a winning streak. Our bullish outlook remains unchanged. Gold prices plunged to 4097 at the end of the day before rebounding sharply. This is the market; regardless of its fluctuations and corrections, it will eventually return to its intended direction. Don't change your strategy based on a small dip or fluctuation. We maintain our bullish outlook for today's Asian session. The daily chart closed with a doji, indicating continued trading activity. However, the daily moving average support has started to rise, suggesting that buying pressure is building. The consolidation is simply to allow more buying momentum to accumulate. This upward move has been very strong, and there are no signs of a top yet. We anticipate a correction starting on Friday or Thursday. The hourly chart shows a V-shaped pattern. Today, we will use the 4100 support level to place buy orders. Additionally, the strong daily moving average support has reached 4071. From a technical perspective, as long as yesterday's low is not broken, the buying strategy should remain unchanged. During the Asian session, pay attention to the 4100-4130 support zone. This is only minor support; strong support remains around 4100. If yesterday's high of 4149 is broken, it's worth considering chasing the price higher. However, note that 4161 is a significant resistance level.
Support: 4130-4100; Resistance: 4149-4161; 4100 is the key level for market strength/weakness.
Fundamental Analysis:
There are no major data releases today; all are routine data. The most important data this week is tomorrow's CPI, which has seen significant fluctuations over the past year.
Trading Recommendation:
Gold – Buy around 4100, target 4160-4199

Bullish Gold - Testing $4200 very soonWe brokes previous sell zones, and now they're our new demand zones.
The resistance levels upcoming are very weak, and I expect gold to pass through them easily.
Overall very bullish

XAU/USD) Bullish trend analysis Read The captionSMC Trading point update
Technical analysis of XAU/USD (Gold) on the 1-hour timeframe. Here’s a detailed breakdown of the idea:
---
Context & Structure
The market has been in an uptrend, confirmed by a strong impulsive leg upward.
The current pullback retraced into a key demand zone (highlighted blue box), aligning with:
The 0.705 – 0.79 Fibonacci retracement zone, often a high-probability reversal area.
The EMA(50) at 4,092, which provides dynamic support.
---
Key Technical Elements
1. Demand Zone (Blue Box):
Price has tapped into the discount area of the previous bullish move. This area is expected to attract buyers.
2. Fibonacci Confluence:
The retracement aligns with the 70.5–79% zone, suggesting potential exhaustion of the pullback.
3. EMA Support:
EMA(50) and EMA(200) are both trending upward, reinforcing bullish structure continuation.
4. Liquidity Sweep:
The lower wick into the demand zone may represent a liquidity grab before the next bullish leg.
---
Projected Scenario
Expected reaction: bullish rejection from the 0.705–0.79 zone.
Price is anticipated to form a short-term higher low and then continue upward.
Target Point: 4,161.261 — aligns with the prior swing high / equal highs liquidity area.
---
Trade Idea Summary
Bias: Bullish continuation
Entry Zone: 4,100–4,090 area (within blue zone)
Confirmation: Bullish reversal candle or break of minor internal structure upward
Target: 4,161
Invalidation: Clean break below 4,085 (below demand zone and EMAs)
---
please support boost 🚀 this analysis

#XAUUSD: Will There Be Major Price Correction On Gold? Dear Traders,
Gold has been rallying with strong bullish momentum and has not experienced a major correction since the last few weeks. We have identified a key level from which the price can continue its bullish momentum if fundamentals do not change. Furthermore, we can target $4200 in a few weeks if the current momentum continues.
Best regards,
Team Setupsfx_

A reversal? No! Our bullish outlook remains unchanged!#XAUUSD OANDA:XAUUSD TVC:GOLD
Looking at the hourly and 4-hour charts, the technical indicators are diverging, indicating a need for a pullback correction. In the short term, it may test the 4115-4105 support level. Therefore, do not trade blindly in the short term, wait for the price to pull back to the support level before participating in long positions.

BUY GOLD (XAUUSD) - Amazing opportunity XAUUSD (Gold) has been stuck inside a sidewards channel and has struggled to break through it for a while. However, the price recently broke above the green trend line which acted as a medium resistance level (which means the price is very likely to head to the next major resistance zone which will is marked as the take profit level). XAUUSD is clearly bullish and will be heading upwards in the next few days. BUY!

GOLD HOLDS UNDER PRESSURE – RETESTING $3130 SUPPORT ZONE🟡 Market Overview
Gold (XAU/USD) is trading around $3137/oz, slightly lower amid bank holidays in the U.S., leading to thin liquidity and limited volatility within the $3130–$3145 range.
📊 Technical Analysis
• Resistance: $3145 – $3152
• Support: $3130 – $3124
• EMA 50: still sloping downward, indicating short-term bearish momentum.
• Candlestick Pattern: M15 chart shows rejection wicks near $3130, suggesting short-term buying defense.
• RSI (14): recovering from 35 to 45 — signaling a potential minor rebound.
💬 Outlook
Gold remains under moderate pressure but could see a technical rebound if $3130 holds firm. A recovery toward $3145–$3152 is possible before the next directional move develops.
🎯 Trading Strategy
🔺 BUY XAU/USD
Entry: $3130–$3134
🎯 TP: 40 / 80 / 200 pips
🛑 SL: $3124

The bull market has returned. Am I bullish at this price level?#XAUUSD TVC:GOLD OANDA:XAUUSD
Gold prices performed strongly yesterday, closing with a large bullish candle on the daily chart and stabilizing above the daily MA5, officially signaling the return of bulls to the market.
Gold strengthened further today, and from a technical perspective, the bullish trend remains intact. Therefore, continuing to go long on gold is clearly safer. The bullish signal given last night regarding a pullback to the 4075 support level remains valid. However, with the passage of time and the continued strength of gold, a direct pullback to this level in the short term is somewhat difficult. But as a point of multiple pullbacks on smaller timeframes and near the daily MA20, the 4075 support remains reliable. Therefore, we can consider it a defensive level for the short-term bulls. As long as gold prices remain above this level, the bullish momentum will not change.
Currently, looking at the hourly chart, the 4125-4110 range is the support zone for the short term. If the price retraces to this level during the European session, it would be a good entry point, and we can continue to go long on gold within this range.
