The bull market has returned. Am I bullish at this price level?#XAUUSD TVC:GOLD OANDA:XAUUSD
Gold prices performed strongly yesterday, closing with a large bullish candle on the daily chart and stabilizing above the daily MA5, officially signaling the return of bulls to the market.
Gold strengthened further today, and from a technical perspective, the bullish trend remains intact. Therefore, continuing to go long on gold is clearly safer. The bullish signal given last night regarding a pullback to the 4075 support level remains valid. However, with the passage of time and the continued strength of gold, a direct pullback to this level in the short term is somewhat difficult. But as a point of multiple pullbacks on smaller timeframes and near the daily MA20, the 4075 support remains reliable. Therefore, we can consider it a defensive level for the short-term bulls. As long as gold prices remain above this level, the bullish momentum will not change.
Currently, looking at the hourly chart, the 4125-4110 range is the support zone for the short term. If the price retraces to this level during the European session, it would be a good entry point, and we can continue to go long on gold within this range.
Goldlong

Gold Technical Outlook:
Price has stabilized above the 4105 level, indicating a potential bullish continuation toward the resistance zone at 4160.
A break and confirmation above 4160 on the 1-hour or 4-hour candle would strengthen the bullish sentiment and open the way for further upside targets at 4188 and 4220.
However, if the price drops and breaks below 4105, this would invalidate the bullish scenario and shift the outlook toward a downward move targeting the 4075 support level.

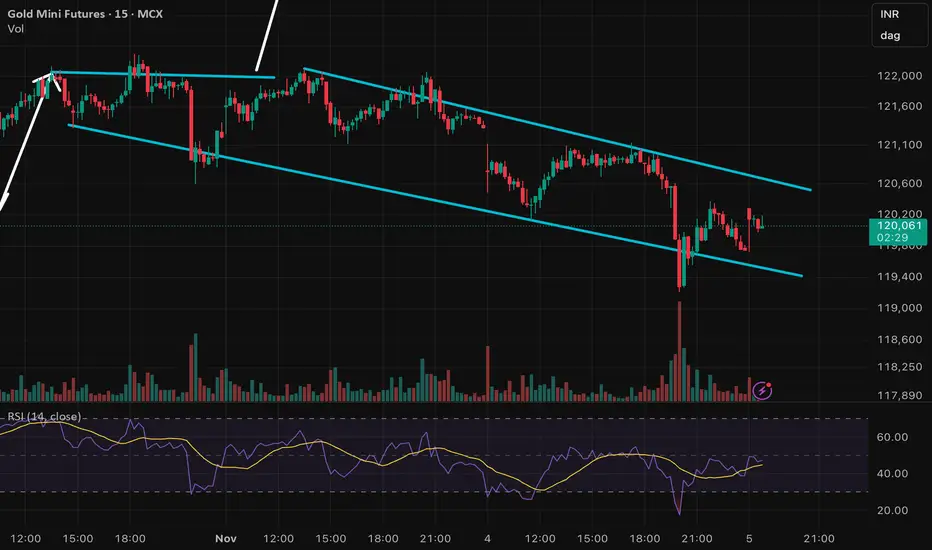
GOLD falling in a parallel channel formation Gold price has been falling since yesterday as expectations of December rate cut fades away. It is forming a parallel falling channel pattern and has recently bounced from the lower zone.
Keep an eye on it as volatility is expected to stay and there will be ample opportunities to capture movements. Follow me for live updates.
GOLDM showing upside momentum as BoE keeps rate at 4%GOLDM is rallying today before Bank of England interest rate decision where they have kept interest rate at 4% meeting market expectations.
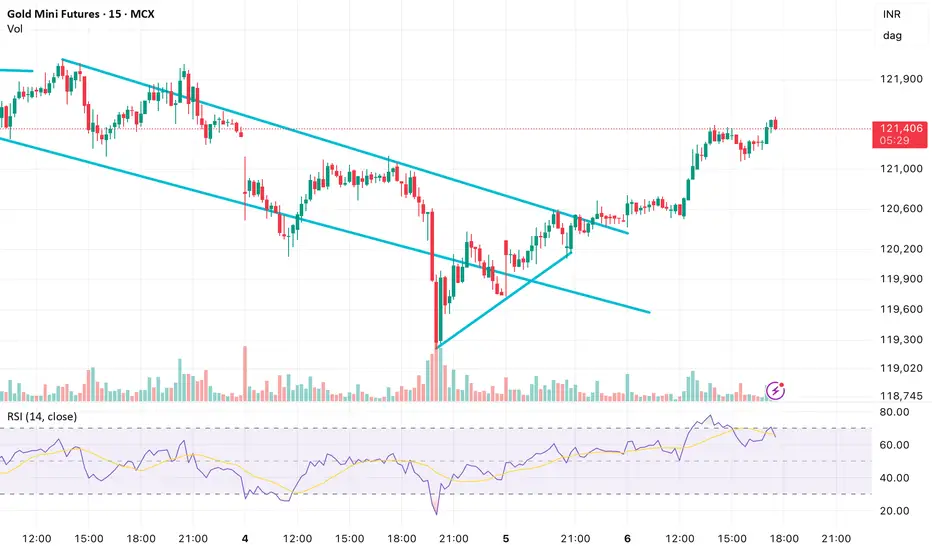
Gold recently gave a breakout from a falling channel pattern formation on 15 min chart
ANFIBO | XAUUSD - Black Friday, but hit $4200 soon [11.11.2025]Well, Anfibo's here again!
XAUUSD Analysis – Daily Trading Plan
Overall Picture:
OANDA:XAUUSD has moved exactly according to my yesterday’s plan, delivering an impressive 750 Pips of profit — a phenomenal start to the new trading week. The bullish structure remains firmly intact, and momentum continues to show strength as price pushes higher toward major resistance zones. For today, my expectation is that XAUUSD will extend its upside move toward the $4,200 region, which also aligns perfectly with the 61.8% Fibonacci extension on the higher timeframe — a strong confluence level where profit-taking is highly likely. At this zone, I will secure additional profits from yesterday’s buy positions and closely monitor price action for potential sell signals.
Trading Plan for Today:
>>> SELL ZONE:
ENTRY: 4185 – 4205
SL: 4210
TP: 4150 – 4130
>>> BUY ZONE:
ENTRY: 4075 - 4090
SL: 4065
TP: 4140 – 4190 - 4200
Risk Management:
Stick to small-to-medium positions within the range; increase size only on confirmed breakouts.
Keep stops tight, as bullish extensions can reverse sharply at major confluence zones.
Maintain Risk:Reward ≥ 1:2 and avoid overtrading during high volatility spikes.
Reassess market bias once price reacts clearly around the $4200 fibo confluence zone.
Conclusion:
Gold continues to reward trend-following strategies as it pushes toward the $4200 target zone. This level will be crucial for today’s session, as it represents both a psychological barrier and a strong fibo confluence. I will lock in further profits on buys once price reaches this region and will only consider sells if price action confirms a reversal pattern.
HAVE A NICE DAY, GUYS!

XAU/USD – Ahead of U.S. Data: Continuation or Reversal?🌐 MARKET CONTEXT
The gold market is currently navigating a juncture of competing forces: on one hand, the continuing expectation of central bank pivoting and safe-haven demand; on the other, risks from a stronger U.S. dollar and higher real yields. For instance, recent commentary highlighted that gold broke above ~US$4,074-oz amid weak U.S. data and growing hopes of a Fed rate cut.
OneRoyal News
+2
ODI: Think change
+2
Additionally, the milestone of gold surpassing US$4,000 per ounce has underlined both its strong momentum and the questions about whether this is a sustainable trend or ripe for a pullback.
World Gold Council
+1
From a sentiment standpoint:
The risk-on component: if data disappoints, gold could rally further.
The risk-off / hawkish policy risk: if inflation or jobs data surprise to the upside, the dollar and rates may rise, weighing on gold.
For the upcoming London → New York sessions, focus is on how gold reacts around major technical zones, and whether price structure shows continuation or reversal.
Thus, the bias today is conditional bullish, leaning long on confirmed demand zones, but ready to flip to bearish if supply zones trigger rejection.
📉 TECHNICAL ANALYSIS (SMC + Liquidity Structure)
The price is in a broader up-trend (following the breakout above key resistance zones) but is now entering high-probability structural decision zones.
We have clear Supply and Demand zones:
Some prior Resistance turned Support zones around ~4,021-4,074 (per recent reports) act as demand/higher-probability buy areas.
OneRoyal News
+1
A supply zone around ~4,080 and above is noted as a target and potential reversal area if momentum falters.
OneRoyal News
+1
Regarding SMC confirmations: look for liquidity sweeps (stop-loss hunts), fake BOS (Break of Structure), or mitigation before entering. A clean confirmation before a trade increases probability.
Example: If price rises into 4,080-4,078 and then sweeps above 4,086 then reverses, that may signal a “trap buy and sell” scenario (structure break then reversal). Conversely, if price dips to 3,990-3,988 or 3,930-3,928 and shows a sweep of liquidity then a strong bullish candle, we may have a CHoCH and continuation long.
🔑 KEY PRICE ZONES
4,080–4,078 ▶️ Sell Zone – High-probability supply nearest to session high, look for rejection.
4,161–4,163 ▶️ Buy Zone – A higher demand zone / breakout target area acting as strong structural bounce.
4,081–4,083 ▶️ Buy Zone – Demand zone near current structure, reactive long setup if confirmed.
3,990–3,988 ▶️ Buy Zone – Deep demand/support zone for larger reversal potential.
Stop-loss levels:
Sell stop-loss: 4,086
Buy stop-loss (4,161 zone): 4,155
Buy stop-loss (4,081 zone): 4,075
Buy stop-loss (3,990 zone): 3,982
⚙️ TRADE SETUPS
✅ BUY SCENARIO 1 – STRUCTURAL SUPPORT HIGH TARGET
Entry: 4,161–4,163
Stop-loss: 4,155
TP1: ~4,180 TP2: ~4,210 TP3: Open
Logic: A breakout into this zone or strong bounce from it would indicate continuation of bullish momentum and structural demand dominance.
✅ BUY SCENARIO 2 – MID-STRUCTURAL DEMAND
Entry: 4,081–4,083
Stop-loss: 4,075
TP1: ~4,100 TP2: ~4,135 TP3: Open
Logic: A reactive long setup if price pulls back to this zone and confirms demand (liquidity sweep + bullish candle). Good London session focus.
✅ BUY SCENARIO 3 – DEEP SUPPORT ACCUMULATION
Entry: 3,990–3,988
Stop-loss: 3,982
TP1: ~4,020 TP2: ~4,060 TP3: 4,100+
Logic: Larger-scope reversal zone, ideal if price falls into this area and shows structure change (CHoCH) from bearish to bullish.
⚠️ SELL SCENARIO – SESSION SUPPLY REJECTION
Entry: 4,080–4,078
Stop-loss: 4,086
TP1: ~4,040 TP2: ~3,990 TP3: ~3,930
Logic: If price rises into this supply zone and shows rejection (e.g., wick up, reversal candle) then expect a short. Especially potent during New York session when liquidity is high.
🧠 NOTES / SESSION PLAN
Prioritize confirmation: don't enter solely on touching zone — wait for structure (M5/M15) and liquidity event.
London session: likely focus on BUY setups (4,081 zone, 3,990 zone).
New York session: monitor for the SELL setup at 4,080–4,078 if price approaches.
Monitor macro data releases (U.S. inflation, job numbers) which could provoke volatility and invalidate setups.
Risk management: each trade should respect stop-loss and maintain risk ≤2% of account; trail stops once TP1 hits.
Avoid chasing after large rapid moves; allow the market to structure into zones rather than predicting broken conditions.
🏁 CONCLUSION
The bias for today: bullish conditional — we favour buys on confirmed demand zones (4,161–4,163; 4,081–4,083; 3,990–3,988) but remain alert for a bearish reversal if price exhausts into the supply zone around 4,080–4,078 with clear rejection. Today’s structure offers a wide range of actionable zones; success will depend on discipline to wait for confirmation and managing risk strictly.

Buy gold around 4105, target 4160-4199Gold Market :
Analysis: Yesterday, we maintained our buying stance on gold, placing buy orders at 4047, 4073, and 4078. Today, we will continue to place buy orders. Gold has broken through the previous daily chart's correction high and started a new major rebound. The strength and magnitude of this rebound are very significant. Do not try to catch it; those who sold yesterday are mostly at a loss. Trying to guess the top makes it very difficult to capture the absolute highest point. The daily chart closed with a strong bullish candle with no upper or lower shadow. Today's buying will continue to push the price higher. Where is the top? Such a strong upward trend has no clear top. We need to follow it, even if it means risking everything to buy. The area around 4046 on the daily chart is already the bottom of the daily consolidation range. Even if there is a pullback later, it's unlikely to break through this level again. Pullbacks are our buying opportunities.
Gold prices rose sharply in the Asian session, presenting buying opportunities on minor dips. Waiting for strong support is unlikely; hourly support is around 4105. The key level to avoid in the Asian session is 4161. A break below this level could lead to further upward movement on the daily chart. I anticipate a period of consolidation around this level. I expect a rise in the Asian session followed by consolidation in the US session.
Support: 4105 and 4075; Resistance: 4161; Key level for market strength/weakness: 4105.
Fundamental Analysis:
Recent comments from Federal Reserve officials signaled continued interest rate cuts, suggesting a continuation of rapid easing policies, which should support further upward movement in gold.
Trading Recommendation:
Buy gold around 4105, target 4160-4199.

ANFIBO | XAUUSD - Effort to Breakout??? [11.10.2025]Hi guys, Anfibo's here!
XAUUSD Analysis – Daily Trading Plan
Overall Picture:
OANDA:XAUUSD is currently trading at the upper boundary of its sideways H1 channel, a key decision point where market sentiment is being tested. This resistance zone has repeatedly acted as a ceiling for price during the current consolidation phase. The question now is whether this level will once again trigger a technical pullback, or if bullish momentum—supported by ongoing geopolitical uncertainty—will be strong enough to deliver a clean breakout and start a new impulsive leg upward. Price action today will be crucial in determining whether gold continues ranging or transitions into a breakout phase.
Trading Plan for Today:
>>> BUY ZONE:
(1) ENTRY: 4040 - 4050
SL: 4030
TP: 4135 – 4150 - 4200
(2) ENTRY: 4070 - 4080 (small vol)
SL: 4065
TP: 4135 – 4150 - 4200
Risk Management:
- Stick to small-to-medium positions within the range; increase size only on confirmed breakouts.
- Keep stops tight, as sideways phases tend to trigger false signals.
- Maintain Risk:Reward ≥ 1:2 and avoid overtrading in choppy conditions.
- Reassess market bias once the H1 channel is decisively broken.
Conclusion:
Gold is sitting right at the “make-or-break” zone of its sideways channel. This area will tell us whether the market plans to reject and pull back, or gather enough momentum for a powerful breakout. As always, we remain flexible: trade the range until it breaks, and prepare to shift bias immediately if a confirmed breakout occurs.
HAVE A WONDERFUL NEW WEEK GUYS!

Gold Ends Its Pullback, New Bullish Wave Targets to 4,268?Hey Realistic Traders!
"XAUUSD Correction Wave is Over, Could This Be the Next Big Move?"
Let’s dive into the technical analysis to see what the chart is really telling us.
Technical Analysis
On the daily chart, XAUUSD has rebounded once again around the EMA200, with multiple bounces confirming the strength of its broader bullish trend. Afterward, Gold consolidated within a symmetrical triangle pattern, a formation that often appears as a corrective phase within an uptrend where selling pressure gradually weakens. A breakout from this pattern typically marks the beginning of a new bullish wave.
The recent breakout was accompanied by strong momentum. A bullish Marubozu candlestick highlighted renewed buying interest, while the MACD golden cross added confirmation to the bullish bias. Together, these signals reinforce the case for a continuation of the prevailing uptrend.
In this scenario, the first upside target is located near 4,163 , aligning with a historical resistance area, where a short-term pullback may occur. If bullish momentum continues, XAUUSD could extend higher toward the second target near 4,267, just below its all-time high.
This bullish outlook remains valid as long as the price stays above 3,916. A move below that level would invalidate the setup and shift the outlook back to neutral.
Beyond technicals, Gold’s bullish outlook is also supported by a broader macro trend, as many central banks continue to reduce their U.S. dollar exposure and increase gold allocations in their reserves, adding further strength to the long-term bullish narrative.
Support the channel by engaging with the content, using the rocket button, and sharing your opinions in the comments below.
Disclaimer: "Please note that this analysis is solely for educational purposes and should not be considered a recommendation to take a long or short position on Gold."

XAU/USD) Bullish trend analysis Read The captionSMC Trading point update
technical analysis of Gold (XAU/USD) on the 4-hour timeframe. Let’s break down the technical analysis presented:
Overall Idea
The analysis suggests that Gold is likely to continue its upward movement after a possible short-term retracement. The chart projects a move toward the target point at 4,160.549.
---
Key Technical Elements
1. Break of Structure / Trendline Break
A descending trendline (black) has been broken to the upside, signaling a potential trend reversal from bearish to bullish.
The breakout candle is strong and supported by volume, confirming bullish momentum.
2. Fair Value Gap (FVG) Zone
A Fair Value Gap (blue box) has been marked where price may retrace to fill imbalance before continuing higher.
This FVG area also aligns with the previous resistance turned support, adding confluence for a bullish continuation.
3. Exponential Moving Averages (EMAs)
EMA 50 (blue): 4,016.295
EMA 200 (black): 3,965.661
Price has crossed above both EMAs, indicating a strong bullish trend shift.
A bullish EMA crossover may be forming, further confirming upward bias.
4. Projection Path
After a short retracement into the FVG zone, the expected price structure shows:
A bounce upward forming higher highs.
The final target zone is projected at 4,160.549, where a potential take-profit level lies.
---
Target and Confirmation
Target Point: 4,160.549
Retracement Zone (Buy Area): Within the blue FVG zone (around 4,060–4,080 range).
Confirmation: Watch for a bullish reaction (e.g., bullish engulfing or rejection wicks) within the FVG zone before entry.
---
Risk Considerations
If price closes below the FVG or drops back under 4,016 (50 EMA), it could invalidate the bullish continuation setup.
Fundamental catalysts like U.S. Dollar strength or economic data releases could cause volatility and affect momentum.
Mr SMC Trading point
---
Summary:
This analysis outlines a bullish continuation setup on Gold, expecting a pullback into the FVG for liquidity collection before resuming upward momentum toward 4,160.549.
Please support boost 🚀 this analysis

XAU/USD) Bullish trend analysis Read The captionSMC Trading point update
Technical analysis of Gold (XAU/USD) on the 4H timeframe, following Smart Money Concepts (SMC) and structural confluence trading. Let’s break down the full reasoning behind this setup
---
Overall Concept
The chart suggests that Gold is preparing for a bullish breakout after a successful retest of the trendline and demand zone, signaling potential institutional accumulation before a push toward the target level at 4,080.231.
---
Technical Breakdown
1. Market Structure
Price recently broke above a descending trendline, signaling a potential change of character (ChoCH) from bearish to bullish structure.
The higher lows and multiple rejections from the blue demand zone confirm buyer interest.
The small arrow and upward projection illustrate an expected retracement and continuation pattern (impulse → correction → new impulse).
2. Key Levels
Current Price: 4,001.275
50 EMA: 4,003.110 → Price is now testing and starting to close above this level, showing renewed bullish strength.
200 EMA: 3,960.048 → Dynamic support confirming mid-term bullish bias.
Demand Zone (blue area): Around 3,985–3,995 — key zone for re-entries and confirmation of buyer defense.
Target Point: 4,080.231 (aligned with a liquidity zone or prior imbalance area).
3. Confluences
EMA Cross: Price pushing above both 50 and 200 EMA — often a signal of trend reversal strength.
Trendline Retest: The green arrow indicates a successful retest of broken resistance turned support.
Bullish Structure: Higher highs and higher lows forming above the EMAs.
Volume: 101K+ — healthy momentum supporting institutional buy continuation.
4. Expected Scenario
1. Short-term retracement into the blue demand zone or along the ascending trendline.
2. Bullish reaction (engulfing candle or rejection wick).
3. Continuation move toward the 4,080 target zone.
---
Trade Idea Summary
Aspect Detail
Bias Bullish
Entry Zone 3,985 – 3,995 (demand + trendline confluence)
Stop Loss Below 3,960 (under EMA200 and previous swing low)
Take Profit 4,080
Risk-to-Reward (RR) ≈ 1:3 or better
Mr SMC Trading point
---
Confirmation to Watch
Bullish candle close above 4,005 (EMA50)
Rejection from the blue demand zone
Break of short-term high around 4,015 confirming continuation
---
Summary
Gold appears ready for a trend continuation following accumulation above major EMAs and a clean retest of structure. The next impulsive move is projected toward 4,080, aligning with prior liquidity and smart money target areas.
please support boost 🚀 this analysis

Gold (XAU/USD) – Combined Daily & 1H AnalysisBias: Bullish continuation
Key Level to Watch: 4,083.33 USD
Gold continues to show strong bullish momentum following last week’s reversal from sub-4,000 zones. On the daily timeframe, price printed a clean bullish candle, confirming buyer dominance. The 1-hour chart reinforces this strength — despite short-term pullbacks, buyers are consistently defending higher lows above 4,041 and 4,083.
Technical Context
• Trend: Short-term uptrend with renewed bullish structure
• Daily Resistance zone: 4,100 – 4,150
• 1H Resistance zones: 4,097.66 → 4,101.80 → 4,110
• Support zones: 4,083 → 4,041
• Structure: Minor retracement within an ongoing breakout sequence; price holding firm above prior resistance now acting as intraday support
Trading Plan
Monitor 4,083 as the intraday decision level — a sustained hold above this zone supports continuation toward 4,101 and 4,150.
A close below 4,041 would signal weakening momentum and open the path for a short-term correction before potential re-entry opportunities emerge.

XAUUSD (Gold) Is heading UPWARDS! - time to buyA few days ago XAUUSD (Gold) was in a short term downtrend but finally broke out of it. The price broke through the downward channel to the upside, the price also held onto strong support (the white trendline which acted as a support level). The price tested the white trendline several times but kept bouncing back each time it hit the support zone. The price then broke through all recent resistance zones and will very likely hit the next resistance zone which is marked as the "Take profit" area. BUY GOLD NOW!

GOLD | Daily Analysis #5 - 10 November 2025Hello and Welcome back to DP,
Technical Analysis:
🟩 Demand Zones (Support Areas)
$4,025 – $4,060
This is the primary demand zone
Formed after a strong bullish impulse that broke previous structure highs.
Multiple bullish candles emerged from this zone with increasing volume — clear institutional buying footprint.
Acts as immediate support if price retraces.
A sustained hold above $4,060 keeps short-term buyers in control.
🟥 Supply Zones (Resistance Areas)
$4,108 – $4,148
Prior distribution area before the sharp drop in late October.
Sellers previously defended this level twice (confirmed by the red arrows).
Expect profit-taking or short setups on the first retest — this is major resistance in the short term.
First rejection likely near $4,120; a 2H close above $4,150 would invalidate the bearish pressure here.
$4,366 – $4,370 (black line above)
Upper-level supply and major swing high from October.
Would become the next upside target if price breaks and holds above $4,150.
SO, After forming a higher low near $3,760, price shifted bullish, breaking successive minor structure highs. Current move is an impulsive leg approaching the first strong supply zone ($4,108–$4,148).
The market is bullish in the short term, but approaching key overhead supply.
Disclaimer:
This content is for informational purposes only and does not constitute financial or investment advice. © DIBAPRISM
Amir D.Kohn

GOLD BUY Gold buying opportunity for a good price increase to the upside, will wait claim and use a buy limit to catch the trade

Long - XAUUSD Hit TP on early MondayAnother week opened, XAUUSD long position hit TP as expected. I took a buy following a strong rejection at support zine. Price closed the week with 4000 after a strong bullish candle/rejected wick, confirming a short term bullish bias and surge with a sharp move earlier this morning.

Gold holds above 4050 — market consolidating before next moveMarket Overview
Gold (XAU/USD) is trading around $4056/oz, holding firm above the $4050 psychological level after strong Asian session gains. Safe-haven demand and dovish Fed expectations continue to support sentiment, though momentum is slowing near resistance.
📊Technical Analysis
• Resistance: $4062 – $4075
• Support: $4042 – $4030
• EMA50 (H1): price stays above EMA, confirming short-term bullish bias
• Pattern: consolidation above $4050; breakout above $4062 may target $4080
• Momentum: RSI near 65, still bullish but weakening slightly
💡Outlook
Bias remains bullish, but minor pullback likely before confirmation. A drop below $4042 would limit upside momentum.
🎯Trade Idea
🔺 BUY XAU/USD
Entry: $4042 – $4045
🎯 TP: 40 / 80 / 200 pips
🛑 SL: $4036

Golden Anchor: The Multi-Domain Resilience of BullionThe price of gold recently surged past $4,045 per ounce, cementing its role as a strategic global asset. This upward trend, pushing the year-to-date gain above 50%, is not merely speculative. It reflects deeply rooted structural forces across multiple global domains, from macroeconomics to high-tech demand. Investors are proactively using gold as a vital hedge against accelerating global uncertainty and fiat currency debasement.
Geopolitics & geostrategy: The De-Dollarization Hedge
Persistent geopolitical tensions drive sustained demand for gold's safe-haven status. Heightened conflict risks and unpredictable US tariff policies create global market volatility. In this fragmented landscape, gold acts as a politically neutral reserve asset, mitigating counterparty risk. Central banks globally are strategically accumulating gold to diversify away from the US dollar, accelerating the de-dollarization trend. This shift enhances national economic sovereignty, fueling gold's ascent.
Macroeconomics: Fiscal Dominance and Rate Cuts
Weakening US economic indicators directly reinforce gold’s appeal. A dip in the University of Michigan’s Consumer Sentiment Index signals broad economic unease. This fragility increases market bets on an earlier and more aggressive Federal Reserve rate-cutting cycle. Lower interest rates reduce the opportunity cost of holding non-yielding gold, boosting its price. Furthermore, the fiscal dominance prevalent in developed economies promotes gold as a critical hedge against the debasement of G7 fiat currencies.
Central Bank & Investment Demand Dynamics
Central bank purchases provide a formidable structural floor for gold prices. Despite the recent price correction, global central banks remain net buyers. They added 220 tonnes in Q3 2025 alone, representing a strategic, long-term commitment to gold. Poland, Kazakhstan, and Azerbaijan are notable accumulators. Retail and institutional investors are also turning to gold ETFs and physical bullion, viewing gold as essential financial insurance during systemic shocks.
Technology, Science, and High-Tech Demand
Technological advancements, particularly the boom in Artificial Intelligence, subtly support gold demand. While gold's main drivers remain macroeconomic, the high-tech sector consumes gold in electronic components and specialized circuits. Industrial demand remains resilient, offsetting a decline in jewelry consumption due to high prices. The massive, energy-intensive growth of AI and data centers indirectly creates a strategic need for high-value, reliable assets like gold to back infrastructure growth and hedge associated capital risks.
Technical Outlook and Consolidation Phase
Gold exhibits high long-term conviction but faces short-term consolidation after its historic rally. The price peaked at over $4,380 per ounce in mid-October before profit-taking began. Analysts expect the price to remain range-bound in the near term, with a maximum pullback risk around the strong $3,500/oz support level. Key technical resistance levels above the current peak are seen at $4,420/oz and $4,500/oz. Investors should utilize short-term dips as strategic long-term accumulation opportunities.

The bulls are back, and going long remains the main theme.#XAUUSD OANDA:XAUUSD TVC:GOLD
Although the beginning of the week didn't offer a pullback entry opportunity, gold rallied immediately after the open, breaking through 4030 as expected and continuing its upward trend, officially signaling the return of the bulls to the market.
From the hourly chart, gold broke through the resistance of the upward channel at 4055 and continued to fluctuate upwards, indicating that the bullish momentum remains strong in the short term. However, attention should be paid to the resistance at 4080-4100 from the weekly MA5 moving average and the daily middle line, and be wary of a possible pullback after a surge. Therefore, in the short term, avoid blindly chasing the rally, patiently waiting for a pullback to buy remains our main trading strategy. The first support level to watch is the 4055-4045 level, a previous resistance turning point, followed by the important support at 4030-4020.
Therefore, if gold prices fall back after encountering resistance during the European session, we can consider going long on gold in batches based on the strength of the pullback.

Gold 1H – Is This Pump Temporary or the Start of a Bigger Move?🟡 XAUUSD – Intraday Smart Money Plan | by Ryan_TitanTrader
📈 Market Context
Gold extended its bullish leg overnight, driven by a sharp upside displacement following a clean ChoCH on the H1 structure.
However, the impulsive rally is now pushing deep into premium territory, where higher-timeframe supply begins to re-enter the picture.
Market sentiment remains cautious ahead of U.S. consumer confidence data and upcoming comments from several Fed officials.
• A hawkish tone could strengthen the dollar intraday, making the current rally vulnerable to a pullback.
• A neutral or dovish signal may allow gold to sweep higher liquidity before forming its next decisive move.
Price is currently tapping into resting buy-side liquidity above 4060–4070, with the next pool sitting just beneath the 4090 supply zone, making this an ideal location for short-term reversals.
🔎 Technical Analysis (1H / SMC Style)
• Structure: H1 bias remains bullish after the major ChoCH, but price is now entering an exhaustion phase as it reaches unmitigated supply.
• Premium Zone: 4090–4088 aligns with the freshest H1 supply, formed right before the displacement — a prime location for a short-term reversal.
• Liquidity Sweep: The candles show aggressive wicks into higher liquidity, suggesting the market may engineer one final sweep into 4090 before rotating downward.
• Discount Zone: 3974–3976 lines up with unmitigated demand and sits directly below the previous accumulation range — an ideal discount level for continuation buys if price retraces.
🔴 Sell Setup (High-Probability Reversal)
• Entry: 4090 – 4088
• Stop-Loss: 4100
• Take-Profit Targets: → 4040 (first liquidity pocket) → 4005 (return to structure) → 3976 (discount zone & demand confluence)
🟢 Buy Setup (Demand Reaction Setup)
• Entry: 3974 – 3976
• Stop-Loss: 3967
• Take-Profit Targets: → 4005 → 4040 → 4080
(Only valid if price performs a liquidity sweep into 3976 and prints a clean M15 ChoCH.)
⚠️ Risk Management Notes
• Avoid entering early inside the premium zone — wait for bearish confirmation (M5–M15 BOS).
• The demand at 3974–3976 is strong but only valid once liquidity beneath the range has been fully taken.
• Do not chase buys near current levels; price is overextended and has no discount alignment.
• Partial profits should be secured at each liquidity point, with stops trailed using structural highs/lows.
• Intraday bias remains bullish-to-neutral, but current price is at an extreme, making shorts more favorable short-term.
✅ Summary
Gold is reaching into a major premium zone near 4090, where a short-term reversal becomes highly probable.
The 4090–4088 supply provides a clean, high-quality SMC continuation-short setup, while the 3974–3976 demand zone remains the strongest location for reactive long positions.
Stay patient — today’s movement will likely determine whether the recent pump is temporary or the beginning of a broader structural shift.
FOLLOW RYAN_TITANTRADER for daily SMC setups ⚡

Gold 1 Hr Up Up Up...Trend line possible as the channel hopefully continues, just cools off a bit after that lovely ride.

XAUUSD – Weekly Trade Plan(Nov 10 → Nov 14, 2025)
Bias: Neutral–Bullish, focusing on reaction zones between key supply and demand levels.
🌐 MARKET CONTEXT
Overview: After a strong rally earlier in Q4, Gold is now consolidating around the $4,000 zone, reflecting the tug-of-war between Fed rate-cut expectations and upcoming U.S. inflation data (CPI & PPI).
Sentiment: Current sentiment leans slightly risk-off, as U.S. yields remain elevated, but safe-haven demand for Gold persists.
Expectations: The market is likely to remain range-bound / corrective until a clear macro catalyst appears.
Main Bias: Prioritize selling from supply zones and buying from demand zones, but always wait for structural confirmation (CHoCH / BOS) before entering.
📉 TECHNICAL ANALYSIS (SMC + Liquidity Structure)
Structure: The market is moving in a sideways H4 range between 3,930 and 4,130.
Liquidity focus:
Above 4,130: Cluster of buy-side liquidity — potential for stop-hunt sweeps.
Below 3,930: Sell-side liquidity, untested low area.
Pattern outlook:
The 4,046–4,052 area has been tested twice, forming a potential mini-distribution zone.
The 3,928–3,930 demand zone remains untested — a possible liquidity sweep before rebound.
SMC Logic:
A fake BOS / sweep above 4,130 could trigger a strong short setup.
A sweep below 3,930 + CHoCH bullish could confirm a long setup.
🔑 KEY PRICE ZONES
Price Zone Type Description
4,130–4,128 🔻 SELL Zone #1 Major D1 supply zone & liquidity cluster above the range
4,046–4,044 🔻 SELL Zone #2 OB + POC + liquidity trap near previous highs
3,930–3,928 🟩 BUY Zone #1 H4 demand zone + SSL sweep potential
3,922 ⚠️ Stop Threshold Below this, short-term bullish bias invalidated
4,052 / 4,136 🧱 Stoploss Levels Corresponding stops for each sell setup
⚙️ TRADE SETUPS
✅ SELL SCENARIO 1 – HIGH SUPPLY (SWEEP ABOVE RANGE)
Entry: 4,130 – 4,128
Stoploss: 4,136
TP1: 4,046
TP2: 3,995
TP3: 3,930
Logic: Liquidity sweep above the range high, targeting distribution reaction from major supply.
✅ SELL SCENARIO 2 – RANGE SUPPLY REJECTION
Entry: 4,046 – 4,044
Stoploss: 4,052
TP1: 4,000
TP2: 3,930
TP3: 3,928
Logic: OB + VAL + liquidity confluence at top of range; wait for M5 CHoCH confirmation before entering.
✅ BUY SCENARIO – MAIN STRUCTURAL SUPPORT SWEEP
Entry: 3,930 – 3,928
Stoploss: 3,922
TP1: 3,995
TP2: 4,044
TP3: 4,128 (trail)
Logic: Sweep of SSL below previous low → bullish CHoCH confirmation → ideal Smart Money demand entry.
🧠 NOTES / SESSION PLAN
Focus on London session for potential buy setups near 3,930–3,928.
Watch New York session for sell setups at 4,046–4,128, especially if price sweeps liquidity first.
Avoid entering during major CPI / PPI news releases.
Use M5–M15 confirmations (CHoCH, FVG fill) before execution.
Avoid overtrading — wait for clear structural confirmation to reduce stop-hunt risk.
🏁 CONCLUSION
Gold continues to range between 3,930 ↔ 4,130, showing no clear breakout yet.
Primary setups:
Sell from 4,046–4,128, with stops at 4,052 / 4,136.
Buy from 3,930–3,928, with stop at 3,922.
Strategy: Trade both ends of the range with structure confirmation; avoid trading inside equilibrium.
For this week, focus on buy-the-dip below 3,930 and sell-the-rally between 4,046–4,130.

Market volatility, trade steadily.#XAUUSD TVC:GOLD OANDA:XAUUSD
As mentioned last night, gold prices failed to break below the important short-term support level of 3965, so we maintain our bullish view. Although the intraday volatility was not high, the consolidation process can be seen as gold accumulating positions in the short term. Market breakout requires patience. Currently, the daily MA5 and MA10 moving averages are converging around 3980, which is also where the 4-hour middle band is located. The key resistance level in the short term is in the 4015-4030 area. A break above this level could lead to further gains towards 4050-4080.
It's important to be cautious given the recent volatile market with poor continuity. Therefore, even if a breakout occurs today, it is not advisable to rush to buy. Instead, wait for a pullback before entering the market to avoid being trapped by blindly chasing highs. The 3980-3965range remains the ideal entry point for bulls. Maintaining patience is always a key element in trading.
