Gold XAUUSD: Double Top, Volume Profile, and VWAP Trade Plan📊 Gold (XAUUSD) has been trending higher overall, but recently formed a double top followed by a significant retracement ⚡. Despite that, price action is now beginning to show signs of a shift in structure back to the upside 📈.
🔎 In the video, we review both the VWAP and the anchored volume profile as part of the trade plan. For a potential long setup, I’ll be watching for price to break above the volume profile’s Point of Control (POC) 🎯.
❌ However, if price were to break below VWAP, that would invalidate the idea and I’d step aside until the next opportunity arises.
⚠️ Disclaimer: This analysis is for educational purposes only and not financial advice. Always manage risk appropriately.
Goldlongsetup

Gold Bulls Warming Up for the Next Rally After PullbackHi guys
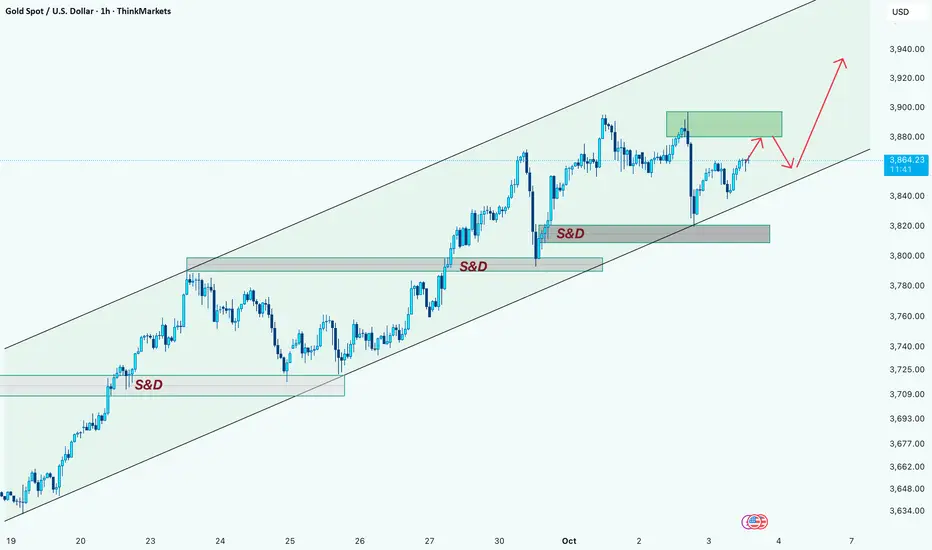
Gold is still respecting the ascending channel structure, creating higher highs and higher lows. The price has already reacted strongly from the demand (S&D) zone around 3820–3840, pushing back toward the upper side of the channel.
🔎 At this stage, the key area to watch is the green supply zone near 3880–3900. I expect the price to test this zone, where a short-term correction is likely. After a possible pullback toward the mid/lower boundary of the channel, the bullish momentum should continue, with the next upside targets aligning with the 3920–3940 area.
Trend bias: Bullish
Key levels:
Resistance: 3880 – 3900 (supply zone)
Next target: 3920 – 3940
🚀 If the channel structure remains intact, dips should be seen as buying opportunities, with the overall trend pointing higher.
Disclaimer: As part of ThinkMarkets’ Influencer Program, I am sponsored to share and publish their charts in my analysis.
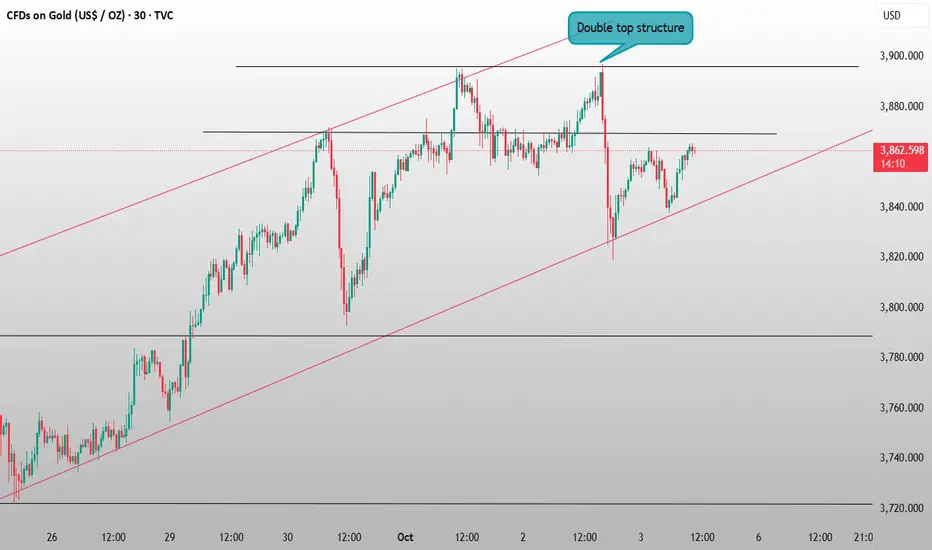
Gold adjustment is not over yet, continue to short at highsGold continued to fluctuate in today's Asian session, failing to initiate a strong rebound and instead fluctuating weakly. This suggests that gold's short-term correction has not concluded and may continue. Today's non-farm payroll report may be delayed, so without supporting data, short-term volatility is likely to continue.
Gold's 1-hour moving average has begun to turn upward, forming a double top pattern. Short-term bulls have yet to re-establish themselves at the gold neckline, indicating continued weakness. Gold rebounded several times but still failed to break through the pressure of 3865. Gold near 3865 in the European session is an opportunity to short on rallies.
Resistance levels: 3865, 3878
Support levels: 3843, 3828
For specific trading decisions, please follow my live updates. I will update my trading ideas and strategies daily. If you lack a gold trading plan or strategy and are struggling to achieve consistent and stable profits, you can refer to and follow my updates for guidance and help avoid mistakes.
GOLD H2 BULLISH SETUP , ATH AGAIN Gold Buy Zone
GOLD BUY QM And FVG
Lets Goo
Target New ATH
Good Luck Guys

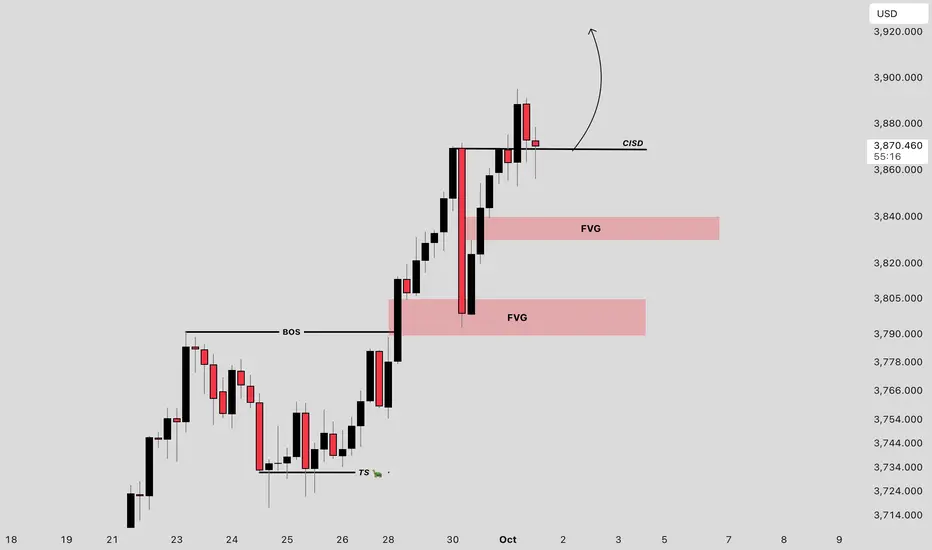
XAUUSD: Seeking new highsOANDA:XAUUSD has rebounded sharply back to the prior highs after a correction from 3871 to 3795. With no clear loss of upside momentum, this looks like a classic shakeout before another push higher. For today’s session, the plan is to keep looking for longs , with a primary objective at 3915.
You can read my previous analysis here:
Price is currently meeting resistance at with notable selling pressure, a dip into support may precede the next leg up.
The 3915 area is a logical upside magnet, where CME participants reportedly hold sizeable long-call exposure—a level price may aim to tag.
Key resistance: .
Key support: , .
Trading Plan
Buy setup: Look for Quantum Vol-Delta confirmation of buying pressure on lower timeframes (5m) as price pulls back into .
Contingency: Watch 3836 (POC session/daily liquidity) . Price may sweep this level and rebound.
Please like and comment below to support our traders. Your reactions motivate us to produce more analysis in the future 🙏✨
Victor Dan @ ZuperView

XAUUSD: Caution advised ahead of NFP releaseOANDA:XAUUSD current bullish momentum is weakening, and traders are extremely cautious ahead of the upcoming Non-Farm Employment Change, which is expected to be USD-positive , accompanied by gradually emerging profit-taking pressure from investors. Therefore, I expect gold to have a significant correction soon after completing the upward move above the area.
You can read my previous analysis here:
There has been the appearance of long put contracts from CME traders being deployed into the market , which is a move to guard against a potential decline in gold in the future.
However, this is only the market’s preparation, and at present there is no sign of a reversal .
Continue to look for buy setups toward Targets 1 and 2. Pay attention to the Margin zone, where CME traders are concentrating a large number of contracts, which may cause price to reverse.
Key resistance:
Key strong support: ,
Margin zone:
Wait for confirmation of a Buy (Pull) signal from MagnetOsc Turbo on the lower timeframes after price breaks above the resistance zone and pullback. Place the stop below the most recent M5 swing low when the entry signal appears.
Continue to look for buy setups toward Target 1 & Target 2, while closely watching for reversal signal.
Please like and comment below to support our traders. Your reactions motivate us to produce more analysis in the future 🙏✨
Victor Dan @ ZuperView

XAU/USD Intraday Consolidation and Bullish Breakout Setup ?Key Observations:
Current Price: $3,886.485
Recent Trend: Strong bullish momentum leading into a consolidation zone.
Consolidation Range:
Support Zone: Around $3,883.056–$3,882.998
Resistance Zone: Around $3,893.792–$3,898.092
Trade Setup:
The green box indicates a potential accumulation/consolidation phase after the bullish move.
The black zig-zag line suggests a range-bound movement within the consolidation box.
An upward arrow indicates a bullish breakout is anticipated from this range.
Stop-loss is placed just below $3,883 (around $3,877.383).
Target zones are near recent highs ($3,893.792 and $3,898.092).
Interpretation:
The chart suggests a bullish continuation pattern following the consolidation.
If price respects the current support zone and breaks out above resistance, the bullish target is around $3,898+.
A break below the support and stop-loss zone may invalidate the bullish setup.

ANFIBO | XAUUSD - DON'T SELL IT TODAY AT ANY COST [01.10.2025]Hello, Anfibo's here!
OANDA:XAUUSD Analysis – Daily Trading Plan
Overall Picture:
OANDA:XAUUSD continues its impressive rally, printing new ATHs one after another. The buy zone recommendation around 3785 – 3795 from yesterday has already delivered nearly 🎯 1000 PIPS 🎯 in profit – an outstanding result that once again showcases the strength of this trend. Truly, the profits from gold are extraordinary – enough for me to say: “I can take my family on another vacation thanks to OANDA:XAUUSD !”
Looking ahead, unless there are major unexpected shifts in fundamentals, gold is poised to keep conquering new highs. With global geopolitical tensions still simmering, safe-haven demand remains robust, and this continues to fuel the bullish momentum. At this stage, we prioritize the buy side over sell side, until gold decisively breaks its trend structure.
Technical Outlook
Short-term trend: Strong bullish continuation on both H4 and Daily timeframes.
Momentum: Healthy and sustainable, with steady higher highs and higher lows.
SUPPORT KEY / BUY ZONES: 3870 - 3834 - 3816 - 3800
RESISTANCE KEY / SELL ZONES: 3904 - 3918 - 4000
Trading Plan Today
>>> BUY ZONE:
ENTRY: 3860 - 3871
SL: 3750
TP: 3915 - ATH
>>> BUY ZONE:
ENTRY: 3815 - 3820
SL: 3710
TP: 3870 - 3915 - ATH
Risk Management
- Favor long trades in line with the prevailing trend; sell setups only for intraday scalps at key resistances.
- Keep a Risk:Reward ratio ≥ 1:2.
- Control position sizing and avoid overtrading during consolidation phases.
- Stay alert to global news headlines, as unexpected geopolitical updates may trigger high volatility.
Conclusion
Gold remains in a strong bullish cycle, consistently breaking into new ATH territory. Our plan continues to focus on buying dips and breakouts, riding the prevailing uptrend.
Key strategy: Buy dips around 3800 - 3816 – 3870 .
Near-term targets: 3900 – 3920 – 3950, while higher levels remain possible if momentum persists.
Gold is rewarding those who stay aligned with the trend – and for now, the bulls are still firmly in control.
HAVE A NICE DAY FRIENDS!!!

Gold Holds Near Record Highs📊 Technical Structure
TVC:GOLD (XAU/USD) continues to consolidate near its all-time high, with price currently trading around $3,863 after retreating slightly from the peak. The chart shows a clear bullish channel, with immediate Support Zone at $3,840–$3,847 and a Resistance Zone at $3,900–$3,905. Any corrective dips into the support area are likely to attract fresh buying, keeping the upside bias intact.
🎯 Trade Setup
Entry: $3,847 (near support retest)
Stop Loss: $3,836 (below channel and support zone)
Take Profit: $3,905
R:R Ratio: ~1 : 5.13
🏦 Macro Background
Gold’s bullish momentum is underpinned by three key themes:
US Government Shutdown Risk – A Republican spending bill failed in the Senate, increasing the likelihood of a partial shutdown, which supports safe-haven demand.
Dovish Fed Expectations – Markets are pricing in a 95% chance of a rate cut in October and a 75% chance of another in December, keeping USD under pressure.
Geopolitical Risks – Rising tensions over US missile supplies to Ukraine and Middle East instability continue to drive safe-haven flows into bullion.
Together, these fundamentals reinforce gold’s upside bias, making dips attractive for buyers.
🔑 Key Technical Levels
Resistance Zone: $3,900 – $3,905
Support Zone: $3,840 – $3,847
📌 Trade Summary
Gold remains in a bullish consolidation phase near record highs, with the path of least resistance to the upside. A retest of the $3,840–$3,847 support zone may provide a solid long opportunity targeting $3,900+. Fundamentals continue to support safe-haven demand and weaken USD, keeping gold well-bid.
⚠️ Disclaimer
This analysis is for reference only and does not constitute trading advice. Trading involves significant risk, and proper risk management is essential.

Gold enters the overbought zone, you can short it on ralliesWhy is gold so strong? Ultimately, it's driven by multiple factors: the Federal Reserve entering a cycle of rate cuts, financial and trade factors, and war. However, this doesn't mean gold won't need a short-term correction! Large cycles provide directional guidance, while smaller cycles determine the rhythm.
Yesterday, the gold market completed its final formation for September. After a strong, volatile rally at the beginning of the month, it broke through multiple round numbers, reaching a record high of 3872 in late trading before consolidating. The monthly line finally closed at 3858, forming a large, saturated bullish candlestick with a slight shadow. This monthly gain of over $400 is primarily due to the Federal Reserve's initiation of a new round of rate cuts against the backdrop of poor US data, which heightened market risk aversion, and the intensified conflict in the Middle East and between Russia and Ukraine. This strong upward trend has led to a strong upward trend. While this large bullish candlestick has the technical potential to continue its upward trend, a rapid short-term rise can also lead to a technical divergence. If the market continues to rise without adjustment and encounters resistance, it can easily lead to profit-taking.
As mentioned before, the increase this time has exceeded 500 US dollars, which has entered our risk zone. Technically, it has deviated from the pattern and entered the overbought zone. Most people in the market are bullish now, but I think the benefits of chasing the rise now are greater than the risks, and there are still opportunities to make profits by shorting gold. So today we are still considering shorting gold on rallies.
Resistance: 3872, 3893
Support: 3843, 3812
If you don't have a detailed trading plan for gold, follow my updates. I'll update my strategies and ideas daily for your reference, helping you avoid detours on your trading journey.

Gold's 8hr 100ema retests...Looking at gold's behavior from Mar 2025, gold tested 8hr 100EMA before resuming its push higher.
The 8H 100EMA retests provided “buy-the-dip” areas while the Monthly trend stayed intact.
Traders who bought those retests often caught continuation legs toward new highs in Mar–Apr 2025.

GOLD H1 Chart Update for 30 Sep 25Hello guy,
GOLD H1 Zonal chart just shared with you, as you can see that there multiple psychological zones appear there
Try to go with Psychological zones in Long direction, Trend remains bullish in GOLD
we might see 4000 Giant Psychological zone in the near term
Today is monthly closing, Stay Active
Disclaimer: Forex is Risky

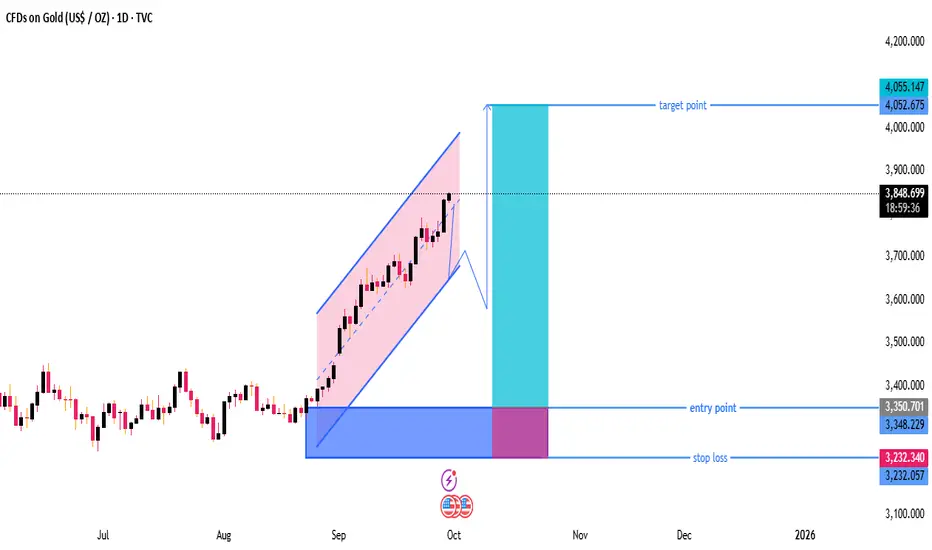
Gold Daily Chart – Buy-the-Dip Setup Towards 4,050 Targethe chart shows XAU/USD (Gold) on a daily timeframe.
Price is currently trading around 3,848, within a rising parallel channel.
A possible pullback from the channel top is indicated before a move higher toward the target.
---
Key Levels & Zones
Entry Point:
Around 3,350 zone marked as the ideal buy area.
This is near the lower support region of previous consolidation.
Stop Loss:
Placed around 3,232, which is below key support.
Good for risk management — avoids staying in trade if price breaks structure.
Target Point:
Around 4,052 – 4,055, aligning with the measured move from the breakout of the channel.
This gives a strong risk-to-reward ratio (roughly 2.5:1).
---
Technical Structure
Trend: Strong uptrend – price respecting ascending channel.
Momentum: Higher highs and higher lows confirm bullish market structure.
Possible Scenario:
1. Short-term pullback expected to lower boundary or breakout retest zone.
2. Continuation move upward toward target (around 4,050).
---
Trading Plan Based on Chart
Wait for Pullback: Don’t buy at current level; price might retrace before next leg.
Enter near 3,350: Ideal long position entry point.
Stop Loss: 3,232 (safe under last swing low).
Target: 4,052–4,055 (previous high / projected channel top).
---
Summary
✅ Bias: Bullish (Buy-the-dip strategy)
📈 Entry: ~3,350
⛔ Stop Loss: ~3,232
🎯 Target: ~4,050
📊 Risk/Reward: Favorable — approx. 1:3
This setup is swing-trade friendly and follows trend continuation logic.
XAU/USD Bullish trend analysis Read The captionSMC Trading point update
Technical analysis of XAU/USD Bullish Channel Setup (4H Timeframe)
---
Chart Summary:
Pair: Gold Spot (XAU/USD)
Timeframe: 4H
Exchange: OANDA
Current Price: $3,759.85
EMA 50: $3,718.68 (short-term support)
EMA 200: $3,576.42 (major support)
---
Key Elements in Chart:
1. Ascending Channel Formation
Price is moving inside a clear rising channel (higher highs & higher lows).
Upper and lower boundaries are acting as dynamic resistance & support.
2. Support Levels (Yellow Zones)
$3,720–3,740 zone: strong support with EMA 50 confluence.
$3,600–3,620 zone: deeper support, aligned with EMA 200.
3. Breakout & Retest
Price broke a short-term descending trendline, signaling bullish continuation.
Retest of support level confirms buyers are active.
4. Bullish Projection
Based on measured move (previous impulse), projection suggests a rally towards $3,877.07 (target point).
Mr SMC Trading point
---
Conclusion:
The chart signals a bullish continuation inside the ascending channel.
Bullish Scenario: Holding above the $3,720–3,740 support zone, price is expected to rally toward the $3,877 target.
Invalidation: A 4H close below $3,718 (EMA 50) could open a deeper correction toward the $3,600 support (EMA 200).
---
Pelas support boost 🚀 this analysis

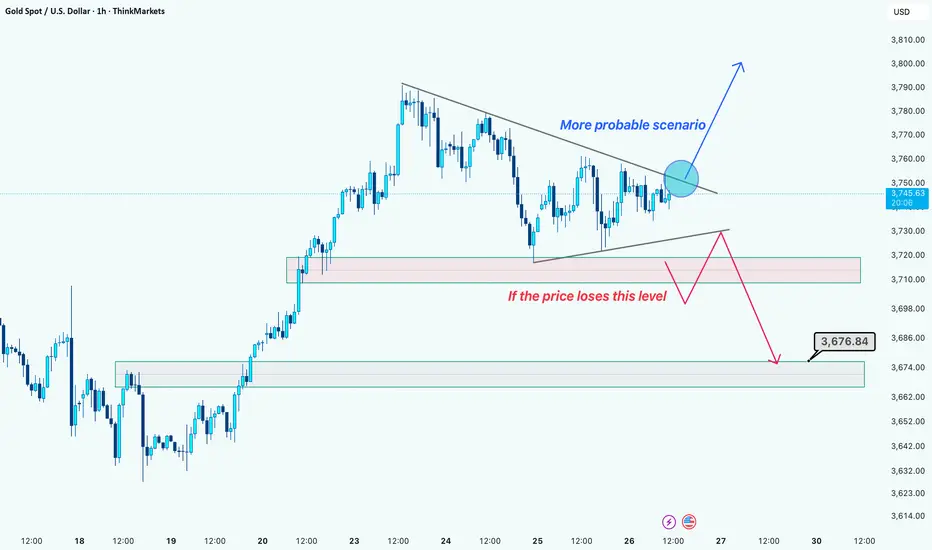
Gold at Key Decision Zone: Breakout or Breakdown?Hello guys!
Let's analyze Gold!
🔸 Current Market Structure
Price is consolidating inside a symmetrical triangle after a strong bullish run.
Momentum remains positive, but sellers are defending the upper trendline.
Key short-term support is around 3,720 – 3,710 zone.
🔺 Bullish Scenario (More Probable)
If price breaks above the triangle resistance, we could see continuation toward 3,770 – 3,790 levels.
Structure favors buyers as long as price holds above 3,720.
🔻 Bearish Scenario (Alternative)
If the price loses the 3,710 support zone, sellers may take control.
Downside targets:
First support: 3,690 – 3,680 zone
Key target: 3,676 area
🔹 Conclusion
More probable scenario: A bullish breakout continuation.
Risk to watch: If the support fails, the price could quickly revisit 3,676.
Best approach: Wait for a confirmed breakout before entering.
Disclaimer: As part of ThinkMarkets’ Influencer Program, I am sponsored to share and publish their charts in my analysis.
5 Mistakes Even Veteran Traders Make!Whether you're new or experienced, you can still fall into these 5 DEADLY mistakes. I'm here to point them out!
Mistake #1: Not understanding what you’re trading.
You’re trading forex, right? But do you know what pips or lots are? How currency pairs move? Or how news impacts them? Too many people dive in just because they see others profiting, without knowing what they’re betting on. That’s the difference between investing and gambling.
Don’t jump into the ocean without knowing what’s underwater.
Mistake #2: Not managing your money.
Most traders obsess over making money but forget how to protect it. It’s human nature—everyone wants fast cash! But if you trade big without control, one bad move can wipe out a month or even a year’s gains. Remember, keeping your capital safe is priority number one; profits come as a result.
As long as you’ve got the forest, you won’t run out of firewood.
Mistake #3: No clear trading plan.
Are you entering trades based on feelings? Exiting because of a “hunch”? That’s not trading—it’s playing the lottery! A trading plan is your compass, your map to stay on track. It needs clear entry points, stop-loss levels, and profit targets. Most importantly, you MUST stick to it!
Sticking to strategy doesn't make us invincible, but it can help us retreat safely.
Mistake #4: FOMO – Fear of Missing Out!
You see prices soaring and chase them, or you copy someone’s trade because they’re showing off profits. Then, when you lose, you blame the market or some “expert,” forgetting it was YOUR choice to trade. Drop this habit! Stop following the crowd and own your trading decisions.
You can’t live by envying someone else’s wallet.
Mistake #5: Trading addiction and chasing short-term wins.
Win one trade, and you want more. Lose one, and you want to “get even” with the market. This traps you in a cycle of overtrading and rash decisions. Profits don’t come from trading a lot—they come from trading RIGHT.
Don’t let emotions take over. Remember, When emotions rise, logic falls.
These 5 mistakes can burn all your money, no matter how much you have. Be honest with yourself and learn from them. I believe if you avoid these traps and stay disciplined, the door to success will open wide.
I’m Anfibo, just sharing what I know about finance.

Gold Price Analysis – XAU/USD Hits New All-Time High at 3812🌍 Market Developments
Gold prices continue to surge, reaching a new record high at $3,810/oz in today’s session. The rally is driven by expectations that the Federal Reserve will maintain a dovish policy stance, a weakening US dollar, and falling US Treasury yields. Safe-haven demand is also supported by ongoing geopolitical tensions and fears of a global economic slowdown.
📈 Technical Analysis
• Key Resistance: 3815 – 3825
• Immediate Support: 3785 – 3770, with deeper support at 3750
• EMA 50 & 100: both trending upward, confirming strong bullish momentum
• H1 and H4 candles show powerful upward momentum, though RSI is approaching overbought territory → possible pullbacks or short-term volatility
💡 Outlook
The primary trend remains bullish, but the sharp rally after setting a new record may trigger profit-taking around the 3815 – 3830 zone. As long as gold holds above 3770, the bullish bias remains intact.
🎯 Trading Strategy Suggestion
🔺 BUY XAU/USD : 3780 – 3777
🎯 TP: 40/80/200 pips
🛑 SL: 3773
🔻 SELL XAU/USD : 3817 – 3822
🎯 TP: 40/80/200 pips
🛑 SL: 3827

Gold Trade Setup - 27/Sep/2025Hi Traders,
I am biased for further upside in Gold.
The first trade that I will be looking for is from the highlighted zone and the price is already testing it.
If price corrects here , then I will expect it to drop further to the next marked POI.
Please follow me and like if you agree or this idea helps you out in your trading plan.
Disclaimer : This is just an idea. Please do your own analysis before opening a position. Always use SL & proper risk management.
Market can evolve anytime, hence, always do your analysis and learn trade management before following any idea.

Gold PCE data follows the trend
News:
Powell's speech was rather conservative, exacerbating the market's cautious sentiment, and the easing of geopolitical situation suppressed the demand for safe-haven assets, which led to the resistance of gold's rise and the adjustment of high-level fluctuations. However, the expectation of further interest rate cuts by the Federal Reserve provided important bottom support for gold prices, which limited the short-term decline space and created opportunities for bargain hunting. In terms of operations, we suggest that everyone pay attention to the support at $3,740, followed by $3,730, and the upper pressure at $3,780, followed by $3,800.
Specifically:
During Thursday's European session, gold rebounded to $3,760 before encountering resistance and falling in a volatile manner. After the US market opened, gold continued its decline, falling to a low of $3,720. After stabilizing, it rebounded and rebounded, reaching $3,758 before encountering resistance.
At the opening of Friday's session, gold fell back to $3,735 before stabilizing. It rebounded to $3,750 before encountering resistance and is currently trading at $3,750. Overall, despite the resistance to gold's rebound, its short-term decline is limited, and gold prices continue to fluctuate and consolidate at a high level.
On the daily chart, gold has stabilized above $3,700, maintaining a high and volatile range. For downward support, consider the lower limit of the 4-hour Bollinger Band at $3,720, which is also near the low point of gold's decline on Wednesday and Thursday. Secondly, consider the $3,700 level. If gold prices hold steady here, there's still a chance for further gains. For upward pressure, consider Thursday's rebound high of $3,760, followed by Wednesday's rebound high of $3,780.
The 5-day moving average maintains an upward golden cross, but the MACD indicator has slightly crossed downward, and the KDJ and RSI indicators have formed a small bearish cross. Short-term technical indicators suggest that gold needs a correction after its continuous rise.
Strategy:
Long Position3740-3750,SL:3725,Target:3780-3800

Gold Trade SetupI will risk!!!
It seems we are near at the end of correction wave...
The first target R/R is 2 and the second is 4...

Gold - Sell near 3753, target 3740-3722Gold Market Analysis:
Yesterday, gold saw both buying and selling, and the market began a period of volatile correction, fluctuating up and down. This is a sign that markets can never rise continuously. When prices tire of rising, they need a break and a pause to recover. This is a normal technical correction after a significant surge. Today's strategy is for short-term volatility, with the broader trend bullish. The range of this correction is a bit unclear, so we can target the upper and lower highs of the 1-hour chart. The daily and weekly charts are closing today. Barring any major surprises, the weekly chart will close with a positive candlestick pattern. Next week, gold will continue to rise, and buying will continue to push prices higher. 3791 isn't the high point of this wave; a break above 3800 is just around the corner. The hourly chart shows gold forming a triangle consolidation pattern. Today, we'll focus on a breakout of this correction. The hourly correction range is 3722-3762. Until this range is broken, we'll maintain a short-term volatile trend. If it does, we can follow the trend. Once the volatility ends, there will undoubtedly be a significant move, whether it's a decline or a breakout. If the Asian session rebounds first, we'll consider selling near 3753.
Support at 3732 and 3722, strong support at 3717, resistance at 3753 and 3758, strong resistance at 3762, and the dividing line between strength and weakness at 3753.
Fundamental Analysis:
This week's fundamentals have limited impact on the market. The US dollar has also begun to fluctuate. The market awaits new data to drive it. The Federal Reserve's interest rate cuts in October remain a key focus.
Trading Recommendations:
Gold - Sell near 3753, target 3740-3722

Analysis of gold price intraday trend!Market News:
Spot gold fluctuated narrowly in early Asian trading on Friday (September 26), currently trading around $3,750/oz. Following the unexpected decline in US initial jobless claims last week, investors awaited key inflation data that could influence the Federal Reserve's next interest rate move. Following the release of the initial claims data, gold prices plummeted to $3,722/oz. The market logic is clear: the better the economic performance, the more confident the Fed will be in slowing or even pausing its rate cuts, and the higher the opportunity cost of holding non-interest-bearing gold. Currently, all market participants are focused on the upcoming release of the US Core PCE Price Index for August. This is the Fed's preferred inflation indicator, and its performance will directly provide the most critical basis for the Fed's next move. Investors will also need to monitor speeches by other Fed officials and news related to geopolitical developments.
Technical Analysis:
The US dollar index rose sharply, reaching a nearly two-week high, closing up 0.58%. Spot gold prices fluctuated, repeatedly testing the $3,760 mark during the session before facing pressure. Gold is currently fluctuating within a broad range, with intense buying and selling activity. Key support is forming below 3718/22, while resistance is forming above 3758/62. Continue to monitor this range for the day. Technically, the daily chart is trading above and below the 5-day moving average, with the RSI indicator trading above 70. The short-term hourly and four-hour moving averages are converging, and the Bollinger Bands are gradually closing. Prices are converging within the mid-range, with the RSI consolidating towards 50. Gold is expected to continue its broad range-bound trading on Friday. The day's trading strategy remains to sell high and buy low, with short-term participation.
Trading Strategy:
Short-term gold buy at 3722-3725, stop loss at 3714, target at 3760-3780;
Short-term gold sell at 3762-3765, stop loss at 3774, target at 3730-3710;
Key Points:
First support level: 3737, second support level: 3722, third support level: 3704
First resistance level: 3762, second resistance level: 3788, third resistance level: 3805
