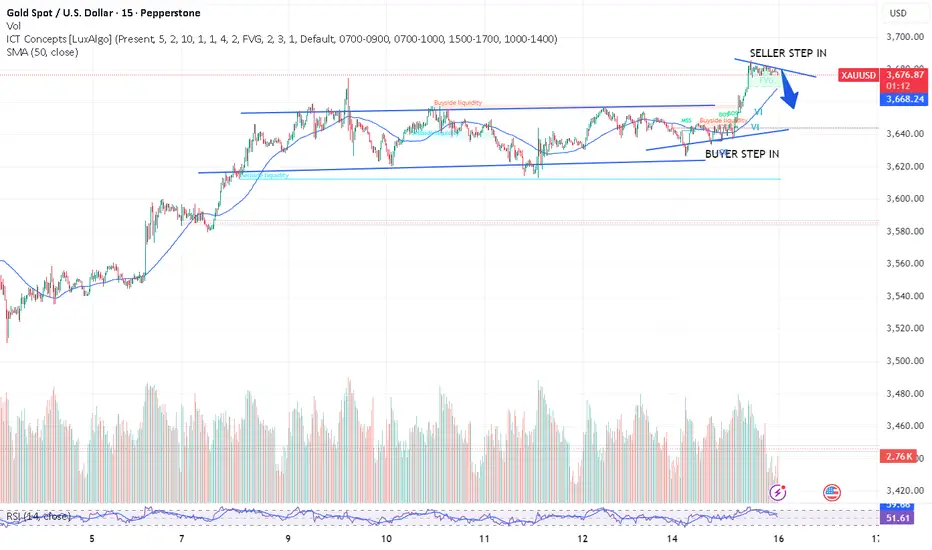
GOLD FALL TIME Lets Goo , Gold Selling Now
Reason SMT & BEARISH FVG
And Buy Setup Gold From OB / DEMAND ZONE
LETS GOO , HIGH PROBABILITY SETUP
FOLLOW US FOR MORE TRADES
Goldlongsetup

GOLD READY TO FALL ? Gold Prediction
Gold Buy From Order Block / Demand Zone
It Will Sweep The Liquidity And Then Go Long With High Probability Setup

ANFIBO | XAUUSD got ATH on 09.16.2025 and what?Gold has made a new breakout by breaking through the sizeway zone and rising to a new ATH. The plan is that we need to pay attention to the price zone around the 3700 resistance. Today's plan is as follows:
💚 SUPPORT ZONES: 3675 - 3655
❤️ RESISTANCE ZONES: 3700 - 3705 - 3745
✅ BUY SCALP: around 3675, SL 3670, TP 3700 - 3745
❌ SELL SCALP: 3700 - 3705, SL 3710, TP 3675 - 3655
✅ SWING BUY: 3550 - 3560, SL 3540, TP 3625 - 3675 - 3700 - OPEN
❌ SWING SELL: 3790 - 3801, SL 2820, TP 3700 - 3570 - 3450 - OPEN
Hope is right!

The opportunity is right in front of you, don’t miss it!Yesterday, the technical analysis of gold showed a rapid downward retreat in the Asian session, breaking through the 3630 mark and stabilizing and rebounding. It fluctuated and consolidated around the 3630 mark in the European and US sessions, and finally ushered in a strong rise by bulls. The price of gold accelerated to break through and stand above the 3670 mark to set a new historical high. The gold bulls rose as expected, and there are still new highs above, so we are patiently waiting for gold to continue to rise. When it falls back, we will continue to look for opportunities to enter the market and go long. Yesterday, we responded flexibly around the key points, and made precise arrangements with two-way thinking to achieve a double kill of long and short, a steady harvest, and perfectly reach our goals. Today we continue to wait for further declines. After all, all indicators are bullish. Don’t guess the top if the bulls are strong. If the Federal Reserve’s interest rate decision is on Thursday, then the line around 3700 will also be within reach. At present, don’t blindly chase the longs above the 3680 line. If your current trading is not ideal, I hope I can help you avoid investment pitfalls. Welcome to communicate with us!
From the 4-hour analysis, the support below is around 3670-3360. If it pulls back to this position, the main bullish trend will remain unchanged. The short-term bullish strong dividing line is 3650. As long as the daily closing level does not fall below this position, any pullback is an opportunity to go long, and the main tone of participating in the trend will remain unchanged. I will provide you with the specific operation strategies at the bottom, please pay attention to them in time.
Gold operation strategy: Go long when gold falls back to around 3675-3360, target 3690-3695. If it breaks, look at the 3700 line.

Gold Hits New ATH, Eyeing $3700 Psychological Barrier📊 Market Developments:
Gold surged sharply and set a new all-time high at $3,697/oz. The main driver comes from expectations that the Fed may soon signal rate cuts, while investors seek gold as a safe haven amid geopolitical uncertainty.
📈 Technical Analysis:
• New Resistance: $3700 (psychological) – $3708 (Fibonacci extension).
• Nearby Support: $3690 – $3685 (previous ATH breakout zone).
• EMA 50 & 100 on H1: Both remain upward sloping, reinforcing the bullish trend.
• H1 Candle: Strong momentum, but a short pullback may occur around 3700.
🔎 Outlook:
The uptrend remains dominant; however, the $3700–$3708 zone is a key psychological barrier where short-term profit-taking may emerge. If price holds above $3685, the bullish momentum is likely to continue.
🎯 Suggested Trading Strategy:
• BUY (safe entry): 3691 – 3688, SL: 3685, TP: 40–80–200 pips.
• SELL short-term (scalping): Around 3700–3705 if H1 reversal candles appear, SL: 3710, TP: 30–60 pips.

GOLD - XAUUSD - IDEAS FOR THE DAYTeam, please carefully looking at the GOLD pattern,
it was consolidation range between 3620-3650 before breaking the channel. this is 5 minutes channel
but if you carefully look at 4 hour channel - the range created during 10 APRIL to 25 AUG before break out.
Short term GOLD should pull back toward 3667-65 - if you are short, stop loss at 3685-90
target short term zone at 3667-65
Medium term if you could hold longer within a week, we should expect the pull back toward the 3500-3400 zone - please review 4 hours chart.
LETS GO
Which comes first, 3600 or 3700?International gold prices continued to fluctuate within a narrow range, hovering around the 3640 level. The range continued to narrow, and market sentiment clearly became more cautious. This phenomenon is due to investors entering a cautious wait-and-see phase regarding the upcoming Federal Reserve interest rate decision, which has weakened trading appetite and led to low price volatility.
From the 1-hour candlestick chart, gold prices are currently under pressure from a short-term downward trend line, with 3650 becoming the core bull-bear dividing line for today's market. If prices remain below 3650, short-term range-bound consolidation is likely, and caution is advised regarding the risk of a subsequent test of support. If prices break through and stabilize at 3650, it will indicate that short-term resistance has been broken, bullish momentum is expected to be re-released, and the market may resume its strong upward trend, heading towards the previous highs of 3656-3660.
Regarding downward support, the primary focus is on the lower band of the ascending channel. If this fails, strong support will focus on the 3600 mark. This level is not only a key support level that has been repeatedly tested previously, but also a crucial defensive line for the bullish trend on the daily chart. A break below this level would trigger a periodic correction.
Considering the high market uncertainty before the Fed’s interest rate decision is implemented, the recommended operating strategy is to focus on short-term trading: whether going long or short, positions must be strictly controlled to avoid large losses due to sudden fluctuations in news. The core principle is to “quit while you are ahead.”

Can gold break through the resistance level?Whether you go long or short, you can make money, the only exception is the greedy. To invest, you must block excitement, or at least don't get excited at the wrong time. Emotions play a key role in all transactions. Spend all your time studying trends, never go against the trends, learn to follow, and then you can learn the essence. There is no invincible general in the financial market, and a person cannot make money beyond the scope of cognition. Investing itself is an assessment of self-cognition.
After gold fell to 3626, it rebounded slightly. It is still in a state of volatility as a whole, and the volatility is narrowing. From a technical point of view, the bullish momentum has not been exhausted, and the sideways movement of the gold market at this stage is far from over. From a big cycle perspective, 3675 is not a high point. However, as the interest rate decision approaches, both bulls and bears may turn to wait and see, and the short-term market is expected to be dominated by fluctuations, waiting for the Fed's monetary policy guidance! The upper resistance level is the pressure level formed by the two recent high points, and the support is at the lower track of the rising channel and the strong support of 3600.

XAUUSD AKA GOLDI wont go against the bias but we can see gold taking liquidity on the downside and price is bullish so we can see price go higher from next week.

ANFIBO | XAUUSD Plan [15.10.2025 - 19.10.2025]Here is my XAUUSD plan for next week:
💚 SUPPORT ZONES : 3625 - 3595 - 3580 - 3575
❤️ RESISTANCE ZONES : 3665 - 3670 - 3700
✅ BUY SCALP : around 3595, SL 3580, TP 3625 - 3645 - 3670
❌ SELL SCALP :
(1) 3673 - 3675, SL 3678, TP 3645 - 3600
(2) 3700 - 3705, SL 3710, TP 3675 - 3610
✅ SWING BUY : 3550 - 3560, SL 3540, TP 3625 - 3675 - 3700 - OPEN
❌ SWING SELL : 3790 - 3801, SL 2820, TP 3700 - 3570 - 3450 - OPEN
Enjoy it guys! 😊

Can gold continue to rise next week?With the right direction, the journey is not a problem. Time will prove your strength, and strength will win the future. Let trust become profit. The market is ever-changing, and following the trend is the best path. When the trend emerges, act accordingly; don't buy against the tide.
Gold had a relatively perfect week. After a slight pullback on Friday, it rose again. It found resistance around 3656-60 before oscillating and stalling. This level serves as a bridge between the past and the future. Next week's interest rate decision will be a key focus, and both market news and technical indicators are bullish for gold. Let's wait and see. If your current trading is not ideal, I hope I can help you avoid mistakes.
From the 4-hour analysis, the support below is 3628-30, and the short-term bullish strong dividing line is 3600. If the daily level stabilizes above this position, it can continue to maintain the rhythm of pulling back to low and buying in line with the bullish trend. The main strategy is to buy on dips.
I will remind you of the specific operation strategy during the trading session, so please pay attention to it in time.

3655 accurately shorted gold to seize the opportunity of declineGold fluctuated higher today, rising from 3630 all the way to 3657. However, after encountering resistance at this level during the European session, it ultimately retreated. The overall trend remains consistent with our previous analysis and strategy. Today's strategy is to short on rebounds around 3655, watching for pullbacks. The current low has been around 3637, resulting in a small short-term gain of approximately 150 pips. Congratulations to those who followed this strategy for a solid win! For those who are short-term traders, it's recommended to lock in profits or lower your stop-loss to avoid profit taking. For those holding medium-term positions, manage your positions appropriately and patiently await the next wave of opportunities. Following the trend and executing your plan are the keys to stable profits in the market.

Gold Set to Extend Gains as Fed Rate Cuts Loom📊 Market Developments:
Gold is supported by expectations that the Federal Reserve will cut interest rates, lowering the opportunity cost of holding bullion.
Recent U.S. labor market data showed weakness, with higher jobless claims and downward revisions in nonfarm payrolls.
CPI inflation remains elevated, while PPI softened slightly, reinforcing bets on policy easing.
A weaker U.S. dollar and lower Treasury yields further boost gold’s appeal.
📉 Technical Analysis:
• Key Resistance: $3,670 – $3,674, with further upside potential toward $3,700–$3,730.
• Nearest Support: $3,600; if broken, next levels at $3,561–$3,536.
• EMA: Price is trading above EMA50 and EMA200, keeping the bullish structure intact.
• Candlestick / Momentum: RSI remains elevated, showing strong upward momentum though slightly overbought; dips are being bought quickly.
📌 Outlook:
Gold may continue to rise in the short term if Fed maintains a dovish stance and U.S. data remain soft.
However, stronger-than-expected inflation or hawkish Fed signals could trigger a pullback toward $3,600 or lower.
________________________________________
💡 Suggested Trading Strategy:
• SELL XAU/USD: $3,682 – $3,685
🎯 TP: 40 / 80 / 200 pips
❌ SL: $3688
• BUY XAU/USD: $3,617 – $3,620
🎯 TP: 40 / 80 / 200 pips
❌ SL: $3614

ANFIBO | I think XAUUSD on 12.10.2025 ???After breaking the H1 uptrend line, Gold returned to the Fibo retracement zone 0.5 with a strong rebound, the current price is moving around the price zone 3655 and still maintains a strong rebound. Pay attention to the following important zones for today's strategy:
>> SELL SCALP: 3673 - 3675, SL 3678, TP 3655 - 3625 - 3600
>> BUY SCALP: around 3595, SL 3588, TP 3625 - 3645 - 3665
>>> SWING BUY: 3560 - 3570, SL 3550, TP 3620 - 3675 - 3700 - OPEN
>>> SWING SELL: 3790 - 3801, SL 2820, TP 3700 - 3570 - 3450 - OPEN
Have a nice weekend guys! :D

XAUUSD – CPI Data Breakdown & Professional Insight | MMFLOW 🚀 XAUUSD – CPI Data Breakdown & Professional Insight | MMFLOW TRADING
📊 CPI Results (September)
Core CPI m/m: 0.3% (In line with forecast: 0.3%, previous: 0.3%)
CPI m/m: 0.4% (Above forecast: 0.3%, previous: 0.2%)
CPI y/y: 2.9% (In line with forecast: 2.9%, previous: 2.7%)
📈 MMFLOW Insight – What This Means for Gold (XAUUSD)
1️⃣ Headline CPI Beat Signals Sticky Inflation
The uptick to 0.4% m/m surprised markets and indicates inflationary pressures are not cooling as much as expected.
This strengthens USD short-term and pushes Treasury yields higher. The initial reaction is selling pressure on gold as traders price in a more hawkish Fed stance.
2️⃣ Core CPI Stability Offers Mixed Sentiment
Core CPI staying flat at 0.3% suggests underlying price pressures remain steady.
This tempers extreme hawkish expectations, leaving room for gold to recover after initial volatility, especially if yields stabilize.
3️⃣ Medium-Term Implications
Despite today’s stronger headline CPI, inflation remains on a downtrend y/y (2.9%), supporting the broader narrative of a Fed pivot in the coming months.
Central banks (esp. PBoC & EM countries) continue to accumulate gold, which underpins long-term bullish bias.
🔑 Technical Reaction Zones (M15/M30)
Resistance: 3,648 – 3,654 (Trendline/React FIB)
Support / Liquidity Zones:
• 3,624.33 – Key Zone Support BUY
• 3,612.54 – CP/React Zone FIB
• 3,599.23 – Major BUY Zone
🛠 Trading Approach After CPI
Expect whipsaw price action: an initial spike lower (USD strength) followed by potential recovery if buyers defend liquidity zones.
SELL Scalp: Only on strong rejection from 3,648–3,654 with tight SL.
BUY Opportunity: Watch for confirmed bounce signals at 3,624 / 3,612 / 3,599.
Stay nimble: CPI-induced volatility can sweep both sides before choosing direction.
✅ Summary
The hotter CPI print adds near-term pressure to gold, but the overall structure and central bank demand remain supportive. Expect liquidity sweeps before a potential bullish continuation.
👉 Follow MMFLOW TRADING for real-time execution updates, liquidity setups, and professional market insights during this volatile post-CPI session.

Gold Spikes After CPI but Faces Profit-Taking Pressure📊 Market Move:
Right after the CPI release, gold surged from $3613 to $3643, but profit-taking quickly dragged prices back to around $3635.
📈 Technical Analysis:
🔺 Resistance: 3645 – 3650
🔻 Support: 3626 – 3620
📉 Short-term EMA still points upward, suggesting the uptrend remains intact, though momentum has weakened after the spike.
🧐 Outlook:
Gold is undergoing a technical pullback after the sharp rally; the market needs further H1/H4 candle confirmation to see if the bullish move toward 3650+ continues.
🎯 Trading Strategy:
o Wait for a retest of 3626–3620; if reversal candles appear, consider a Buy following the trend.
o If price breaks below 3620, risk opens for a deeper drop toward 3610–3605.

ANFIBO | I think XAUUSD on 11.10.2025 ???Well, today's gold price has broken the current H1 uptrend line, the price is currently around 3620, and is still holding on to the H4 uptrend line. We will need to pay attention to the following important resistance and support zones:
>> SELL SCALP: around 3670, SL 3677, TP 3600 - 3575
>> BUY SCALP: around 3580, SL 3570, TP 3665
>>> SWING BUY: 3560 - 3570, SL 3550, TP 3620 - 3675 - 3700 - OPEN
>>> SWING SELL: 3790 - 3801, SL 2820, TP 3700 - 3570 - 3450 - OPEN
Have a nice day guys ;)

Gold swings violently after PPI data📊 Market Movement:
After the news, gold spiked to 3657 then quickly dropped to 3641. It is now recovering and trading around 3648, showing a tug-of-war between buyers and sellers.
🧭 Technical Analysis (H1):
• Resistance: 3652 – 3657
• Support: 3641 – 3638
• EMA20 is still pointing upward, but the strong wick candle shows high volatility.
• Break below 3641 → likely down to 3632 – 3628.
• Break above 3652 → likely retest 3660 – 3665.
📌 Outlook:
Gold is moving sideways in the 3641 – 3657 range.
🔻 Selling pressure is strong at the top.
🔺 Buyers are still defending around 3640.
👉 The next move depends on a breakout from this range.
Trading Strategy:
• 🔺 BUY: 3642 – 3645 | SL 3638 | TP : 40/80/200 pips
• 🔻 SELL: 3660 – 3657 | SL 3663 | TP : 40/80/200 pips
🟡 Focus on scalping within the range, wait for breakout to follow the bigger trend.

Gold Trade Idea Thurs 11 Sep Gold is breaking out of the ascending channel and we expect a new ATH again.
The big move might be before, during or after tonight CPI and PPI data.
Gold 30 min chart
Enter: Buy/long 3645
stop loss: 3630
Target 1: 3675
Target 2 : 3700

Pullback for accumulation; bullish momentum remains promising.Gold broke upward against the resistance of the trendline, rising to a high of around 3,658. As indicated in the morning analysis, we have advised everyone to take partial profits first on positions entered below the 3,600 level to lock in gains. From the 1-hour candlestick chart, gold has consistently maintained a "gradual upward movement amid consolidation" rhythm, with lower lows continuing to move higher, and the stability of the trend structure is remarkable.
During a one-sided upward trend, the market's response to data is biased: bullish news will be amplified, while bearish news will be overlooked. One should not rely excessively on data for trading; more seasoned traders understand the logic behind the data and the current market environment.
For subsequent moves, when the price retraces to the hourly support level, those who have already taken profits can continue to follow up with long positions. We will closely track and analyze the market daily. If you lose your direction in such a market, you are welcome to follow us and leave a message for communication to obtain more targeted analysis and trading advice.

XAU/USD) Bullish trend analysis Read The captionSMC Trading point update
Technical analysis of Gold (XAU/USD) 1H analysis:
---
Technical Breakdown
1. Ascending Channel
Price is trending higher within a clear ascending channel, respecting both support and resistance trendlines.
The bullish structure remains intact as long as price holds above channel support.
2. Demand Zones (Yellow Boxes)
Price respected a Fair Value Gap (FVG) demand zone around $3,600 – $3,620, leading to bullish continuation.
Another demand area around $3,640 acted as a recent support after a market structure shift (MSS).
3. Market Structure
A bullish MSS confirms upside momentum.
Higher highs and higher lows support the ongoing bullish trend.
4. RSI (14)
RSI at 59.46, leaning bullish but not yet overbought — leaving room for continuation to the upside.
5. Target Point
Projection points towards $3,689 as the next target, aligning with channel resistance and Fibonacci extensions.
Mr SMC Trading point
---
Summary Idea
Gold is trading strongly within an ascending bullish channel, bouncing off demand zones and maintaining upward structure. As long as price holds above $3,640, the bias remains bullish with a target at $3,689.
---
please support boost 🚀 this analysis

Gold testing highs, possible pullback below $3,675📊 Market Overview:
Gold surged to an all-time high at $3,673.95/oz on September 9, 2025, driven by Fed rate-cut expectations, USD weakness, and strong central bank demand.
On September 10, gold is consolidating around $3,635/oz, with markets awaiting key US inflation data.
📉 Technical Analysis:
• Key Resistance: $3,675 – $3,700
• Nearest Support: $3,600 – $3,620
• EMA: Price remains above EMA 09 → bullish momentum intact.
• Candlestick / Volume / Momentum: Technicals still show Strong Buy signals, but overbought conditions suggest short-term pullback risk.
📌 Outlook:
Gold may pull back in the short term if sellers defend the $3,675–$3,700 zone, but a breakout above this level could trigger another rally toward $3,720–$3,750.
💡 Trading Strategy Suggestion:
🔻 SELL XAU/USD: 3697 – 3700
🎯 TP: 40 / 80 / 200 pips
🛑 SL: 3703
🔺 BUY XAU/USD: 3617 – 3620
🎯 TP: 40 / 80 / 200 pips
🛑 SL: 3614
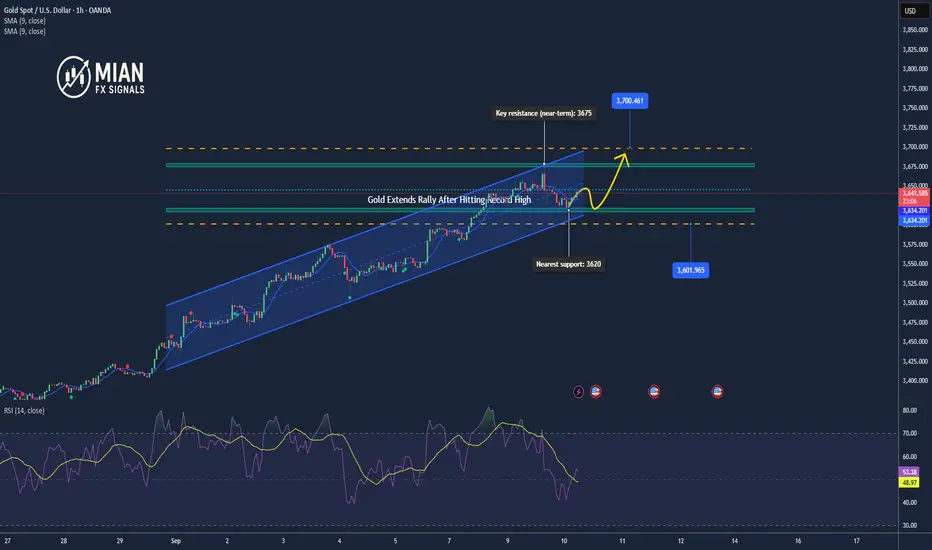
Gold Extends Rally After Hitting Record High📊 Market Overview:
Gold is holding at record highs, trading around $3,652/oz, supported by a weaker dollar, lower yields, and growing Fed rate cut expectations.
📉 Technical Analysis:
• Key resistance (near-term): 3650 – 3665
• Extended resistance (H1): 3690 – 3700
• Nearest support: 3640 – 3635
• Extended support (H1): 3615 – 3608
• EMA: Price is trading above multiple EMAs, confirming a bullish bias.
• Candles / Volume / Momentum: Momentum remains bullish; RSI on H1 is slightly overbought, suggesting potential for short pullbacks before continuation.
📌 Outlook:
Gold is likely to continue higher short-term if it holds above 3640. A breakout above 3665 could open the door to 3690 – 3700, with potential extension to 3725 – 3735. Conversely, a drop below 3635 may trigger downside pressure toward 3615 – 3585.
💡 Suggested Trading Strategy:
🔺 BUY XAU/USD: 3640 – 3643
🎯 TP: 40/80/200 pips
❌ SL: 3637
🔻 SELL XAU/USD : 3663 – 3666
🎯 TP: 40/80/200 pips
❌ SL: 3669
