Gold Reaches New High at 3,486 Amid Rising Rate-Cut Expectations📊 Market Overview:
Gold surged to a new high at $3,486/oz, surpassing earlier levels around $3,470, driven by elevated expectations of a Fed interest rate cut this month.
A weaker USD—amid dovish Fed comments and a court ruling limiting Trump-era tariffs—further underpinned gold’s appeal.
📉 Technical Analysis:
• Key resistance: $3,490–$3,495 (psychological barrier before $3,500).
• Nearest support: $3,460–$3,465 (EMA 09 + technical zone).
• EMA 09: Gold is trading above EMA 09 → bullish momentum.
• Candles / Volume / Momentum: Continuous rally with strong demand; however, a pullback is likely near resistance.
📌 Outlook:
Gold may continue climbing in the short term if Fed cut expectations remain firm and USD stays weak.
However, stronger US data (such as this week’s NFP) could dampen rate-cut bets and trigger a short-term correction.
💡 Suggested Trading Strategy
🔻 SELL XAU/USD : ~$3,492–$3,495
🎯 TP: 40/80/200 pips
🛑 SL: ~$3,498
🔺 BUY XAU/USD : ~$3,462–$3,465
🎯 TP: 40/80/200 pips
🛑 SL: ~$3,459
Goldlongsetup

Gold, Silver soar on rate cut hopes & Trump tariff rullingGold and silver are making headlines as both metals surge amid a mix of macroeconomic and technical factors. Gold is trading just below its all-time record, having recently touched $3,495 per ounce, while silver has soared to a 14-year high of above $40.50.
The main catalyst behind this rally is growing confidence that the Federal Reserve will cut interest rates soon, following dovish signals from Fed officials and signs of a softening US job market. With markets now pricing in a 90% chance of a rate cut, the US dollar has weakened, making non-yielding assets, such as gold and silver, more attractive. The recent US court ruling that deemed most of President Trump’s tariffs illegal has added further pressure on the dollar, while thin trading conditions due to a US bank holiday have amplified price moves.
Bullish signals for gold and silver are strong. Both metals are also benefiting from tight supply conditions and ongoing geopolitical uncertainty, which are driving investors toward safe-haven assets.
Gold is consolidating just below record highs, and technical analysis points to a potential breakout from a bullish symmetrical triangle pattern. If confirmed, this could propel gold toward new highs, with targets in the $3,550–$3,820 range.
Silver’s rally is supported by a classic pennant formation, with technical projections suggesting a move toward $42 is possible in the short term.
However, there are bearish risks to consider. If upcoming US employment data surprises to the upside or inflation remains stubbornly high, the Fed could delay or scale back rate cuts, which would strengthen the dollar and potentially cap further gains in gold and silver.
Additionally, both metals are trading near major resistance levels, and a failure to break out convincingly could trigger profit-taking or a technical pullback. For gold, support sits around $3,440, with the 50-day moving average at $3,350 providing a key floor. For silver, a drop below $39.55 could signal a short-term reversal.
While the setup favours further upside, especially if the Fed delivers on market expectations, traders should stay alert to key data releases and resistance levels that could shift the narrative in either direction.
This content is not directed to residents of the EU or UK. Any opinions, news, research, analyses, prices or other information contained on this website is provided as general market commentary and does not constitute investment advice. ThinkMarkets will not accept liability for any loss or damage including, without limitation, to any loss of profit which may arise directly or indirectly from use of or reliance on such information.

Gold Surges $70+ – Extreme Volatility, Traders Stay Sharp!Market Overview
Gold (XAUUSD) has just witnessed a shocking $70+ rally, sparking intense volatility across global markets.
Rising geopolitical tensions are driving safe-haven demand to the extreme, making gold the centre of attention worldwide.
In this highly tense and unpredictable environment, every entry decision could be a make-or-break moment for traders.
🔎 Macro Outlook
🌍 Geopolitical risks → Money continues to flow into gold as a safe haven.
💵 USD & bond yields are not strong enough to halt the momentum.
📊 Upcoming PCE data & Fed policy decisions could inject even more volatility.
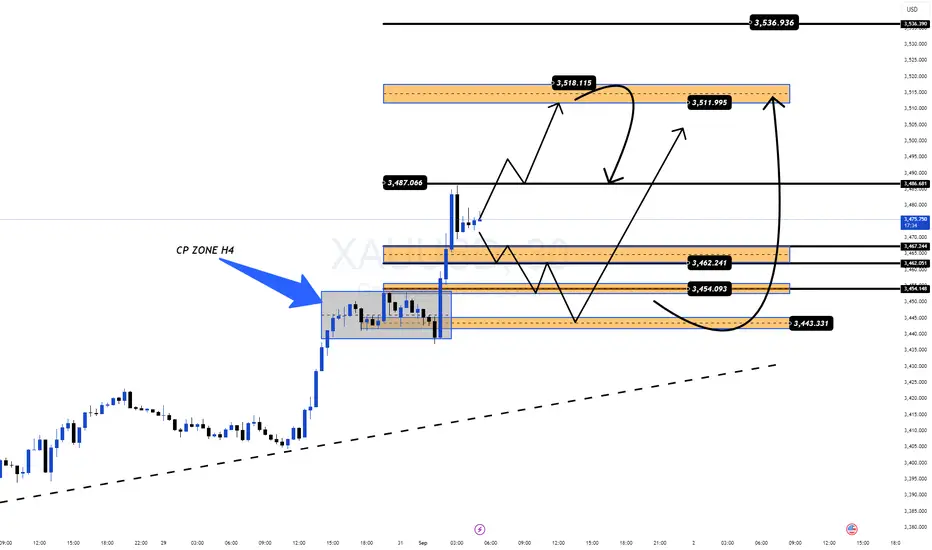
📊 Technical Outlook (H4)
After the explosive rally, gold consolidated within CP Zone H4 before breaking out higher.
Key Support Zones
3,462 – 3,443 → Critical levels to sustain the bullish structure.
Key Resistance Zones
3,487 – 3,518 → Possible reaction area before correction.
A breakout could open the path to 3,536 and beyond.
📌 Possible Scenarios
Scenario 1 (Preferred)
✅ Price holds above 3,462 → Tests 3,511 – 3,518 and potentially breaks towards 3,536.
Scenario 2 (Deeper Pullback)
⚠️ If 3,462 fails → Price may retest 3,443 before regaining upward momentum.
🎯 Trading Plan (Reference Only)
✅ BUY ZONE 1
Entry: 3453 – 3451
SL: 3446
TP: 3460 – 3465 – 3470 – 3475 – 3480 – ???
✅ BUY ZONE 2
Entry: 3444 – 3442
SL: 3438
TP: 3450 – 3460 – 3470 – 3480 – ???
❌ SELL ZONE
Entry: 3512 – 3514
SL: 3518
TP: 3505 – 3500 – 3495 – 3490 – 3480 – 3470
💡 Final Thoughts
Gold remains in a strong uptrend, fuelled by geopolitical risk and macro flows.
Yet after such an aggressive move, a technical correction is highly likely.
Traders should carefully monitor price action around support/resistance zones for optimal entries.
❗ Most importantly: stick to risk management & Stop Loss discipline – in markets like this, survival comes before profit.
Gold retreats, buying opportunity reappearsAfter stabilizing at 3400 yesterday, gold prices continued their upward trend, reaching a high of 3423. This is very consistent with my view yesterday. The only regret is that gold prices did not return to 3400 after the article was published, and we missed this wave of gains.
Yesterday, in his speech on monetary policy, Waller expressed support for a 25 basis point interest rate cut in September and predicted further rate cuts within the next three to six months. If the employment data shows "significant weakness" in the US economy, he may support a larger rate cut (which is bullish for gold).
Based on gold's trend, 3400 OANDA:XAUUSD is definitely a key level. After yesterday's breakthrough, it has clearly become strong support. Therefore, I believe that as long as gold prices remain above 3400, the range of gold prices will likely be between 3400 and 3450.
Gold prices just retreated again. Not wanting to miss out, I bought around 3405, with a take-profit of $10-30 depending on the situation, and a stop-loss of $3395-3390.
If the 3395-3390 range is broken, don't go long on gold.

Whether gold can hold steady at 3400 is the keyThe current market is bullish, primarily due to the developments surrounding Trump's proposed firing of Cook. Of the seven members of the Federal Reserve Board, three already support a rate cut: Bowman, Milan, and Waller. With the addition of another supporter, Trump's goal would be achieved. If Cook were to be fired and a more compliant candidate were to be promoted, the rate cut would be achieved, but the Fed's independence would also be undermined.
The dollar, US stocks, and US Treasuries would all be affected, and gold, the best safe-haven asset, would inevitably soar.
Today, we're focusing on two levels: 3400 and 3380.
If gold can stabilize above 3400 OANDA:XAUUSD , it's likely to head towards 3430-3450. At that point, you could consider buying around 3400.
Conversely, if it can't hold above 3400, it could test support at 3380. As long as it doesn't fall below 3380, it would be a good buying opportunity.
Good luck to everyone💪
📣If you have different opinions, please leave a message below to discuss
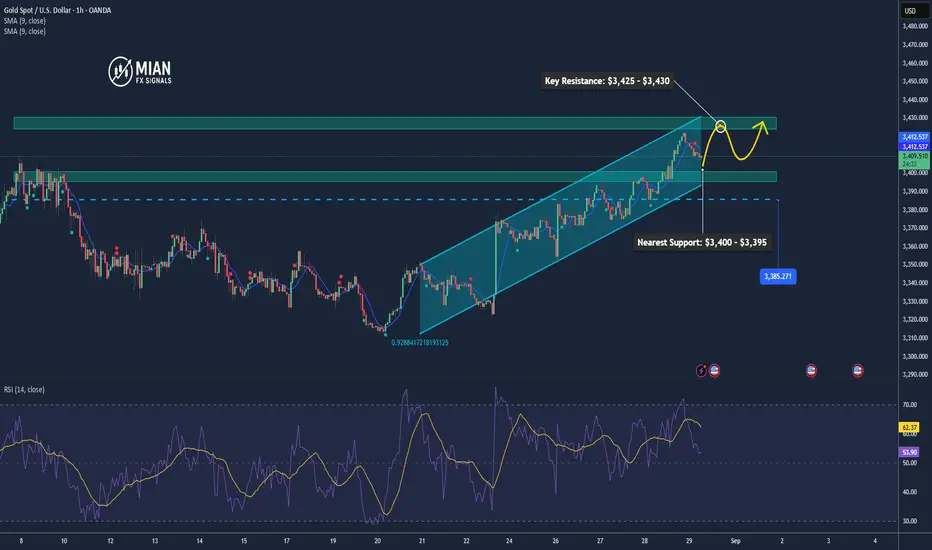
Gold Pulls Back Slightly Ahead of U.S. PCE Data📊 Market Dynamics:
Gold eased to around $3,408/oz due to profit-taking after the recent rally, while investors await U.S. PCE inflation data – a key indicator that could influence the Fed’s rate-cut decision.
📉 Technical Analysis:
• Key Resistance: $3,425 – $3,430
• Nearest Support: $3,400 – $3,395
• EMA 09: Price remains above EMA 09, keeping the bullish bias intact.
• Candlestick / Momentum: H1 candles show long lower wicks around $3,400, signaling potential buying pressure.
📌 Outlook:
In the short term, gold may consolidate around $3,400 and rebound if PCE data reinforces expectations of an imminent Fed rate cut.
💡 Suggested Trading Strategy:
🔻 SELL XAU/USD: $3,427 – $3,430
🎯 TP: 40/80/200 pips
❌ SL: $3,433
🔺 BUY XAU/USD: $3,397 – $3,400
🎯 TP: 40/80/200 pips
❌ SL: $3,394
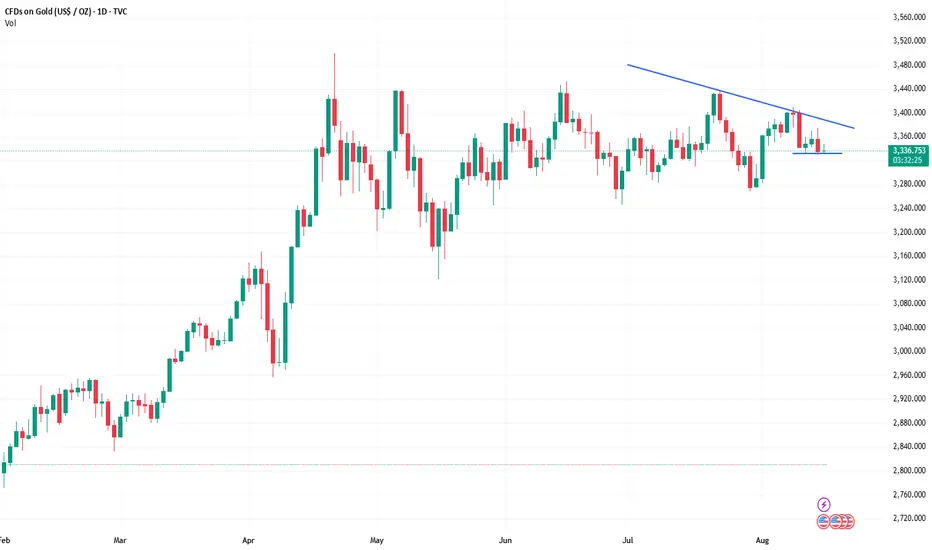
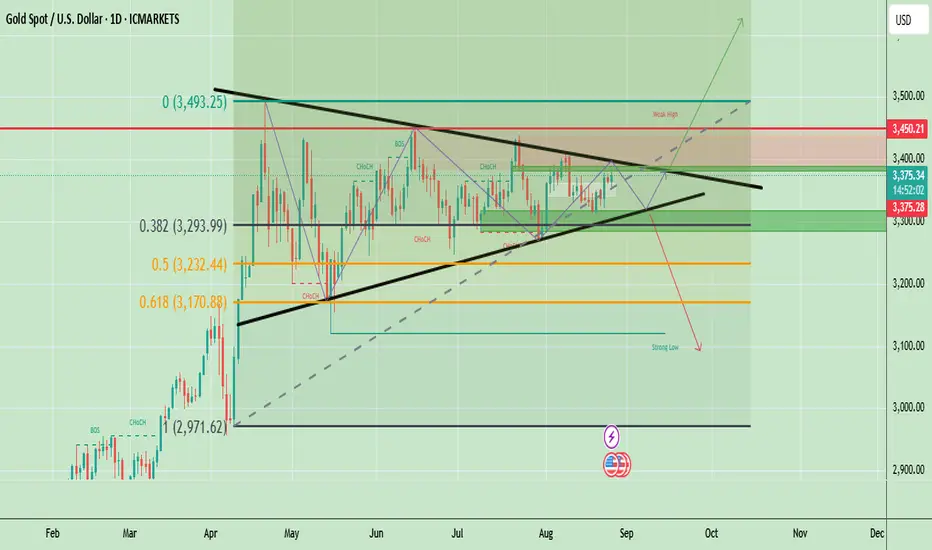
Gold Price Update – Neutral Trend with Key Breakout Levels AheadAs of August 26, 2025, gold (XAU/USD) is trading around $3,375 and remains in a consolidation phase inside a symmetrical triangle. Price is holding between $3,170 support and $3,450 resistance, with $3,493 as a major supply zone. A breakout above $3,450–$3,493 could extend the rally toward $3,600, while a breakdown below $3,293–$3,170 may trigger a decline toward $3,000. Until a clear breakout occurs, the overall trend is neutral with a slight bullish bias due to the long-term uptrend still intact.
🔑 Key Levels to Watch
- Resistance: $3,383 → $3,450 → $3,493
- Support: $3,317 → $3,293 → $3,232
- Breakout Zones: Below $3,293: Opens room to $3,170. Above $3,390: May lead to fresh highs toward $3,450+
Price has been ranging for months between $3,170 (Fib 0.618) support and $3,493 (supply/weak high) resistance. Market structure shows multiple CHoCH (Change of Character) signals, indicating indecision and sideways consolidation.
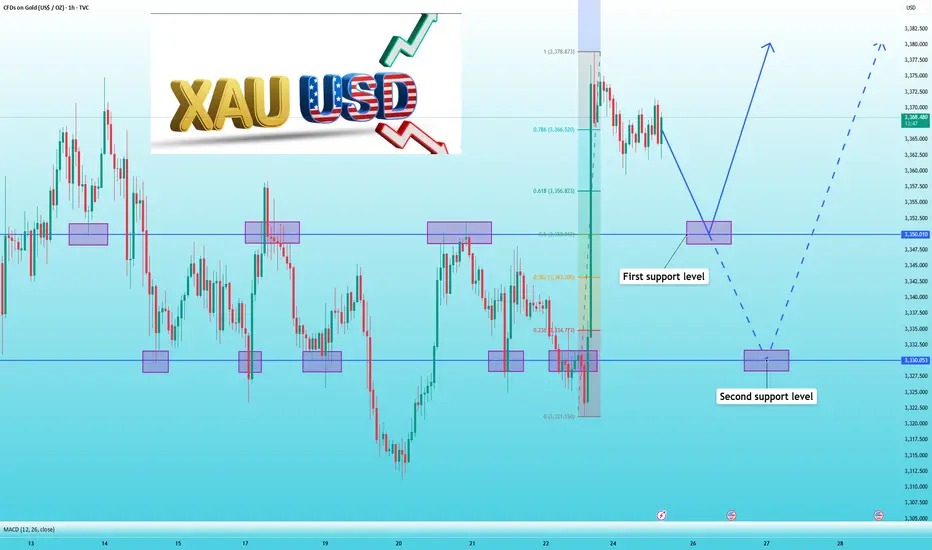
Gold 1hr Chart
Gold is in an uptrend, but watch $3,378 resistance for breakout confirmation; otherwise, expect a dip toward $3,345–$3,357 before resuming higher.
Buy Zone: $3,345 – $3,357 (ideal retracement support)
Buy Trigger: Break and close above $3,378 (confirmation for upside move)
Note
Please risk management in trading is a Key so use your money accordingly. If you like the idea then please like and boost. Thank you and Good Luck!
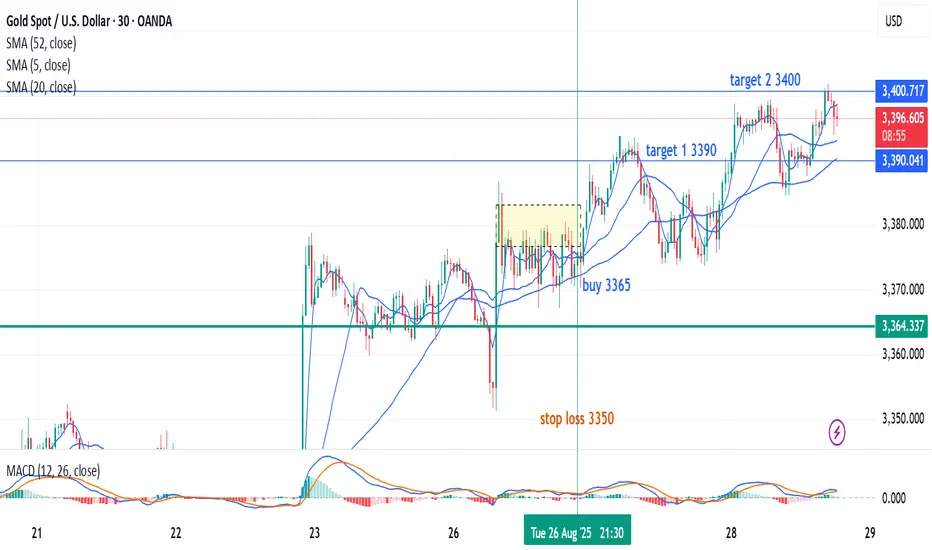
Tue 26 Aug Gold Trade Update - Target 1 and Target 2 reachedOn Tuesday 26 Aug, I shared a gold trade idea (please refer to previous post)
Buy 3365
stoo loss 3350
Target 1: 3390
Target 2: 3400
Target 3: 3420
Target 1 and Target 2 reached !
Hooray !
Target 3 might have some challenge, price might come down before going up again.
Generally speaking, Target 2 can take profit already.
Gold Price Analysis August 27Gold is seeing some selling pressure in early Tokyo trading. Looking towards key support areas for today's BUY trading strategy. 3371 and 3357 continue to be in focus for today's BUY strategies looking towards 3400 and higher.
BUY GOLD 3371 Stoploss 3365
BUY GOLD 3359 Stoploss 3353

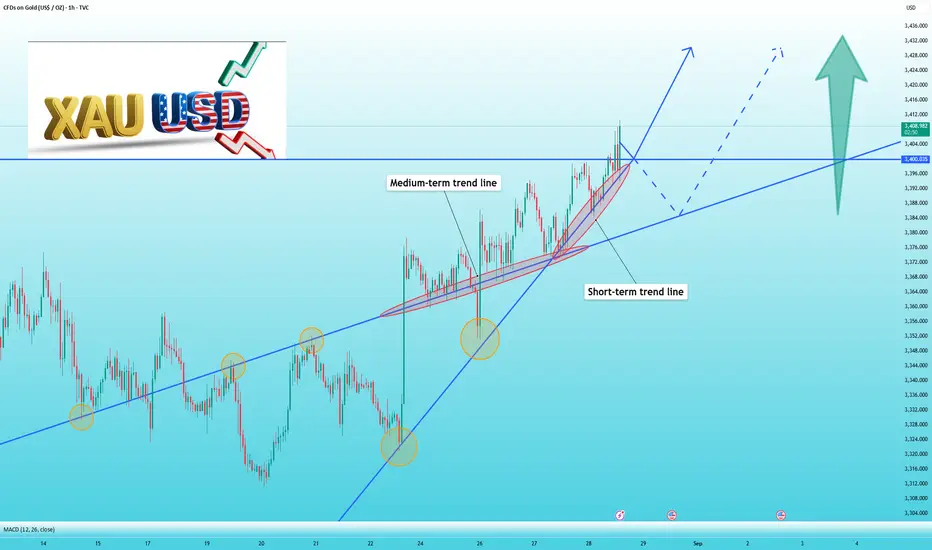
XAUUSD: Don’t rush to chase the rise, wait for a pullback firstThis year's Jackson Hole symposium, held at a policy crossroads for the Federal Reserve over whether to cut interest rates, captivated global attention.
Powell's shift from hawkish to dovish rhetoric ignited the market, completely contradicting previous market forecasts. The US dollar subsequently fell sharply, leading to a breakout rally in gold, from $3,330 to around $3,380.
In the short term, gold prices surged strongly last Friday, with many investors chasing long positions. Therefore, we should be wary of a pullback after profit-taking. Furthermore, Powell's speech last Friday has largely been digested, and the excitement has cooled somewhat.
In the long term, gold prices will undoubtedly continue to rise. A Fed rate cut is imminent, and any reduction, regardless of the magnitude, would represent a resumption of quantitative easing. The resulting situation is foreseeable. The US dollar will continue to decline, while gold will continue to rise, potentially reaching a new all-time high of $3,500.
Looking at the 1-hour gold chart, 3350, which has previously failed to break through, will be the next key support level. If it holds, buy boldly. If it breaks, look for further support at 3330.
Therefore, don't rush into trading. Waiting for the right entry point will be more efficient and more stable.
GOLD M15 MARKET STRUCTURE Gold Bullish Structure !
Gold Buy Zones : 3373 (CISD)
Gold Buy Zone : 3362 , 3358 (BASE BUY)
Gold Buy Zine : 3368 , 3364 (IFVG + FVG)
Manage Your Trade With Risk Management
Good Luck With Your Trading

Gold Breaks Descending Trendline After Support RejectionHello guys!
Price touched the major support level at the recent low, confirming buyers’ activity.
After that, a QM (Quasimodo) pattern formed, often seen before reversals.
The descending trendline has been broken, showing weakness in bearish momentum and a potential shift to the upside.
A long entry can be considered in the QM blue zone, which is now acting as a demand area.
As long as price holds above this zone, the bias remains bullish, with potential for continuation higher.

FOMC mins could be rates catalyst if Powell is neutral at JHSTraders are laser-focused on the release of the FOMC meeting minutes, which could prove to be the most significant market-moving event ahead of the Jackson Hole Symposium if Powell offers no insights. With markets already pricing in an 85% chance of a rate cut at the September meeting, the tone and details within the minutes will be crucial. The last FOMC meeting saw a strong division among members, with the decision to hold rates steady hinging on strong jobs data—a data point that was later revised downward, fueling speculation about a potential shift in the Fed’s outlook.
The upcoming minutes offer the Fed an opportunity to clarify its stance, especially in light of the softer jobs numbers and mixed inflation signals. Traders will be watching closely for any signs that the Fed is becoming more dovish, which could reinforce expectations for a September cut, or for hints of caution that might temper those hopes. Ultimately, while Powell’s speech at Jackson Hole will set the broader policy tone, the FOMC minutes tonight may provide the first real clues about how the Fed is weighing recent economic developments and what that means for rate policy in the months ahead.
The market is more dovish than the Fed’s own projections, so any hawkish signals could prompt a repricing. Gold is inversely correlated with the dollar and Fed policy. If Powell is less dovish, gold could see downside, with key support at $3,270 and potential for a move down to $2,934 if the triangle pattern breaks lower. Upside targets, if the pattern breaks higher, are $3,773–$3,785, with a 66% statistical chance of reaching the measured move.
The current price action suggests a symmetrical triangle, which is a neutral pattern but slightly favours continuation of the prevailing trend (bullish in this case). Watch for a break of $3,270 for downside or a move above the triangle for upside momentum. RSI divergence and an ending wedge pattern hint at a possible reversal, so traders should stay alert for shifts following the FOMC minutes and Powell’s speech.
This content is not directed to residents of the EU or UK. Any opinions, news, research, analyses, prices or other information contained on this website is provided as general market commentary and does not constitute investment advice. ThinkMarkets will not accept liability for any loss or damage including, without limitation, to any loss of profit which may arise directly or indirectly from use of or reliance on such information.

Gold Breakout Ahead of FOMC – Next Step Trading PlanGold Breakout Ahead of FOMC – Key Levels & Trading Plan
Gold surged strongly in line with MMFLOW’s previous outlook, breaking through short-term resistances and the descending trendline within just one session. This early breakout ahead of the FOMC meeting signals that bullish momentum is firmly in play.
Even though price moved before the actual FOMC release, the market confirmed our directional bias: after clearing liquidity below, Gold quickly bounced back, reclaiming higher zones. With positive fundamentals supporting the metal in the long run, the bullish case for XAUUSD remains intact.
Currently, structure shows a clean breakout of the bearish channel, and we are waiting for a retest of KeyLevels today to fuel the next bullish leg.
📊 MMFLOW Market Outlook
Primary Bias: Bullish – Buy the dips
Scenarios:
🔹 Buy opportunities near strong support levels
🔹 Tactical sells only at confirmed resistance with rejection
Daily chart left a strong bullish confirmation candle, suggesting that pullbacks are opportunities to reload long positions.
🔥 Trading Plan – Buy/Sell Zones & Scalp Strategy
✅ BUY SCALP
Entry: 3333 – 3331
Stop Loss: 3327
Take Profit: 3338 – 3343 – 3348 – 3352 – 3356 – 3360 – ???
✅ BUY ZONE (Swing/Position)
Entry: 3316 – 3314
Stop Loss: 3310
Take Profit: 3320 – 3325 – 3330 – 3335 – 3340 – 3350 – 3360 – ???
🔻 SELL ZONE
Entry: 3368 – 3370
Stop Loss: 3375
Take Profit: 3364 – 3360 – 3355 – 3350 – 3345 – 3340 – 3330
📌 Key Levels to Watch
Supports: 3332 – 3323 – 3315
Resistances: 3348 – 3362 – 3370 – 3383
🚨 Risk Note:
If price dips too deep into 331x, beware of potential liquidity traps. Always respect your TP/SL as volatility remains high around FOMC events.
✨ MMFLOW Reminder:
👉 KeyLevels = Profits.
👉 Buy the dips, ride the bullish pump.

H4 GOLD BUY Gold Give A Bullish Fvg After Big Falling So We Are Expecting A Bullish Setup Also Its Filled The Below IFVG And Break The Buy Trendline So Now We Will Buy Now Targeting Previous High Lets Goo For It
FOLLOW US FOR MORE TRADES
TRADE IN DEPTH MARKET

XAUUSD/SELLAfter the release of the Federal Reserve minutes yesterday, gold prices rose to 3352 but didn't rise further. The minutes mentioned several key points, namely inflation and unemployment. Overall, the unemployment rate is more important than the inflation rate. Meanwhile, the renewed talks between Russia and Ukraine seemed uneventful, and the meeting went smoothly. As a result, gold prices fell again after the Asian market opened.
The current price is 3337, down approximately $15/ounce from 3352, indicating that upward pressure remains. During this pullback, we need to watch whether the decline can be halted around 3330-3335. If not, we need to wait for a lower level, around 3310. Today is Thursday. Focus on the impact of the initial jobless claims data on gold prices.
For trading, you can still refer to the current selling strategy. While waiting for a decline, confirm the presence of support below. Currently, there is no major news to boost gold prices. Remember to manage your trading risk. Set take-profit and stop-loss orders to prevent extreme market fluctuations from adversely affecting your account.

XAUUSD/BUYIt seems that bulls have seized a good opportunity. 3345 appears to have stabilized. Long positions can be more firmly established.
Buy at 3345, TP3360, SL3330

XAUUSD/BUYSure enough, gold prices rebounded after retreating to 3338, resulting in a short-term price increase of $8 per ounce.
The gold market is awaiting news to drive a rally. Just now, when it was about to hit 3350, it retreated. I interpret this as a tentative rise, as bulls are currently in control. This test is merely a test to see if bears will launch a counterattack. As expected, the bull-bear game is a tug-of-war. Both bulls and bears are now vying for the crucial 3345 level. This level serves as a short-term reversal point for the month. If bulls seize this level, the market will continue to rise. If bears seize this level, the market will experience short-term downward fluctuations.
In the latter half of the New York market, I believe the market will fluctuate within a range of approximately $10. The Swing Trading Center recommends continuing to buy.

GOLD H2 MAPPINGGold Taking Sell Sides Liquidity In Today Range So We Are Expecting Also The Below Liquidities
Then We Are Expecting A Bullish Rally Setup On Order Block A High Probability Setup With 90% Accuracy
So Lets Talk About Entry And Target , SL
ENTRY OB BOX AREA : 3300 , 3285
TP LEVELS 200 / 700 PIPS HOLD TARGET
SL AREA : 3267 , 3255
Manage Your Trade Properly And Follow Us For More Trades

Gold Recovers as Rate-Cut Hopes Strengthen📊 Market Summary:
• Gold (XAU/USD) rose slightly +0.5% to ~$3,350.55/oz, supported by growing expectations of Fed rate cuts and lower U.S. bond yields, which boosted safe-haven demand.
• However, easing geopolitical tensions have reduced strong safe-haven flows, putting mild pressure on gold.
📉 Technical Analysis:
• Resistance Levels:
• $3,400 – immediate resistance
• $3,420 – next key resistance if $3,400 is broken
• Support Levels:
• $3,330–$3,335 – strong support zone
• $3,310 – secondary support if $3,330 fails
• EMA & MAs: Price is holding above most short-term EMAs/MAs (MA5, MA10, MA20 → bullish; only MA200 remains bearish) → trend still bullish.
• Momentum Indicators: RSI ~62 (positive), Stoch & MACD remain bullish, ADX ~30 confirms a relatively strong trend.
📌 Outlook:
• Short-term: Gold could retest $3,400–$3,420 if dovish Fed signals and low yields persist.
• Risk: A hawkish Fed tone or easing geopolitical risks could drag gold back down toward $3,330 and possibly $3,310.
💡 Trade Strategy:
🔺 BUY XAU/USD: $3,330–$3,333
🎯 TP: 40/80/200 pips
❌ SL: $3327
🔻 SELL XAU/USD : $3,402–$3,405
🎯 TP: 40/80/200 pips
❌ SL: $3,408

XAUSUD: A large-scale buying opportunityGood morning, traders. Yesterday, I mentioned that the XAUUSD will initially decline after the Asian market opens. Our trading strategy of selling first and then buying has been effective and has shown some promising results. Gold prices hit a low of 3323 after the Asian session opened, a drop of approximately $12 per ounce. It then rebounded and is now trading at 3354. Long positions are continuing to profit. We await the target price of 3365. A new week, a new beginning. With the London session about to open, we'll have to wait and see whether it will push the XAUUSD to new heights.

Swing Trading OutlookThe market trend was flat over the weekend.
The prices of Bitcoin and Ethereum rose slightly before retreating slightly. There aren't any major market fluctuations.
We're still looking forward to next week's trends. Bitcoin is still in its bottoming phase. Periodic buying is a good option. The foreign exchange and futures markets will open in Asia on Monday. I'll be focusing on Wednesday's Federal Reserve interest rate decision. This is a key data point that will determine whether the US dollar rises or falls. It also serves as an important data point for our trading products.
My approach is to continue to sell at high levels before the interest rate decision. Then, monitor market sentiment. I'll focus on GOLD/XAUUSD, the two most impactful products. Secondly, the foreign exchange market. So, the strategy is: sell first, then buy next week. The subsequent buying will be determined based on the direction after the interest rate decision.
I hope everyone enjoyed this holiday. Maintain an optimistic and positive attitude when trading at all times. Once your mindset is affected, many things will be difficult to do, not just trading. Dear traders, see you next week.

Profitable 10-Minute Selling of GoldBased on the analysis in the previous article regarding the decline in gold prices, investors who followed the sell trend certainly made some profit. The drop was approximately $10 per ounce, and since it's Friday, this profit is quite positive. Market volatility is expected to be minimal as the market nears its closing. If you're serious about trading, consider buying at a low price.