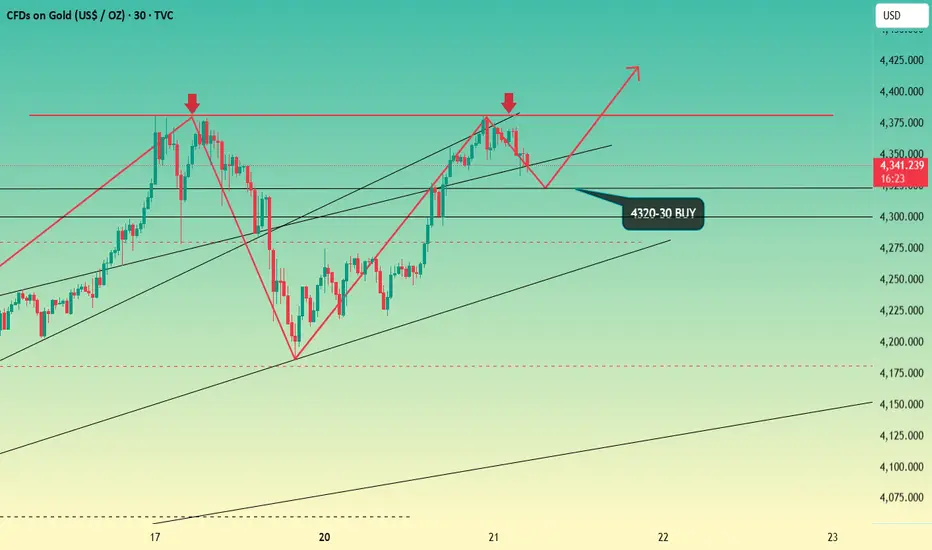
Gold bulls hit new highs, go long on dipsGold directly recovered Friday's losses and hit a new high yesterday, which undoubtedly reflects the strength of the bulls. As mentioned in my post yesterday, with the support level of 4218 held, the low points have been gradually moving up, and a breakthrough above 4280 was only a matter of time. After breaking through 4280, the price surged all the way to a high of 4381, before starting to decline slowly. The gold bulls have risen again, and the current correction ended in the form of a rapid adjustment, allowing gold to return to the bull market.
From a technical perspective, the short-term correction has been repaired, and the price has moved back above all major moving averages, indicating that the market has regained its strength. The 1-hour moving average is still diverging upward in a bullish trend, leaving room for further upside in gold. Additionally, factors such as the U.S. debt crisis, the U.S. dollar credibility crisis, risk-aversion sentiment, and the interest rate cut cycle are driving gold prices higher. As long as these issues are not resolved or mitigated, the escalating contradictions will inevitably push the price to rise further.
Today's Strategy: If gold pulls back to the range of 4320-4330, consider going long on gold appropriately and set up a stop-loss order for risk protection.
Goldlongterm
GOLD XAUUSD LONGTERM 1-3M CHARTСhart shows the long-term gold price structure from the 1970s to 2040s, highlighting the main resistance (red) and main trend support lines (green).
(RED) Main Resistance ZONE— every time the price reached this upper red channel, a major correction followed (marked by red arrows).
(GREEN) Main Trend Support Line — has consistently acted as a strong long-term foundation for price recoveries since 1970.
Gold is approaching the upper boundary, suggesting we may be entering a distribution phase similar to 1980 and 2011, unless a strong breakout confirms a new supercycle... ----->
------> Just like from March 2006 to July 2011, gold may continue rising while the RSI shows long-term bearish divergence.
If history repeats, we may see a final blow-off phase before another deep retracement toward the mid or lower trend levels.

Gold Price Outlook – Trade Setup (XAU/USD)🔹 Technical Structure
TVC:GOLD Gold has extended its rally above the $4,200 handle, testing the $4,240–$4,246 resistance zone highlighted on the chart. Momentum remains bullish in the short term, but price is facing rejection near the upper boundary.
Support Zone: $4,204 – $4,210 (marked in red/purple)
Resistance Zone: $4,240 – $4,246 (marked in yellow)
Current bias shows a potential pullback from resistance before another attempt higher.
The drawn projection suggests a corrective dip back into the support zone, followed by a renewed bullish wave toward resistance.
🔹 Trade Setup
Entry: $4,204 – $4,210 (on pullback into support zone)
Stop Loss: $4,202 (below key support structure)
Take Profit 1: $4,240 (resistance re-test)
Take Profit 2: $4,246+ (extension above resistance)
Risk–Reward (R:R): ≈ 1 : 3.92
🔹 Macro Background
Gold continues to trade at elevated levels, supported by strong safe-haven demand amid U.S.–China trade tensions and expectations of further Fed rate cuts. Market participants anticipate a 25bps cut at the October FOMC, with an additional cut in December and more in 2026. Fed Chair Powell’s comments on slower job growth reinforced dovish bets, lowering yields and boosting gold.
Additionally, the newly imposed U.S.–China port fees have increased geopolitical risk, pushing investors to hedge with gold.
🔹 Key Technical Levels
Resistance: $4,240 / $4,246
Support: $4,210 / $4,204 / $4,200
🔹 Trade Summary
Gold remains in a bullish trend but faces heavy resistance near $4,246. A pullback to the $4,210 support zone offers a potential buy-the-dip opportunity, targeting resistance re-tests. Macro fundamentals continue to favor gold’s upside, but near-term corrections are possible before another breakout attempt.
⚠️ Disclaimer
This analysis is for reference only and does not constitute trading advice. Trading involves significant risk, and proper risk management is essential.

GOLD Intraday Chart Update for 15 Oct 25GOOD Morning Traders,
As long as GOLD sustains above 4080 FMP Level it will remains bullish however the only way to join Trend Rally is following Psychological Levels with 3080 chain
Major Support zone for the day is located @ 4130-4150 below this zone GOLD will move Towards 4100 or even 4080
Above 4150 Psychological Level GOLD Next Target will be 4230 FMP Level or even 4250
Disclaimer: Forex is Risky

Monday's US gold market focus on short-term adjustmentsOn Friday, we emphasized the importance of the daily close. Gold's late-day rally on Friday disrupted the previous downward trend following the engulfing high. Instead, it continues to fluctuate along its short-term moving average, maintaining a relatively strong trend on the daily chart. On the 4-hour chart, gold has broken through the previous resistance band, and the K-line continues to maintain a relatively stable upward trend along the short-term moving average. In the short term, watch for a second upward pull after a pullback. On the hourly chart, after a series of small upward movements, the price is currently fluctuating in a narrow range at a high level. The current divergence in the short-term chart suggests that there may be room for adjustment in the short term. Keep an eye on this short-term correction.


Keep breaking new highs, is there any hope for short positions?Gold opened higher today, then retreated after hitting resistance at 3975. This trend mirrors recent trends: every rally is followed by a pullback. Even after breaking through resistance, the surge wasn't as strong as before, and the price has since fluctuated at a high level. This indicates that the current price is close to the market's target, in line with market expectations.
The recent rally was driven by news, and this seven-week rally hasn't seen a significant pullback. The risk of chasing the gains outweighs the reward, so we're primarily shorting at high levels.
The short positions we entered at 3962 and 3974 have been closed with profit taking near 3960. We will keep an eye on the pressure at 3975 above and will choose the right time to act depending on the breakthrough situation.
Resistance levels: 3975, 3995
Support levels: 3930, 3900
For specific trading decisions, please follow my live updates. I update my trading ideas and strategies daily. If you don't have a plan or strategy for gold trading and can't achieve consistent and stable profits, you can refer to and follow my updates for guidance and help avoid mistakes.

Gold → Continuously hitting new highs, where will the bears go?After today's sharp opening, we shorted gold at 3946. After repeated testing of support at 3930, we took profit. Currently, gold continues to strengthen due to a variety of factors, including the US government shutdown, interest rate cuts, and geopolitical factors. However, the risks of chasing the price higher at this level outweigh the rewards. Gold has seen seven consecutive weeks of strong gains without a single pullback. If a pullback occurs, it would likely start at $100.
On the hourly chart, intraday pullbacks were mild and sustained, with the K-line chart maintaining a relatively strong trend along the short-term moving average. Smaller timeframes exhibited some divergence. Moreover, after gold fell back to 3930 and broke through the resistance level of 3950, it did not rise as much as before, which means that the current position is close to market expectations, and the bullish momentum is not as strong as before. We will continue to consider shorting gold on rallies in the evening.
Resistance levels: 3975, 3995
Support levels: 3930, 3900
For detailed trading decisions, please follow my real-time updates. I will update my trading ideas and strategies daily. If you don’t have a plan or idea about gold trading and cannot achieve sustained and stable profits, you can refer to and follow my updated content as a reference and guidance to help you avoid mistakes.
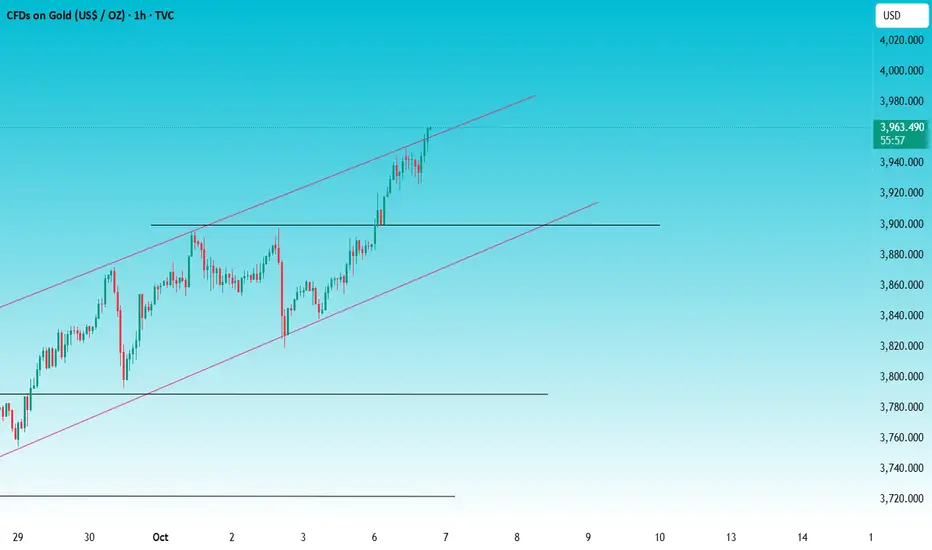
You can buy short orders on reboundWe began warning this morning that gold is about to start fluctuating. Shorting at short-term rebound highs is recommended. We've already achieved good returns by going short directly in the European session.
Gold's 1-hour chart shows the formation of a double top. It has now fallen below 3853 and is testing the initial support level of the uptrend. If this level is broken, it will fall further and test the support levels of 3810-3800. Continue shorting during a rebound in the New York market.
Resistance levels: 3853, 3972
Support levels: 3824, 3812
For specific trading decisions, please follow my live updates. I will update my trading ideas and strategies daily. If you don't have a plan or strategy for gold trading and are struggling to achieve consistent profits, you can refer to and follow my updates for guidance and help you avoid mistakes.

Gold → May rise and then fallToday's day is in a state of slow upward fluctuation, but the short-term bullish performance is not strong. Yesterday's daily line closed with an inverted line. Today, we can see a decline based on the high point of 3895. In the New York market, gold may rise and then fall. The support below is 3862-3852, and the strong support is 3828 to see the rise! If it unexpectedly breaks above 3895, consider going long with a small position!
Resistance levels: 3895, 3925
Support levels: 3853, 3828
For specific trading decisions, please follow my live updates. I update my trading ideas and strategies daily. If you don't have a plan or strategy for gold trading and are struggling to achieve consistent profits, you can refer to and follow my updates for guidance and help avoid mistakes.

XAUUSD: Seeking new highsOANDA:XAUUSD has rebounded sharply back to the prior highs after a correction from 3871 to 3795. With no clear loss of upside momentum, this looks like a classic shakeout before another push higher. For today’s session, the plan is to keep looking for longs , with a primary objective at 3915.
You can read my previous analysis here:
Price is currently meeting resistance at with notable selling pressure, a dip into support may precede the next leg up.
The 3915 area is a logical upside magnet, where CME participants reportedly hold sizeable long-call exposure—a level price may aim to tag.
Key resistance: .
Key support: , .
Trading Plan
Buy setup: Look for Quantum Vol-Delta confirmation of buying pressure on lower timeframes (5m) as price pulls back into .
Contingency: Watch 3836 (POC session/daily liquidity) . Price may sweep this level and rebound.
Please like and comment below to support our traders. Your reactions motivate us to produce more analysis in the future 🙏✨
Victor Dan @ ZuperView

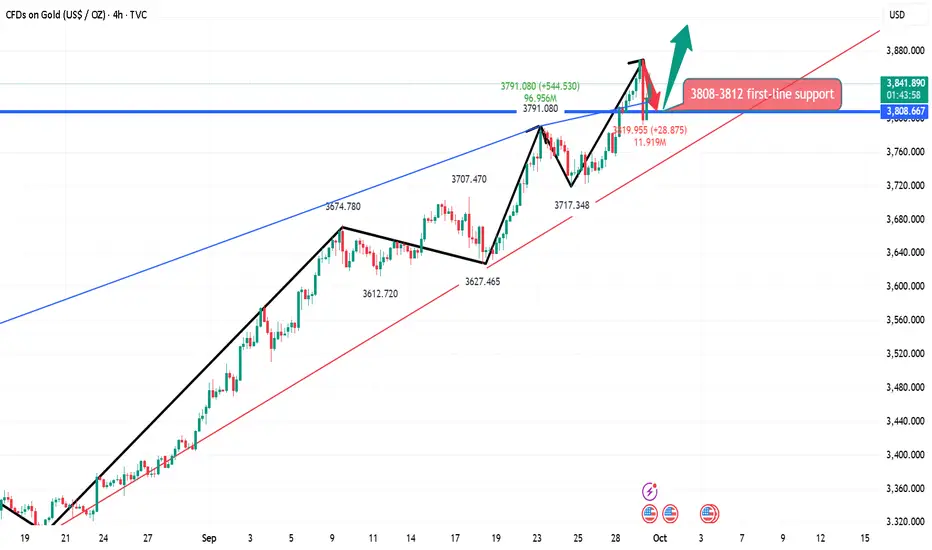
Gold fell as expected, and subsequent pullbacks led to long posiBased on the 4-hour analysis, support is focused on the 3800-95 level. The bulls are rising strongly and there's no end in sight. Trading strategies should primarily focus on buying on pullbacks. In the intermediate range, be cautious and wait for key entry points. I'll provide detailed trading strategies during the trading session, so please stay tuned.
Gold Trading Strategies:
1. Buy gold at the 3800-05 level, and add to your long position on pullbacks to the 3785-90 level. Set a stop loss at 3778 and target the 3845-3850 level.
9.30 Gold continues to hit new highsThe gold market continued to rise yesterday. It opened at 3759.9 in the morning and then fell back. The daily low was 3756.3 and then the market fluctuated and rose strongly. The daily high touched the daily high of 3834.2 and then consolidated. The daily line finally closed at 3833.9. The daily line closed with a saturated large bullish candle with a slight shadow. After ending this pattern, today's market retraced to more levels. In terms of points, the long positions at 3325 and 3322 below and the long positions at 3368-3370 last week and the long positions at 3377, 3385 and 3563 were reduced and the stop loss was followed up at 3650. Today's long positions at 3805 are conservative at 3802, and the stop loss is 3798. The target is 3838, 3845 and 3852-3855 pressure.
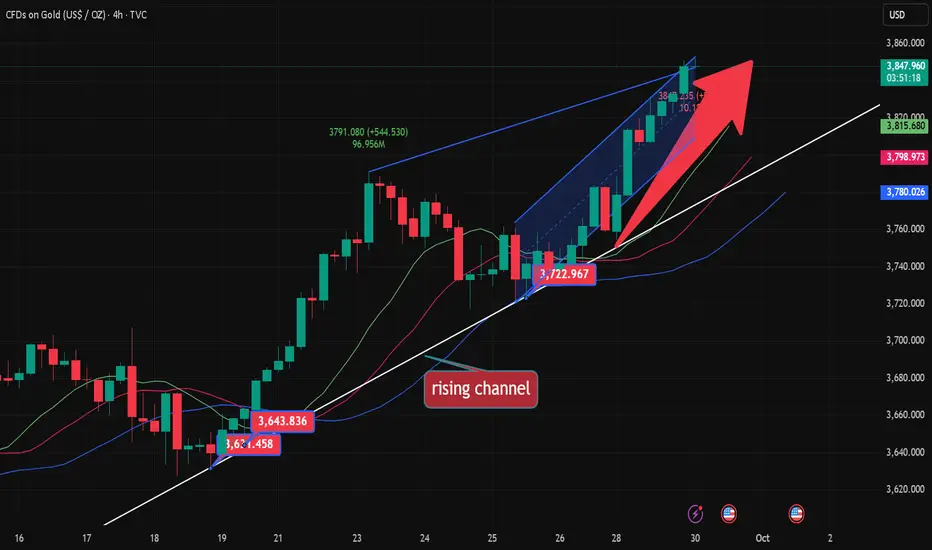
9.30 Gold New High Technical Analysis!!!Technical Analysis:
From a 4-hour perspective, short-term support is seen at 3800-05, with key support remaining around 3785-90. Short-term resistance is seen at 3830-35. Trading strategies should prioritize buying on dips. In the interim, caution is advised with caution when buying, patiently waiting for key entry points.

9.29 Gold price hits a new highOn the hourly chart, gold successfully broke through the $3,700 mark last week and continued its strong performance by breaking through $3,800 on Monday. For support, the $3,800 mark is a key level. Gold prices surged higher this morning, and after a breakout, prices continued to rise. For upward pressure, the intraday high, also a historical high, at $3,819 is also near the upper limit of the daily Bollinger Band. If gold prices stabilize at $3,800 and reach new all-time highs, the upward trend is expected, with no predictions of a top. The 5-day moving average and the MACD indicator are forming a golden cross, while the KDJ and RSI indicators are forming a golden cross in overbought territory. Short-term technical indicators suggest that bulls maintain their advantage.

5 Mistakes Even Veteran Traders Make!Whether you're new or experienced, you can still fall into these 5 DEADLY mistakes. I'm here to point them out!
Mistake #1: Not understanding what you’re trading.
You’re trading forex, right? But do you know what pips or lots are? How currency pairs move? Or how news impacts them? Too many people dive in just because they see others profiting, without knowing what they’re betting on. That’s the difference between investing and gambling.
Don’t jump into the ocean without knowing what’s underwater.
Mistake #2: Not managing your money.
Most traders obsess over making money but forget how to protect it. It’s human nature—everyone wants fast cash! But if you trade big without control, one bad move can wipe out a month or even a year’s gains. Remember, keeping your capital safe is priority number one; profits come as a result.
As long as you’ve got the forest, you won’t run out of firewood.
Mistake #3: No clear trading plan.
Are you entering trades based on feelings? Exiting because of a “hunch”? That’s not trading—it’s playing the lottery! A trading plan is your compass, your map to stay on track. It needs clear entry points, stop-loss levels, and profit targets. Most importantly, you MUST stick to it!
Sticking to strategy doesn't make us invincible, but it can help us retreat safely.
Mistake #4: FOMO – Fear of Missing Out!
You see prices soaring and chase them, or you copy someone’s trade because they’re showing off profits. Then, when you lose, you blame the market or some “expert,” forgetting it was YOUR choice to trade. Drop this habit! Stop following the crowd and own your trading decisions.
You can’t live by envying someone else’s wallet.
Mistake #5: Trading addiction and chasing short-term wins.
Win one trade, and you want more. Lose one, and you want to “get even” with the market. This traps you in a cycle of overtrading and rash decisions. Profits don’t come from trading a lot—they come from trading RIGHT.
Don’t let emotions take over. Remember, When emotions rise, logic falls.
These 5 mistakes can burn all your money, no matter how much you have. Be honest with yourself and learn from them. I believe if you avoid these traps and stay disciplined, the door to success will open wide.
I’m Anfibo, just sharing what I know about finance.

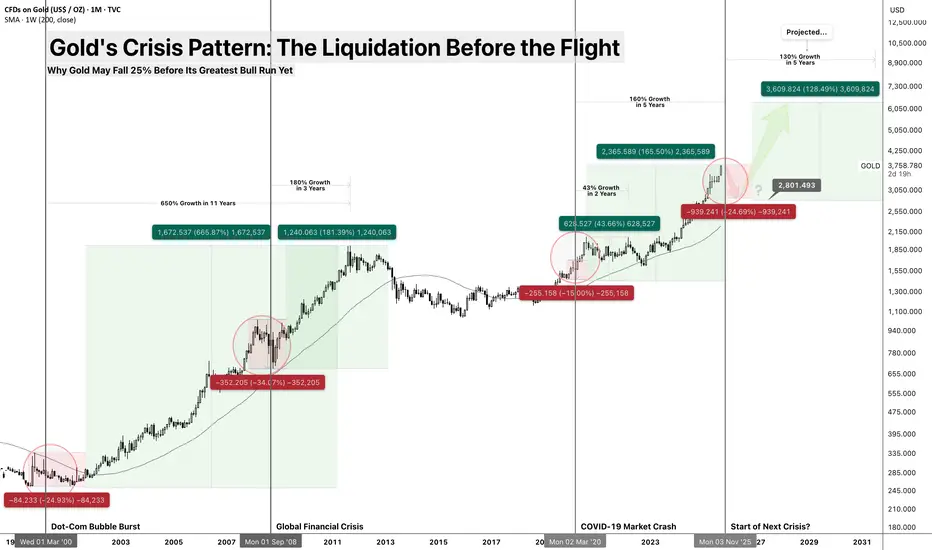
Gold's Crisis Pattern: The Liquidation Before the Flight TVC:GOLD Crisis Pattern: The Liquidation Before the Flight
Why Gold May Fall 25% Before Its Greatest Bull Run Yet
While everyone expects gold to rally during the next crisis, history suggests something different: gold gets sold first, bought later. At $3,790, FX:XAUUSD may be setting up for its most painful - and ultimately profitable - cycle yet.
Think of TVC:GOLD like a life preserver on a sinking ship. When panic first strikes, people throw everything overboard to stay afloat - even their life preservers. Only when they're drowning do they realize what they really need.
The Crisis Liquidation Pattern
2000 Dot-Com Crisis:
Pre-crisis peak: $326
Initial drop: -21%
Crisis bottom: $255
Ultimate recovery: +650% over 11 years
2008 Financial Crisis:
Pre-crisis peak: $1,033
Initial drop: -34%
Crisis bottom: $680
Ultimate recovery: +180% over 3 years
2020 COVID Pandemic:
Pre-pandemic peak: $1,696
Initial drop: -15%
Bottom-to-recovery: +43% over 2 years, +160% over 5 years
Key Distinction: Some will point to 2020, when TVC:GOLD rallied during the COVID crash. But that was a unique exogenous shock - the selloff lasted only weeks before unprecedented stimulus and collapsing real yields drove gold to new highs. In contrast, financial-system crises like 2000 and 2008 forced TVC:GOLD into year-long corrections before its hedge role reasserted. The 2025 setup looks far closer to those financial crises than to 2020's pandemic shock.
2025 Projection:
Current peak: $3,790 (I think top already - might be wrong ) ✓
Expected initial drop: -20 to -25%
Target bottom: $2,800-3,000
Long-term recovery target: $6,500+ by 2030
Why VELOCITY:GOLD Falls During Liquidity Crises?
The Margin Call Cascade
When leveraged positions blow up, investors sell what they can, not what they want to. TVC:GOLD , being liquid and unencumbered, becomes emergency cash.
The Three-Phase Liquidation:
Phase 1: "This is just a correction" - Hold everything
Phase 2: "I need cash now" - Sell winners (including gold)
Phase 3: "The system is broken" - Buy gold as currency hedge
Think of it like a house fire: you don't grab the fire extinguisher first, you grab your wallet. Only after you're safe do you wish you'd saved the fire extinguisher.
What Makes 2025 Different?
Unprecedented Starting Point
CAPITALCOM:GOLD at all-time highs vs. GDP ✓
Central bank buying at record levels
Retail ownership through ETFs at maximum
More holders means more potential sellers
The AI Deflation/Monetary Inflation Paradox
AI driving productivity gains (deflationary)
Debt levels requiring monetary expansion (inflationary)
Gold benefits from the monetary side, but falls in initial deflationary shock
Geopolitical MCX:GOLD1! Demand vs. Financial Selling
Central banks want VELOCITY:GOLD for de-dollarization
But financial stress forces private selling first
Result: Temporary oversupply before structural shortage
The Crisis Timeline for Gold
Stage 1: The Setup (Now - Q4 2025)
CMCMARKETS:GOLDZ2025 Price Action: Sideways to slight decline
Strong dollar pressure
Real yields rising with Fed cuts
Still viewed as "risk asset" by algorithms
Target Range: $3,400-3,600
Stage 2: The Liquidation (Q4 2025 - Q2 2026) TVC:GOLD Action: Sharp 20-25% decline
Forced selling from leveraged funds
ETF redemptions as retail panics
Dollar TVC:DXY strength peaks
Target Bottom: $2,800-3,000
Stage 3: The Recognition (Q2 2026 - Beyond) TVC:GOLD Action: New bull market begins
Currency debasement fears return
Physical shortage becomes apparent
Central bank buying accelerates
Ultimate Target: $6,500+ by 2030
Key Indicators to Watch
Immediate Danger Signals:
TVC:GOLDSILVER ratio above 90(April 2025 100+) (currently 84 - expect further decline) ✓
Dollar Index TVC:DXY climbs higher towards 110
TVC:US10Y 10-year real yields above 4% (currently 4.17%)✓
Crisis Confirmation:
TVC:GOLD falls below $3,200 on volume
Mining stocks crash 40%+
Central bank buying announcements increase
Physical premiums start expanding
Recovery Signals:
Dollar TVC:DXY weakening below 105
Fed pivots to QE
Inflation expectations rising
TVC:GOLDSILVER Gold/Silver ratio normalizing
The Bigger Picture: Why This Sets Up Gold's Greatest Run
Structural Drivers Post-Crisis:
Debt Monetization: $30+ trillion deficits requiring QE
Currency Competition: Digital currencies vs. physical gold
Supply Constraints: Peak gold production reached
Generational Shift: Millennials discovering gold after getting burned in "everything bubble"
Historical Precedent:
After every major financial crisis, gold enters its strongest bull market:
Post-1971: +2,300% over 9 years
Post-1999: +650% over 11 years
Post-2008: +180% over 3 years
Post-2025: Targeting +150-200% over 5-7 years
Risk Management
This Analysis Fails If:
Fed pivots to massive QE immediately (before crisis)
Fiscal stimulus exceeds $3 trillion rapidly
Dollar collapses before financial crisis hits
War/geopolitical crisis becomes primary driver
Probability Assessment:
65%: VELOCITY:GOLD falls to $2,800-3,200 range before rallying
25%: TVC:GOLD holds above $3,400 and rallies immediately
10%: CMCMARKETS:GOLDZ2025 crashes below $2,500 in systemic crisis
Conclusion: The Pain Before the Gain
TVC:GOLD 's crisis pattern is counterintuitive but consistent: liquidation before allocation. The coming correction may be the last chance to accumulate gold before its transition from investment to monetary asset.
Like Warren Buffett said: "Be greedy when others are fearful." When gold is getting panic-sold alongside everything else, that's when the foundation for the next great bull market gets built.
The fire sale is coming. Are you prepared to buy?
Disclaimer: This analysis is for educational purposes only and should not be considered financial advice. Past performance does not guarantee future results. Always conduct your own research and consult with financial professionals before making investment decisions.
Gold - Sell around 3750, target 3720-3700.Gold Market Analysis:
We sold at 3742 in today's Asian session and have already made a profit. Gold is no longer in a one-sided rally and has begun a major correction. We need to follow the trend and trade at the right pace. We are now entering a major trend. The most common questions we receive are: has a major decline begun? Has gold peaked? The daily chart closed with a negative candle yesterday, and the previous trading day also formed a vague tombstone candlestick pattern. At this point, we can only confirm short-term resistance, but we cannot confirm that the overall trend has peaked or that the weekly chart is bullish. Furthermore, the short-term correction has not yet disrupted the bullish trend in the 4H. Today, we will focus on gains and losses at 3700. A break of this level will trigger a sell signal on both the 4H and daily charts. Strong support in the 4H is around 3717. This level is supported by the 30-day moving average and also serves as a support pattern. Remember, the low point of a major pullback was around 3712? The reason why it rebounded so quickly yesterday was because it hit strong 4H support. Gold is unlikely to decline directly today. I predict a correction first, and then a rebound near 3717. If it breaks, watch out for large buys, as this could signal another surge.
Resistance levels are 3751 and 3763, with strong resistance at 3773. Support levels are 3700 and 3717. The dividing line between strength and weakness is 3751.
Fundamental Analysis:
Gold surged and then retreated. The US dollar rebounded sharply after hitting a bottom. No major market data was released, and the Fed's policy action had no sustained impact on the market in the short term.
Trading Recommendation:
Gold - Sell around 3750, target 3720-3700.

XAU/USD(20250923) Today's AnalysisMarket News:
Federal Reserve Chairman Bostic: There is currently little reason to cut interest rates further, and only one rate cut is expected this year. Musallem: There is limited room for further rate cuts. If inflation risks increase, further rate cuts will not be supported. Hammak: We should be very cautious when lifting policy restrictions. My estimate of the neutral interest rate is on the higher side. Milan: I believe the appropriate interest rate is in the mid-2% range. I do not support adjusting the 2% inflation target at this time.
Technical Analysis:
Today's Buy/Sell Levels:
3726
Support and Resistance Levels:
3790
3766
3751
3701
3685
3661
Trading Strategy:
If the price breaks above 3751, consider buying, with the first target at 3766.
If the price breaks below 3726, consider selling, with the first target at 3701.

Analysis of gold price intraday trend!Market News:
In early Asian trading on Monday (September 22nd), spot gold prices saw slight fluctuations and are currently trading at $3,690 per ounce. Last week, after the Federal Reserve unanimously announced its first interest rate cut of the year on Wednesday as expected, the London gold price quickly broke through a record high of $3,700. The ongoing Middle East crisis and the Russo-Ukrainian conflict, now entering its third year, are also supporting gold's upward trend. This rally, which has lasted five consecutive weeks, is primarily driven by three factors: first, the market firmly expects the Federal Reserve to continue cutting interest rates in the second half of this year and even into 2026; second, the ongoing instability in the Middle East and the ongoing Russo-Ukrainian conflict; and third, the continued weakening of the US dollar. Although it rebounded slightly after the Fed's decision, it remains generally weak. The "sell on good news" principle seems to be reassuring. Looking ahead to this week, the market will be expecting a series of key data releases, including the September PMIs for the US, Japan, and Europe on Tuesday, the final US second-quarter GDP and durable goods orders on Thursday, the US PCE inflation report on Friday, and speeches by several Fed officials, particularly the views of new Fed member Milan. These data will directly impact the probability of a Fed rate cut in October, currently priced at 91.9%.
Technical Analysis:
Gold's daily chart showed a correction with consecutive declines. The New York closing price fell below the 10/7-day moving averages, with gold and the US dollar moving in lockstep. Friday's sharp rise saw a strong close in late trading, with the daily chart closing strongly positive. The New York closing price once again crossed above the 103660 MA, and the 7/5-day moving averages remained upward. Technically, the four-hour and hourly charts show gold prices re-entering the upper Bollinger Bands, with the moving averages forming a golden cross and opening upward, and the RSI indicator trading above its mid-axis. Early trading on weekly pullbacks is primarily for buying low, with selling high as a secondary consideration.
Trading strategy:
Short-term gold long at 3672-3675, stop loss at 3663, target at 3700-3720;
Short-term gold short at 3727-3730, stop loss at 3739, target at 3690-3670;
Key points:
First support level: 3675, second support level: 3662, third support level: 3646
First resistance level: 3703, second resistance level: 3716, third resistance level: 3728

XAU/USD(20250922) Today's AnalysisMarket News:
Federal Reserve Board Governor Milan: Expects continued rate cuts in the coming months and will work to convince other policymakers to cut more quickly; Minneapolis Fed President Neel Kashkari: Two more rate cuts this year would be appropriate.
Technical Analysis:
Today's Buy/Sell Levels:
3667
Support/Resistance Levels:
3719
3700
3687
3647
3634
3614
Trading Strategy:
If the price breaks above 3687, consider entering a buy/sell position, with the first target at 3700.
If the price breaks below 3667, consider entering a sell position, with the first target at 3647.

Strategic Long-Term Perspective on GoldGold has delivered a strong bullish cycle after weeks of accumulation. The past phase showed a contracting range where liquidity was built up and multiple structural shifts occurred, signaling preparation for expansion. Once price broke out of that range in late August, momentum accelerated, leading to a clean and sustained rally into September.
The recent move highlights how market flow continues to favor the upside, with each correction acting as a re-accumulation zone rather than a trend reversal. Institutional order flow remains visible, supporting higher valuations as price respects bullish market structure.
Currently, gold is stabilizing after the sharp leg upward. This pause suggests a phase of healthy consolidation, likely absorbing liquidity before attempting the next impulsive wave higher. Overall sentiment remains constructive, with bullish continuation the dominant narrative unless a major structural shift occurs.

Has gold reached its peak?The Federal Reserve's meeting met expectations with a 25 basis point interest rate cut, which did not significantly stimulate the market.
Meanwhile, the market expects two more rate cuts in November and December this year. Gold briefly surged lower before retreating sharply. Is this a top or a normal correction in the bull market? The key to judging whether a market trend has ended is to look at the strength of the pullback.
From a technical perspective, the price of gold has fallen below the 5-day moving average and is currently between the 5-day moving average and the 10-day moving average. The focus below is on the support formed by the 10-day moving average. The support level is currently in the 3645-3640 range, and this range is also yesterday's low point. Gold's ability to hold above the 10-day moving average remains to be seen. If it holds, it is expected to continue its upward trend. Focus on the 3680 first-line pressure level. If it breaks through this pressure, gold is expected to hit above 3700 again. A break below 3645 could lead to further declines to the 3620-3600 range.
