Gold Bullish Setup Targeting New ATHThis XAU/USD 1-hour chart shows gold trading around 4039 with a bullish setup. Price is respecting the support trend line, confirming upward momentum. Key support is marked near 4001, providing a strong base for buyers.
The chart highlights the previous ATH at 4060 and projects a potential breakout towards a new all-time high at 4115. The structure suggests a possible short-term pullback to retest support before continuing higher. As long as the trend line holds, the bias remains bullish with upside targets at 4058, 4087, and finally 4115.
Goldman

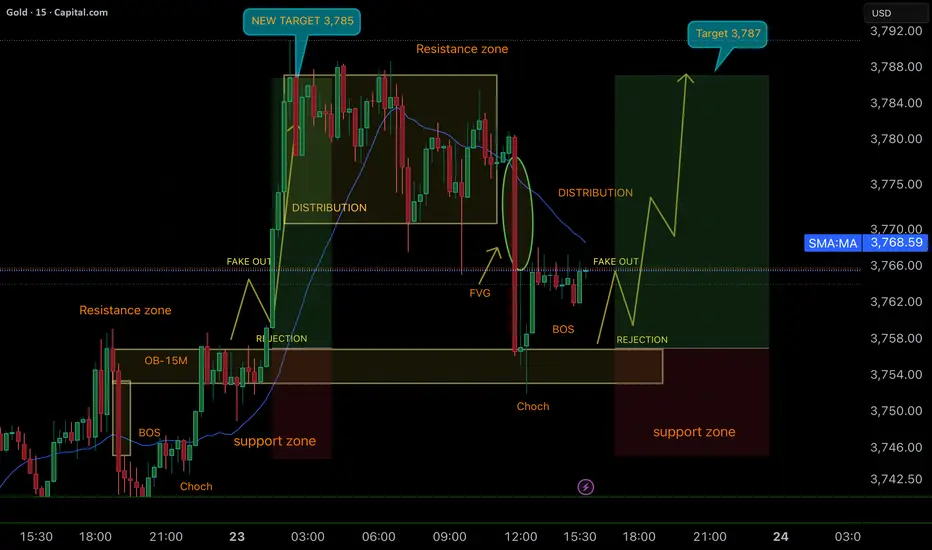
SMART MONEY CONCEPT (SMC)📊 Bullish SMC Analysis – GOLD
1. Liquidity Grab (Stop Loss Hunt)
The market retraced back into the support zone, sweeping the liquidity and clearing out the stop losses left below.
2. Break of Structure (BOS)
After the liquidity grab, a BOS confirms bullish continuation.
3. Fair Value Gap (FVG)
The retracement aligns with an FVG, strengthening the bullish continuation setup.
4. Rejection Entry
The rejection off support gives the perfect signal for buyers to step back in.
5. Target 3,787 🎯
With institutions collecting liquidity and confirming direction, the next HH is projected toward 3,787.
✅ Conclusion: This is a textbook example of liquidity engineering — sweep the lows, confirm BOS, and continue the bullish leg. Clean setup with high probability.
Gold breaks through strongly, seizing opportunities is the key!Gold continued its strong rally from last week yesterday, hitting new all-time highs, reaching a high near 3759, sending the market into a frenzy once again. Since its initial rise from 3311, the overall gain has reached nearly $450, a rare and impressive rise in recent years. However, amidst this upward trend, market sentiment is inevitably wary of rising prices.
From a technical perspective, bulls still have upward momentum, but a reversal could lead to a significant pullback. The previous pullback did not reach key support, so the correction remains limited. Short-term pressure is focused on the 3760 area, which is crucial for further gains in the European session. If the European session lacks momentum, the probability of new highs in the US session will decrease. Support below this level is around 3730, with the watershed still near 3700. A break below 3700 would signal the end of the bull market.
Therefore, for intraday trading, it is advisable to try to position yourself based on the initial top. While there are certain risks, the potential for blindly chasing long positions at this level is already limited. It is recommended that if gold touches around 3760-3765, you can consider placing short orders at the right time, and first look at the retracement space below.

Gold fluctuations are under your control!After the gold interest rate decision, it went as we expected. Shorting near 3672, it first fell, and then going long near 3630 was bullish. The profit from this round trip was quite large.
First of all, looking at the current overall background, although the Fed has implemented an interest rate cut, the message it conveys is far from purely dovish. Powell's speech suggested that this action is not the beginning of a radical easing policy, but a prudent move to deal with economic uncertainty, especially the weakening labor market and stubborn inflation. According to data released by the U.S. Department of Labor on Thursday, the number of first-time applications for unemployment benefits in the United States in the week ending September 13 was 231,000, which was expected to be 240,000 and the previous value was 263,000. The data fell sharply from the abnormally high level of the previous week and returned to the normal range in the past four years.
From the perspective of gold technology, the 3670-3685 area can be regarded as the second top of the medium term. The bearish trend is established in the medium term first, and adjustments are made in conjunction with the overall short-term operation, with the main short position and the auxiliary long position. This rebound is regarded as a 4-hour adjustment to accumulate momentum and break through to open up more space. A weak closing can continue to be weak based on low consolidation. Missing the good position near 3670 does not mean that there is no position to participate in shorting. You can give yourself 1-2 times of tolerance in the face of the trend. As long as the direction is grasped, the final result will be profitable. This is very important.

GOLD COME BACK BULLISH TREND AROUND 3660 - 3690 📊 Previous Trend
Price showed strong bullish momentum, forming a BOS around 3660 – 3690, confirming bullish structure.
📊 Reversal Signals
After tapping the 3690 – 3700 zone, a strong rejection candle appeared with heavy selling pressure → clear sign of price rejection at highs.
A bearish FVG formed at 3670 – 3675, suggesting further downside correction.
Price is currently retesting this FVG and showing bearish reaction.

Gold continues to fluctuate before the US interest rate decisionGold, after last Friday's continuation of the previous day's bottoming out and rebound, continued to fall into a range-bound oscillation mode, and after opening today, it continued to retreat to around 3626 before rising. Although there is no breakthrough between the bulls and bears at present, it is still in a tug-of-war, and the support below will also be maintained near the low point of 3626. This position is also the first watershed related to whether gold can continue to fall in the later period. The key pressure above is maintained near the previous secondary high point of 3655. This position is also the key suppression point for the recent retracement after multiple touches. It is also the shoulder position of the head and shoulders top, which also plays a role. It plays a connecting role, and once this position continues to suppress, gold may be under pressure again in the later period. If it does not break through again this week, gold may retreat again next week to test the support level of 3610. Although the daily line is still in a high sideways trend, the upward momentum has also declined significantly. If it bottoms out and rebounds, it needs a secondary definition of the European session, which is also an advance forecast of the US session. If gold rebounds to 3645-3655 during the day, short it and target around 3630-20. The strength of the European session may also determine the direction of the US session.

Can gold continue to rise next week?With the right direction, the journey is not a problem. Time will prove your strength, and strength will win the future. Let trust become profit. The market is ever-changing, and following the trend is the best path. When the trend emerges, act accordingly; don't buy against the tide.
Gold had a relatively perfect week. After a slight pullback on Friday, it rose again. It found resistance around 3656-60 before oscillating and stalling. This level serves as a bridge between the past and the future. Next week's interest rate decision will be a key focus, and both market news and technical indicators are bullish for gold. Let's wait and see. If your current trading is not ideal, I hope I can help you avoid mistakes.
From the 4-hour analysis, the support below is 3628-30, and the short-term bullish strong dividing line is 3600. If the daily level stabilizes above this position, it can continue to maintain the rhythm of pulling back to low and buying in line with the bullish trend. The main strategy is to buy on dips.
I will remind you of the specific operation strategy during the trading session, so please pay attention to it in time.

Next week's Fed decision,Has the gold bull market peaked?Let's take a look at the trend of gold this week at the weekend. The strong bull market of gold has slowed down this week. After continuing to rise to 3600 on Monday, it rose and fell to a peak of 3675 on Tuesday. From Wednesday to Friday, it fluctuated at a high level. So, does gold still have the motivation to continue to rise in the current situation? Or is 3675 the ceiling? This recent surge in gold prices began at 3311, reaching a high of $364 at 3675. Based on previous upward trends, a bull market typically peaks just over $400. Therefore, with limited room above 3700, blind buying is discouraged. Be wary of a potential reversal of price action after reaching the peak, with the upper limit at 3750. All of this depends on the Federal Reserve's interest rate decision next week. The market will become increasingly cautious as we approach this date. Therefore, gold is currently adjusting at a high level, just shy of a final acceleration towards the top. The uncertainty remains as to whether this acceleration will occur before or after the Fed's decision. If the rate cut is just 25 basis points, gold will have no further momentum to rally. Buying on expectations and selling on facts will lead to a peak and decline upon the announcement. However, if the rate cut is aggressively implemented by 50 basis points, gold will likely experience further upward momentum, most likely leading to a decline after a sharp rise. Therefore, gold is currently in a tailspin. At the end of the bull run, it's best to be bullish rather than chasing the market. It's prudent to wait for a pullback at key support levels before resuming a bullish trend. Two key support levels to watch are 3580 and 3511-3512. Having already seen four consecutive weekly gains, there's a high probability of a negative correction next week. Even if gold does rally next week, it will be the final stretch. The world's largest gold ETF has been steadily reducing its holdings in recent days, with bulls gradually taking profits. We shouldn't be tempted to buy at high levels, especially for medium- and long-term investors. It's important to emphasize that the overall trend and direction of gold remains upward, directly linked to the weakening US dollar. However, market trends aren't linear. After each bullish cycle, there's a deep correction, and this cycle repeats. This is how trends form. See if this pattern persists. Trading, then, is a process of finding the right position, following the trend and the swings. A cost-effective position gives you the confidence to hold onto your position without panic. For gold on Monday, expect continued volatility. Upper pressure lies between 3655 and 3660. A breakout would undoubtedly trigger a test of the 3675 high, leading to a potential surge and then a decline. Whether it can reach 3700 depends on the strength of the market, but I don't think the probability is high, at least for Monday. Lower support lies between 3635 and 3630, the 618 golden ratio. A break below would signal a short-term bearish bias, potentially leading to further declines to the 3610-3600 support levels.

Only by understanding the trend can you be firmly bullish.The market is changing rapidly, and going with the flow is the best way to go. When the trend comes, just go for it. Don't buy at the bottom against the trend, so as not to suffer. Remember not to act on impulse when trading. The market is good at dealing with all kinds of dissatisfaction, so you must not hold on to orders. I believe many people have experienced this. The more you resist, the more panic you will feel, and the floating losses will continue to magnify. You will not be able to eat or sleep well, and you will miss many opportunities in vain. If you also have these troubles, then you might as well follow Tian Haoyang's rhythm and try to see if it can make you suddenly enlightened. If you need help, I will always be here, but if you don't even extend your hand, how can I help you?
Gold rose unilaterally after the positive non-farm payrolls on Friday, hitting a new high this week. This week's K-line closed in a hammer shape, and the gold hourly line has a double bottom structure. However, gold should not have such a big retracement for the time being. The 3335-3330 line below is also an important support. So gold will mainly be bought on dips above 3335-3330 next week. Technically, there is still room for growth next week. The bulls continued to attack at the end of Friday and closed at 3363. Next week, we will continue to pay attention to the short-term suppression at the 3370-3375 line above. In terms of operations, we will continue to maintain retracement and buy. If your current operation is not ideal, I hope I can help you avoid detours in your investment. Welcome to communicate and exchange. Judging from the current gold trend, the short-term resistance above next week will be around 3370-3375, with a focus on the important pressure line of 3395-3400. Keep buying on pullbacks, and try to maintain a stable wait-and-see position in the middle. I will prompt the specific operation strategy at the bottom, so please pay attention in time.
Gold operation strategy: Go long on gold when it retraces to around 3340-3330, target 3370-3375, and continue to hold if it breaks through.

Gold updateAfter the previous level was broken and structure shifted, we’re now entering a new phase of analysis.
In this fresh setup, we’re looking for buy opportunities — but not blindly!
As always, waiting for a clean pullback to the new zone and a solid entry signal.
Experience teaches us: real profits come from patience and planning.
Here’s my new gold analysis — high probability, low risk.
For detailed entry points, trade management, and high-probability setups, follow the channel:
ForexCSP

Although the market fluctuates, the rhythm is not chaotic.Today's public strategy suggested shorting gold at 3365, and accurately predicted the retracement of the resistance level again. The brothers who followed up again reaped good rewards. Then arranged long orders in the 3344-3345 range, and exited the market at 3360 after the market fell and rebounded; then arranged short orders at 3360-3361, and fell again under pressure, and successfully took profits at the target of 3350. Although the short-term fluctuations were large, we finally managed to grasp the rhythm steadily and reaped ideal profits.
Judging from the current trend, as long as the short-term gold market is above 3330, gold will still be in a strong bullish trend. On the contrary, if it falls below the closing line near 3330, it will break the trend line, and the subsequent market will most likely form a weak shock pattern. Therefore, the current operation is actually very simple. As long as the 3330 position is not broken, you can rely on the 3330 area to enter the market and do more. Pay attention to the support near yesterday's low point of 3333 below, and pay attention to the resistance near 3380-3390 above.
Gold operation suggestions: It is recommended to short gold with a light position near 3380-3385, with a target of 3370-3360, and go long near 3345-3350 when gold falls back, with a target of 3360-3370.

Gold rebounds in the US market and continues to be short!
📊Comment analysis
Gold rose yesterday under the stimulus of risk aversion, so gold did not continue to rise today, which means that the risk aversion sentiment of gold has been digested, and the 1-hour moving average of gold has also begun to turn downward and has not crossed upward, so the momentum of gold shorts has begun to increase, and gold rebounds and continues to be short. After gold surged, it has been under pressure at the 3310 line and cannot break through. Therefore, gold rebounds in the US market and continues to be short at highs under pressure at 3310.
💰Strategy Package
US trading operation ideas:
Gold 3304-3310 short, stop loss 3315, target 3280-3270-3260;
⭐️ Note: Labaron hopes that traders can properly manage their funds
- Choose the number of lots that matches your funds
- Profit is 4-7% of the capital account
- Stop loss is 1-3% of the capital account

Will gold continue to rise as risk aversion heats up?
📌 Gold driving factors
At present, the current market sentiment has turned cautious, driving safe-haven funds into gold. Previously, Moody's downgraded the US sovereign credit rating, and President Trump's promotion of a large-scale tax cut bill is expected to be passed by Congress, further strengthening the theme of "selling the United States" and exerting continuous pressure on the US dollar.
In addition, the resurgence of disputes between the United States and China on the chip issue, and the news that the Group of Seven is considering imposing tariffs on cheap Chinese products, have exacerbated the uncertainty of the global economic outlook, further suppressing the US dollar, while supporting gold, a traditional safe-haven asset, to an eight-day high. Gold prices also benefited from the heating up of geopolitical tensions. CNN reported that several US officials revealed that Israel is preparing to launch a strike on Iran's nuclear facilities.
📊Commentary Analysis
The current market is still running in a range of shocks. Therefore, the US market is still trading repeatedly around the range for the time being. For the time being, the small range will temporarily look at the 3320-3285 line!
💰Strategy Package
Gold: Short when it retreats to around 3325-3320, stop loss at 3330, target around 3290! For long orders, look at the support situation and then enter the market at the right time!
⭐️ Note: Labaron hopes that traders can properly manage their funds
- Choose the number of lots that matches your funds
- Profit is 4-7% of the fund account
- Stop loss is 1-3% of the fund account

Rebound firmly short-sellingThe US dollar index continued to fall yesterday, breaking through the 100 integer mark, but the gold price did not break through the key resistance level. In the short term, we need to be alert to the risk of gold price correction. In addition, the three major US stock indexes have continued to rise recently, but the market risk appetite has decreased. We need to be alert to the market panic and liquidity tightening that may be caused by the stagnation of the US stock market's rise, which will put pressure on the gold market. Technically, the gold price was blocked at the important pressure level of 3250 yesterday, and the support below was at the 3200 mark. In the short term, it is still mainly range-bound. At present, the upper resistance is 3226-3233, and the lower support is 3189-3184. In terms of operation, it is recommended to rebound short and supplemented by callback long.
Operation strategy 1: It is recommended to rebound short at 3228-3235, and the target is 3210-3193.
Operation strategy 2: It is recommended to pull back to 3189-3185 and go long, and the target is 3215-3235.

Gold continues to fall seize the opportunity to enter the market
📌 Driving factors
China-US container shipping routes rose sharply - factories rushed to produce overnight, taking advantage of the tariff cooling-off period, those who should stock up are working overtime to complete the tasks. This is the situation seen on the first day after the tariff reduction, indicating the complementarity between China-US trade.
The long-awaited US-Japan and European and American tariffs have not yet ushered in substantial benefits, but Europe said that this is an unfair negotiation and has not been concluded yet.
Trump went to the Middle East and signed a 100 billion weapons order, stabilizing the Middle East before Europe.
📊Comment analysis
The Asian session fell in the morning, pay attention to a few points:
1. The upper watershed opened at 3193 in the morning, the short watershed.
2. Directly break the 3168 long watershed, the next support is at 3145, 3130.
3. For now, the Asian session will continue to fall in a cycle, the European session will pull back after breaking the bottom, and the US session will continue to retreat.
💰Strategy Package
For short-term operations, short selling can be done near 3166, stop loss 3169, target 3140, 3135.
Labaron believes
Guaranteeing the principal is the bottom line for survival, controlling risks is the armor for survival, earning profits is a stage medal, and long-term stable and continuous profits are the only proof of being able to stand up from the sea of blood and corpses.

Tariff easing has just begun
📌 Driving factors
The historic easing of tariffs between China and the United States, the imminent peace talks between Russia and Ukraine, the ceasefire between India and Pakistan, and the market's pricing of geopolitical risks have obviously cooled down, which has further shrunk the demand for gold as a regional safe-haven tool. The situation in the Middle East is complicated, and it is necessary to monitor the latest developments in real time, focus on the latest developments in the follow-up news, and adjust strategies in real time.
📊Comment analysis
In the Asian session, gold is concerned about the upper resistance at $3,250 today. The rebound relies on the resistance below to continue shorting. The lower point is $3,207. If it falls below, it will be $3,150. For specific operations, please pay attention to the free channel.
💰Strategy Package
Long position:
Actively participate at 3200 points, with a profit target of around 3230 points
Short position:
Actively participate at around 3245 points, with a profit target of around 3220 points
Labaron believes
Guaranteeing the principal is the bottom line for survival, controlling risks is the armor for survival, earning profits is a stage medal, and long-term stable and continuous profits are the only proof of being able to stand up from the mountains of corpses and seas of blood.

Thinking and practical skills for winning in the 3360-3400 rangeAffected by the news, gold fell sharply at the opening. Successfully won. According to the trading strategy, we gave gold a wide range of fluctuations in the 3360-3400 range, which will not change much. It can be operated within the range during the day. The trading strategy analysis is accurate, and the key points are accurately grasped to enter the market, which brought us good returns during the day. The short-term rhythm is accurately grasped! Brothers who followed the trading plan should have also made very good profits. 🍻🍻🍻

The downside risk of gold increases!📌Fundamentals:
1. The conflict between India and Pakistan shows signs of escalation
2. US-Houthi ceasefire agreement
3. The Fed’s interest rate decision dominates this week’s market
4. International trade situation disturbs market sentiment
5. Market sentiment and capital flow
📊Technical aspects:
At present, on the hourly basis, gold is still under pressure at the small range resistance of 3400, and the current tariff crisis has cooled down. The data of the Fed's interest rate decision will cause a series of fluctuations in gold in the short term. At the same time, the market is betting that there will be further trend corrections, which may cause capital outflows in the market, which will further hit gold bulls!
There is actually a new round of operation opportunities in the short term. The short-term resistance should be around 3400, but since the game between major powers has not stopped, there will be no big negative factors. However, if the data layout does not fluctuate much, the market may not have a big dive. At present, we will temporarily play at the 3360-3400 level. If it breaks, we will make new adjustments!
🎯Practical strategy:
Gold: Short around 3390-3400 on the rebound, and the target is 3370-3360!

GOLD UPDATEMarket structure suggests is preparing for its next move.
The AND level will likely play a critical role in the upcoming direction.
** If structure breaks and confirms the shift, a new bias might form after the retest. **

Interpretation of technical ideas for short-term gold trading onGold opened this week in a volatile market. It opened high and fell on Monday. The US market rose above the high opening position. It fell in the Asian market on Tuesday. The European and American markets fluctuated and adjusted. The main reason is that the data this week is concentrated in the second half of the week. From the past market, this week's rebound did not touch 3370, so it cannot be treated as strong. It did not fall below the bottom support of 3260. The overall trend is convergent and volatile. Now the technical indicators are in a sticky posture, and the three lines of the Bollinger Bands are also closed. The Asian market mainly focuses on the continuation of volatility. The upper side focuses on the resistance of the hourly Bollinger Band upper rail 3330, and the lower support is at 3300.
Pay attention to the operation of the range at noon. If the gold price touches 3300 below, participate in long orders with a light position. With a small loss, look at the target of the upper rail pressure of the Bollinger Band at 3330; if there is a rebound before the European market that touches the upper rail of the Bollinger Band at 3330, you can try to arrange a short position to be bearish, and the target is whether 3300 can be broken. The small non-farm data will be released before the U.S. market opens, followed by the PCE data. At that time, I will re-position my position based on the data release and wait for the data release to help gold prices move out of the range of volatility.

Gold short-term profit is more fun
🌐 Driving factors
Geopolitical situation: US President Trump's special envoy Witkov held a three-hour meeting with Russian President Putin in Moscow last Friday to discuss the US plan to end the war in Ukraine. The Kremlin said that the positions of the two sides have become closer.
India accused Pakistan of sheltering terrorist organizations, and Pakistan denied it and accused India of instigating separatist activities in Pakistan (such as Balochistan). The situation is difficult to control.
Latest news: Russian President Putin announced on the 28th that a ceasefire will be implemented from 0:00 on May 8 to 0:00 on May 11.
Market bullish sentiment cools down
📊 Commentary analysis
According to the trend of gold in the Asian and European sessions, the trading signals derived from technical analysis have helped many people achieve short-term victories.
🔷 Technical side: For the current gold, the 1-hour chart card fluctuates widely between 3330-3292, and is currently around $3324.
✔Operational suggestions, short-term trading:
US gold operation strategy:
Short strategy: If gold falls back to the range of 3330-3350, you can enter the market to short, target 3270, stop loss 3355
💥Risk warning
Liquidity risk: The market may be bearish in early May, and price fluctuations may be amplified.
Policy black swan: Trump may suddenly change tariff policies or personnel changes at the Federal Reserve, causing violent market fluctuations.
Technical false breakthrough: There are a large number of stop-loss orders near $3350, and you need to be wary of reversals after inducing more.
Summary:
This week, the gold market will be affected by geopolitics, Federal Reserve policies and the trend of the US dollar, and the fluctuation range is expected to be between $3260 and $3350. Investors need to pay close attention to key support and resistance levels and adjust strategies flexibly.

Goldman Sachs Earnings Tomorrow – Ready for a Bullish Breakout?Goldman Sachs (NYSE: GS) is shaping up for a potential bullish move ahead of its earnings report tomorrow (January 15) before the market opens. With the stock bouncing off key support levels and positive momentum indicators, a strong earnings surprise could trigger further upside toward my targets.
Let’s break down the setup:
💼 Trade Setup for Swing Trade:
🔹 Entry Price: $569 (current price)
🎯 Take Profit 1: $600
🎯 Take Profit 2: $625
🎯 Take Profit 3: $650
🛡️ Stop Loss: $540 (below key support)
📈 Why Am I Bullish on Goldman Sachs?
1️⃣ Earnings Catalyst (January 15, Pre-Market)
Goldman Sachs will release its Q4 2024 earnings tomorrow before the market opens. Historically, the bank has outperformed expectations, particularly in trading revenues and fixed income.
Given the recent recovery in capital markets, there’s a good chance Goldman will report higher-than-expected revenues, which could trigger a sharp rally.
2️⃣ Technical Reversal in Play
GS is bouncing off a key support zone near $550, which has acted as demand multiple times in the past. The RSI is rising from oversold levels, and Stochastic has turned bullish, suggesting momentum is building.
A break above $575 would confirm the reversal and open the door to higher targets at $600, $625, and $650.
3️⃣ Valuation and Undervaluation
Goldman Sachs is trading at a P/E ratio of 16.8, which is cheaper than peers like JPMorgan and Morgan Stanley. This leaves room for valuation expansion, especially if the bank delivers positive earnings surprises.
With recovering trading volumes, M&A activity, and IPO deals, GS could see a significant boost to revenue and profitability.
💡 Final Thoughts:
Goldman Sachs is setting up for a potential bullish move, with a solid technical and fundamental backdrop. The upcoming earnings report is a key catalyst that could trigger strong upside if results beat expectations.
I’m targeting $600, $625, and $650, while managing risk with a stop loss at $540. Let's see how it plays out!
💬 What do you think? Are you bullish on Goldman Sachs too? Drop your thoughts in the comments! 👇

3.5 Technical analysis of short-term gold operationsOn the first trading day of March, the US dollar index fell sharply. Data released by ISM showed that the US ISM manufacturing index in February was 50.3, lower than the expected 50.8, and the previous value in January was 50.9. 50 is the dividing line between prosperity and recession. Although the ISM manufacturing PMI continued to expand in January, the amplitude was small and tended to stagnate. Both new orders and employment shrank. At the same time, the material purchasing price index soared to the highest level since June 2022. After the data was released, the US dollar index fell further.
Gold rebounded sharply, challenging the 10-day moving average. The 5-day and 10-day moving averages still showed a dead cross. The daily RSI rebounded and reached the key pressure zone of 2900-10 in 4 hours. The short-term trend turned to bullish, but it was still not a strong bull market. You can wait for the opportunity to stabilize and go long near 2875.
