GoldXAUUSD
- Fibonacci Level - 161.80%
- Bearish Channel as an corrective pattern in Short Time Frame
- Order Block
- Change of Characteristics
- Completed " 123 " Impulsive Waves
Goldminers

Nexgold Mining Daily Outlook Count 3This is my Elliott Wave count on Nexgold Mining TSXV:NEXG . Price could be making a wave 3 high and could retrace for wave 4. suppose it depends on what Gold does to a degree. The chart so far has reversed at some nice Fibonacci levels along the outlook.
The wave 5 high wouldn't necessarily be end of the bullish sequence, i just don't tend to project too far ahead, lets let these waves play out and go from there.
More comments on the chart.
If you like, show your appreciation!

XAUUSD Gold Monthly Outlook (Count 2)In this outlook on FX_IDC:XAUUSD i am putting forward a long term monthly chart view. although i have the audacity to suggest Gold may not move in a straight line, I'm hardly bearish either. I have a large position in Gold related instruments (then Silver then Uranium)
There are plenty of comments on the chart so I'm not going to recap too much here, but i will mention the caveats:
1. The projections i have put forward are based on estimates of uncompleted waves, once i feel i can anchor the next wave i will update the chart and recalculate the levels for the next wave, the chart is an evolving puzzle and there is only so much we can determine based on the information we have.
2. I put more emphasis on price levels as opposed to time, dependent on volatility the waves could play out quickly or prolonged, i do factor in an element of 'the right look' in terms of wave proportionality, but also want the patterns i am projecting to be easily visible on the outlook, so bear that in mind.
Note: i create my outlooks with the browser tabs hidden (F11) so if they look squashed, that is why.

GoldXAUUSD
- Completed " 12345 " Impulsive Waves
- Bullish Channel as an corrective pattern in Short Time Frame
- Break of Structure
- RSI - Divergence
- Change of Characteristics

GoldXAUUSD
- Completed " 1234 " Impulsive Waves
- Break of Structure
- Symmetrical Triangle as an corrective pattern in Short Time Frame
- Demand Zone
- Change of Characteristics

GoldXAUUSD
- Completed " 123 " Impulsive Waves
- Break of Structure
- RSI - Divergence
- Bullish Channel as an corrective pattern in Short Time Frame
- Change of Characteristics

GoldXAUUSD
- Order Block
- Bullish Channel as an corrective pattern in Short Time Frame
- Break of Structure
- Completed " 1234 " Impulsive Waves
- Fair Value Gap

GoldXAUUSD
- Rising Wedge as an corrective pattern in Short Time Frame
- Break of Structure
- Consolidation Phase
- Completed " 12345 " Impulsive Waves and " AB " Corrective Waves
- RSI - Divergence

GoldXAUUSD
- Completed " 12345 " Impulsive Waves
- Consolidation Phase in Long Time Frame
- RSI - Divergence
- Bullish Channel as an corrective pattern in Short Time Frame
- S / R Level

GoldXAUUSD
- Fibonacci Level - 361.80%
- Fair Value Gap
- Completed " 123 " Impulsive Waves
- Break of Structure
- Symmetrical Triangle as an corrective pattern in Long Time Frame

SA Seabridge Gold: 93.3% Score - And Why I'm Watching CloselyIs this the World's Largest Undeveloped Gold Project?
Gold has been on a tear in 2025, and for good reason. Rate cuts on the horizon, central banks accumulating, geopolitical uncertainty everywhere. In this environment, I have been scanning for gold equities that combine technical strength with real assets. Seabridge Gold NYSE:SA emerged with a 93.3% score on my system, one of the highest I have seen in the precious metals sector this year. Here is what I found when I looked under the hood.
So Why This Stock Caught My Attention
I evaluate over 15 technical conditions with intelligent weighting, and NYSE:SA passed nearly every checkmark. The setup shows Perfect Order moving average alignment, with price trading comfortably above all key averages. The 3-month gain stands at 67.33%, more than double my 30% threshold, while relative strength versus SPY registers at 62.36%. Against its own sector, SA leads by 64.22%.
The price structure confirms a healthy uptrend with 5 higher highs and 5 higher lows over the last 10 days, weekly timeframe aligned, and the stock sitting just 5.85% below all-time highs. Momentum indicators across the board confirm bullish conditions. Most importantly, the risk warning section shows all clear: no distribution detected, no warning signals, no chasing situation.
The only weakness is the Tightening score at 39 out of 100, suggesting the consolidation needs a few more days to compress before the ideal breakout emerges.
The Company Behind the Score
Seabridge Gold is not your typical gold miner. They do not operate mines. Instead, they acquire, explore, and advance world-class deposits, then partner with major mining companies to develop them. This asset-light model means lower operational risk and massive leverage to rising metal prices.
Their flagship is the KSM project in British Columbia's Golden Triangle, and the numbers are staggering: 47.3 million ounces of gold and 7.3 billion pounds of copper in reserves. This makes KSM the world's largest undeveloped gold project and the third-largest undeveloped copper resource. The 2022 Pre-Feasibility Study outlines a 33-year mine life with all-in sustaining costs of just $601 per ounce, compared to the industry average of roughly $1,500. That cost advantage comes from copper byproduct credits and access to BC Hydro's clean, cheap hydroelectric power, giving KSM one of the lowest carbon footprints of any large-scale mining project globally and I like Green companies a lot.
What separates Seabridge from other developers is execution. They spent over $1 billion and 20 years advancing KSM through exploration, economic studies, and permitting. In July 2024, they secured "Substantially Started" status from the BC government, locking in environmental permits for the life of the project. Most competitors are still fighting permitting battles. Seabridge already won that war.
Beyond KSM, the portfolio includes Courageous Lake in the Northwest Territories with 11 million ounces of indicated gold, and the Iskut project just 20 kilometers from KSM, which management believes could become "another KSM" based on recent drilling results at Snip North. A maiden copper-gold resource at Iskut is expected by early 2026.
The Catalyst That Could Change Everything
CEO Rudi Fronk announced on November 12 that Seabridge is now in direct negotiations with a preferred JV partner after three finalists completed site visits. A deal could come before year-end. This is the moment the company has been building toward for 25 years.
The JV structure makes sense for everyone. Seabridge lacks the $5-6 billion needed to build KSM alone, but they hold 100% of a permitted, de-risked, world-class asset. Major miners have the balance sheets but struggle to find quality projects at this scale. The expected deal structure involves a phased earn-in, allowing Seabridge shareholders to retain meaningful exposure while a larger partner funds development.
B. Riley Securities raised their price target from $50 to $65 on December 2, citing rising gold and copper prices and the imminent JV catalyst. Stonegate Capital values the company between CA$42 and CA$67 per share. Current price: around $29.
My Take
SA checks nearly every box on my system. Perfect Order alignment, exceptional relative strength, clean risk profile, proximity to highs, and a fundamental story that could drive significant re-rating. The macro environment supports gold, the company sits on irreplaceable assets, and a transformational catalyst is weeks away.
I am watching for a decisive break above $29.31 with volume confirmation. If the consolidation tightens further and gold holds its strength, this setup could deliver. The 10 EMA will serve as my trailing stop reference.
Bottom Line
SA has the technical setup, the fundamental story, and the timing. I hope it follows the path of NASDAQ:GLUE which has gained nearly 50% since I first highlighted it.
Disclaimer
This analysis reflects my personal research and trading approach. It is not financial advice. I may hold or initiate a position in SA. Always do your own research before making any investment decisions

GoldXAUUSD
- Bullish Channel as an corrective pattern in Long Time Frame
- Fair Value Gap
- S / R Level
- Change of Characteristics
- Completed " 12345 " Impulsive Waves and " AB " Corrective Waves

GoldXAUUSD
- Completed " 12345 " Impulsive Waves and " ABC " Corrective Waves
- Change of Characteristics
- Break of Structure
- Consolidation Phase as an corrective pattern in Short Time Frame
- Order Block

GoldXAUUSD
- Completed " 1234 " Impulsive Waves
- Break of Structure
- RSI - Divergence
- Change of Characteristics
- Fibonacci Level - 38.20% / 50.00%

GoldXAUUSD
- Consolidation Phase in Long Time Frame
- Impulse Correction
- Completed " 12345 " Impulsive Waves and " AB " Corrective Waves
- Break of Structure
- Bullish Channel as an correction in Short Time Frame

GoldXAUUSD
- Completed " 12345 " Impulsive Waves
- Change of Characteristics
- Bullish Channel as an corrective pattern in Short Time Frame and Long Time Frame
- Order Block
- Fibonacci Level - 78.60%

GoldXAUUSD
- Rising Wedge as an corrective pattern in Long Time Frame
- Change of Characteristics
- Completed " 12345 " Impulsive Waves
- Fibonacci Level - 38.20% / 50.00%
- Consolidation Phase

GoldXAUUSD
- Change of Characteristics
- Completed " 1234 " Impulsive Waves
- Break of Structure
- Bullish Channel as an corrective pattern in Short Time Frame
- Order Block

GoldXAUUSD
- Change of Characteristics
- Fair Value Gap
- Fibonacci Level - 61.80% / 78.60%
- Bullish Channel as an corrective pattern in Short Time Frame
- Order Block

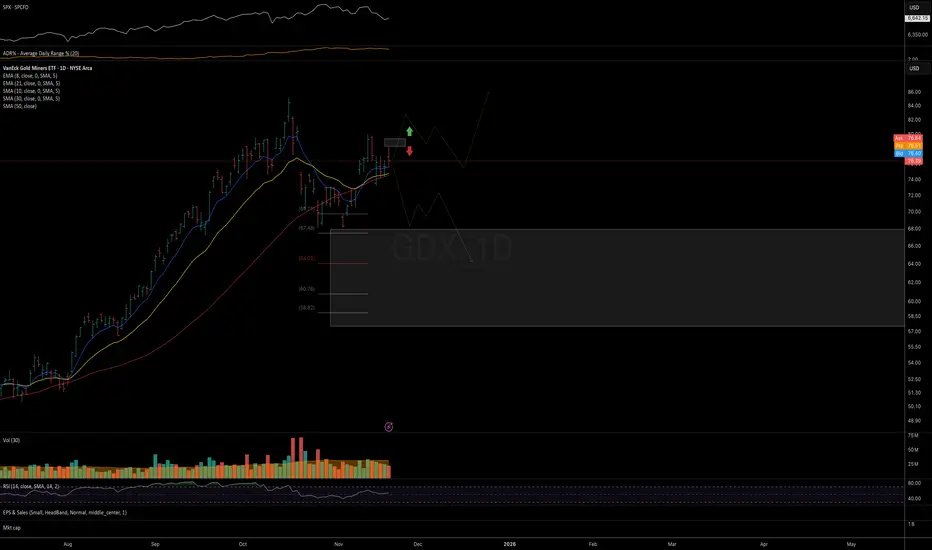
GDX: two alternative scenarios for the coming weeks. Tracking two alternative scenarios for the coming weeks.
But as long as price remains below the November highs, the preferred expectation is for one more leg down to re-test the November lows, and ideally a deeper move toward the 64 support zone.
If price manages to break out above the November highs, I would still prefer to see additional consolidation and a proper handle formation to complete the base before considering the move a more sustainable breakout.
Chart:
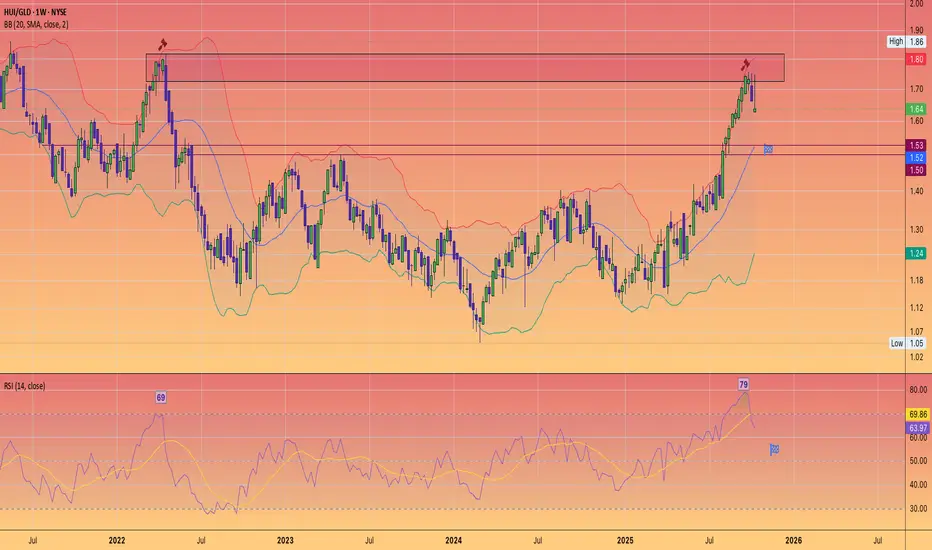
HUI/GLD showing weekly exhaustionUnderstandable given the Euphoria in the Precious metals markets the past two weeks.
Is the Bull Run completely over?
I don't think so.
#Silver has yet to Hit $95
and is merely testing it's own breakout level of its historical all time high's.
As this ratio is indicating the past few weeks it appears it wants to come back into previous resistance zones and also reset the RSI to around 50, so still in a bull market.
Would be a welcome correction.
GDX - Gold Miners ETF: Inverse Head & shouldersGold prices have surged to unprecedented levels in light of recent trade policy changes. The announcement by US President Donald Trump regarding a new 25% tariff on essential imports such as cars, semiconductors, and pharmaceuticals has created a wave of uncertainty among investors. This risk-off sentiment has driven many to seek refuge in safe-haven assets like gold.
Nevertheless, this upward momentum may encounter challenges if a trade agreement with China comes to fruition. A successful deal could alleviate global trade tensions, leading to a decrease in gold demand and possibly resulting in selling pressure.
However sustained high bullion prices could prove to be a significant advantage for gold miners. The GDX ETF is showing a persistent inverse head and shoulders pattern, indicating potential for further gains.

#JX - Bull Market about to resume, massive inv Head & Shoulders.The Canadian venture index
After completing one Inverse Head and Shoulders that made target and overshot into expected resistance.
Has now setup a massive larger inverse head and shoulders that projects to previous all time high's last seen nearly 20 years ago.
The venture index is full of junior miners and commodity companies that have a letter .v Suffix
Once it has done retracing I expect it to attack the neckline for the Big pattern breakout.
