GOLD 4H CHART ROUTE MAP UPDATE & TRADING PLAN FOR THE WEEKHey Everyone,
Please see our updated 4h chart levels and targets for the coming week.
We are seeing price play between two weighted levels with a gap above at 4042 and a gap below at 3964. We will need to see ema5 cross and lock on either weighted level to determine the next range.
We will see levels tested side by side until one of the weighted levels break and lock to confirm direction for the next range.
We will keep the above in mind when taking buys from dips. Our updated levels and weighted levels will allow us to track the movement down and then catch bounces up.
We will continue to buy dips using our support levels taking 20 to 40 pips. As stated before each of our level structures give 20 to 40 pip bounces, which is enough for a nice entry and exit. If you back test the levels we shared every week for the past 24 months, you can see how effectively they were used to trade with or against short/mid term swings and trends.
The swing range give bigger bounces then our weighted levels that's the difference between weighted levels and swing ranges.
BULLISH TARGET
4042
EMA5 CROSS AND LOCK ABOVE 4042 WILL OPEN THE FOLLOWING BULLISH TARGETS
4147
EMA5 CROSS AND LOCK ABOVE 4147 WILL OPEN THE FOLLOWING BULLISH TARGET
4264
EMA5 CROSS AND LOCK ABOVE 4264 WILL OPEN THE FOLLOWING BULLISH TARGET
4340
EMA5 CROSS AND LOCK ABOVE 4340 WILL OPEN THE FOLLOWING BULLISH TARGET
4422
EMA5 CROSS AND LOCK ABOVE 4422 WILL OPEN THE FOLLOWING BULLISH TARGET
4494
BEARISH TARGETS
3964
EMA5 CROSS AND LOCK BELOW 3964 WILL OPEN THE FOLLOWING BEARISH TARGET
3873
EMA5 CROSS AND LOCK BELOW 3873 WILL OPEN THE SWING RANGE
3741
3632
As always, we will keep you all updated with regular updates throughout the week and how we manage the active ideas and setups. Thank you all for your likes, comments and follows, we really appreciate it!
Mr Gold
GoldViewFX
Goldprediction

Gold price analysis November 11Gold continued to move as expected in yesterday's session, bringing impressive profits to traders who followed the previous strategy.
Currently, the resistance zone of 4150 is acting as an important barrier as buying pressure starts to slow down. There is a high possibility that the market will see a short-term correction around this area.
Current strategy:
SELL GOLD (Scalping) around the resistance zone of 4145, expecting a short-term price reaction.
When the buyers return and create a confirmation signal around the 4076–4106 area, wait to BUY in line with the main trend, with a further target towards ATH 4375, where the liquidity zone above is still empty.
📈 The overall trend is still up – the correction is only temporary for the market to gain momentum for the next wave.

A reversal? No! Our bullish outlook remains unchanged!#XAUUSD OANDA:XAUUSD TVC:GOLD
Looking at the hourly and 4-hour charts, the technical indicators are diverging, indicating a need for a pullback correction. In the short term, it may test the 4115-4105 support level. Therefore, do not trade blindly in the short term, wait for the price to pull back to the support level before participating in long positions.

BUY GOLD (XAUUSD) - Amazing opportunity XAUUSD (Gold) has been stuck inside a sidewards channel and has struggled to break through it for a while. However, the price recently broke above the green trend line which acted as a medium resistance level (which means the price is very likely to head to the next major resistance zone which will is marked as the take profit level). XAUUSD is clearly bullish and will be heading upwards in the next few days. BUY!

Gold price rise meets expectations, is $4200 still far away?
News:
Spot gold continued its upward momentum in Asian trading on Tuesday (November 11), rising for the third consecutive day after breaking through the $4,100 mark in the previous trading session. It once rose to around $4,148.91 per ounce, a new high since October 23, and the fourth day of gains in the past five trading days.
Key Driver: Weak US Economic Data Ignites Interest Rate Cut Expectations
The root of the problem lies in a series of weak US economic data released last week. This data acted like a hammer blow, shattering market illusions of a robust economy.
Secondly, the US consumer confidence index released last Friday showed a sharp decline in early November due to household concerns about an economic recession. These two data points combined to reinforce market expectations of a dovish stance from the Federal Reserve.
Technical aspects:
From a technical perspective, gold prices briefly rose above the 50% Fibonacci retracement level of 4134, the level following the recent sharp correction from the October all-time high. Combined with the positive oscillator on the daily chart, this confirms the short-term bullish outlook for gold. A further break above the 4155-4160 USD area would confirm the bullish bias and push gold to retest the 4100 USD level. This level is close to the 61.8% Fibonacci retracement level (4192), and a decisive break above this level would pave the way for further gains.
From an hourly chart perspective, the two most crucial support levels for gold are around 4120-25 and the 4000 level.
4120-25 coincides with the hourly chart's 20-period moving average (MA20), and 4115 is also near today's opening price. Therefore, as long as gold stabilizes above these levels, it's likely to maintain a consolidation and upward trend today.
Trading strategy:
Buy:4125-4120, SL: 4115, TP: 4160-4180

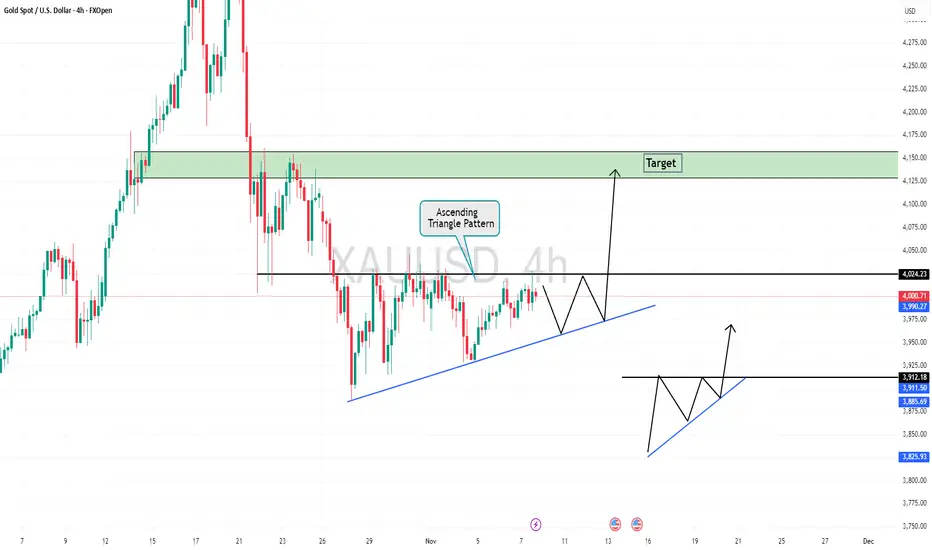
Gold is Ready For Bull From Triangle PatternHello Traders
In This Chart GOLD HOURLY Forex Forecast By FOREX PLANET
today Gold analysis 👆
🟢This Chart includes_ (GOLD market update)
🟢What is The Next Opportunity on GOLD Market
🟢how to Enter to the Valid Entry With Assurance Profit
This CHART is For Trader's that Want to Improve Their Technical Analysis Skills and Their Trading By Understanding How To Analyze The Market Using Multiple Timeframes and Understanding The Bigger Picture on the Charts
GOLD HOLDS UNDER PRESSURE – RETESTING $3130 SUPPORT ZONE🟡 Market Overview
Gold (XAU/USD) is trading around $3137/oz, slightly lower amid bank holidays in the U.S., leading to thin liquidity and limited volatility within the $3130–$3145 range.
📊 Technical Analysis
• Resistance: $3145 – $3152
• Support: $3130 – $3124
• EMA 50: still sloping downward, indicating short-term bearish momentum.
• Candlestick Pattern: M15 chart shows rejection wicks near $3130, suggesting short-term buying defense.
• RSI (14): recovering from 35 to 45 — signaling a potential minor rebound.
💬 Outlook
Gold remains under moderate pressure but could see a technical rebound if $3130 holds firm. A recovery toward $3145–$3152 is possible before the next directional move develops.
🎯 Trading Strategy
🔺 BUY XAU/USD
Entry: $3130–$3134
🎯 TP: 40 / 80 / 200 pips
🛑 SL: $3124

The bull market has returned. Am I bullish at this price level?#XAUUSD TVC:GOLD OANDA:XAUUSD
Gold prices performed strongly yesterday, closing with a large bullish candle on the daily chart and stabilizing above the daily MA5, officially signaling the return of bulls to the market.
Gold strengthened further today, and from a technical perspective, the bullish trend remains intact. Therefore, continuing to go long on gold is clearly safer. The bullish signal given last night regarding a pullback to the 4075 support level remains valid. However, with the passage of time and the continued strength of gold, a direct pullback to this level in the short term is somewhat difficult. But as a point of multiple pullbacks on smaller timeframes and near the daily MA20, the 4075 support remains reliable. Therefore, we can consider it a defensive level for the short-term bulls. As long as gold prices remain above this level, the bullish momentum will not change.
Currently, looking at the hourly chart, the 4125-4110 range is the support zone for the short term. If the price retraces to this level during the European session, it would be a good entry point, and we can continue to go long on gold within this range.

Is gold about to return to a bullish trend?On Monday, the US dollar index remained below the 100 level as signs that the US government might resume operations boosted market risk sentiment.
Spot gold rebounded sharply, surging over $100 intraday and returning above $4100, reaching a new high in over two weeks.
So far, gold has reached a high near $4150.
Looking at the hourly chart:
The two most crucial support levels for gold are currently around 4120-4115 and the $4000 level.
The 4120-4115 level coincides with the hourly moving average (MA20), and 4115 is also the opening price today. Therefore, if it holds above this level, gold is likely to maintain a consolidation and upward trend today.
Secondly, there's the $4000 level, which is the hourly MA30. It's possible that the price might break through the MA20 and directly reach the MA30.
Therefore, I think it's best to wait until at least 4120-4115 before considering long positions.
If the price breaks through the morning high of 4150, it may continue to reach the high near 4180.

Symmetrical Triangle formationNice bounce off that 3900 support. If it holds above 4140, we could be heading back up to test 4200. Let's see if the bulls can push it.
Accurate prediction of an upward trend has arrived as expected.The protracted US government shutdown is finally coming to an end! The Senate has cleared procedural hurdles, and the temporary funding bill has passed a procedural vote, ensuring government funding until January. The shutdown is likely to end this weekend.
As soon as the news came out, the market went from cloudy to sunny – the previous shutdown had tightened liquidity, but now it seems to be easing, and the precious metals market is leading the rebound. Although the shutdown isn't completely resolved, the resumption of negotiations between the two parties has sent a positive signal, boosting risk appetite and relieving the anxiety of watching partisan infighting.
To put it simply, this "temporary extension" by the US government is like a reassurance to the market. Investors who were panicking before the shutdown can now breathe a sigh of relief. All that's left is to wait for the final decision so that the government can fully "reopen for business"!
Gold broke out of a two-week low-level triangle pattern in the previous trading session, ushering in a strong upward trend. Yesterday's market exhibited a three-stage upward trend: higher in the Asian session, continued gains in the European session, and accelerated gains in the US session. Each rally was followed by a period of consolidation without significant pullbacks, a classic characteristic of extremely strong market conditions.
Regarding the future trend, the bullish outlook remains unchanged for today.
On one hand, the current situation strongly suggests a period of high-level consolidation: given the current extremely strong pattern, gold is more likely to continue its "time-for-space" consolidation, digesting pressure before resuming its upward movement. If this pattern holds, aggressive long positions can be considered before the European session.
On the other hand, if a pullback occurs: the 4116-4110 range should be closely watched, as this will act as a crucial support level. If the price retraces to this range and stabilizes, long positions can be considered on the pullback.
Gold Technical Outlook:
Price has stabilized above the 4105 level, indicating a potential bullish continuation toward the resistance zone at 4160.
A break and confirmation above 4160 on the 1-hour or 4-hour candle would strengthen the bullish sentiment and open the way for further upside targets at 4188 and 4220.
However, if the price drops and breaks below 4105, this would invalidate the bullish scenario and shift the outlook toward a downward move targeting the 4075 support level.

XAU/USD Intraday Plan | Momentum Strong, Resistance AheadGold continued its bullish move, breaking above the 4074 and 4115 resistance levels and pushing up into the 4153 zone. Price is now showing early signs of slowing momentum at this level, which has acted as a reaction area in the past.
Price is currently trading around 4128, still well above both the MA50 and MA200. However, buyers need to hold above 4115 to maintain the upside. A clean break above 4153 could open the way toward 4197 next.
If price fails to hold above 4115, we could see a pullback first into 4074, and if selling pressure deepens, the 4027 level and the First Reaction Zone (3984–3955) remain key areas where buyers have previously stepped back in.
📌 Key Levels to Watch
Resistance:
4,153
4,197
Support:
4,115
4,074
4,027
3,984
3,955
3,921
3,884
🔎 Fundamental Focus
This week remains highly sensitive due to ongoing developments around the U.S. government shutdown.
Today is a U.S. bank holiday, meaning liquidity may be lower, we may see exaggerated moves and less stable price action.

GOLD falling in a parallel channel formation Gold price has been falling since yesterday as expectations of December rate cut fades away. It is forming a parallel falling channel pattern and has recently bounced from the lower zone.
Keep an eye on it as volatility is expected to stay and there will be ample opportunities to capture movements. Follow me for live updates.
Gold 30 m Decision-Point: Breakout vs. PullbackFundamental Overview
The spot price of Gold (XAU/USD) is hovering around USD 4,115-4,130 per ounce.
Bullish drivers:
Expectations of a rate cut by the Federal Reserve (Fed) continue to support gold as a non-yielding store of value.
Safe-haven demand remains elevated amid global uncertainty and weaker U.S. economic data.
Bearish/neutral risk factors:
The U.S. Dollar (USD) is finding some strength, which could cap gold’s upside.
With gold already near recent highs, the risk of profit-taking or consolidation is higher.
Fundamental Bias Summary: Neutral to slightly bullish — fundamentals support upside, but need trigger for meaningful move.
Technical Analysis (30 Minute Frame)
Price is trading near USD 4,115-4,130, above yesterday’s range.
Key resistance zone: USD 4,150-4,200. A clean breakout here could fuel further gains.
Key support zone: USD 4,050-4,000. If price drops below, look for weakness.
Technical indicators: RSI on daily/4-hour shows momentum is positive; however intraday momentum may be thinner on the 30m frame.
Technical Bias Summary: Favor bullish bias if price breaks above resistance and confirms. Without that, expect range bound or pullback toward support.
Trade Plan & Key Levels
Bullish Scenario (Breakout Play):
Entry: Long above USD 4,150, after 30-min candle close above.
Stop-Loss: Around USD 4,010-4,000, depending on risk tolerance.
Targets:
TP1: ~USD 4,250
TP2: ~USD 4,350 (if momentum strong)
Bearish Scenario (Rejection/Breakdown Play):
Entry: Short if price fails at resistance zone (4,150-4,200) and breaks below USD 4,000 on 30-min.
Stop-Loss: ~USD 4,170-4,200
Targets:
TP1: ~USD 3,900
TP2: ~USD 3,800
No-trade / Wait Mode:
If price remains stuck between ~USD 4,050 and USD 4,150 without clear breakout or breakdown — better sit out and wait for clearer directional cue.
My View for Today
I lean slightly bullish, but only if we see a valid breakout above USD 4,150. The fundamental tailwinds (Fed cut hopes + safe-haven) support this.
However, if that breakout fails and price rejects, the more likely scenario is a pullback toward USD 4,000-3,900.
Thus, I’ll be watching closely for the trigger on the 30-minute chart — execution only after confirmation.

XAU/USD – Ahead of U.S. Data: Continuation or Reversal?🌐 MARKET CONTEXT
The gold market is currently navigating a juncture of competing forces: on one hand, the continuing expectation of central bank pivoting and safe-haven demand; on the other, risks from a stronger U.S. dollar and higher real yields. For instance, recent commentary highlighted that gold broke above ~US$4,074-oz amid weak U.S. data and growing hopes of a Fed rate cut.
OneRoyal News
+2
ODI: Think change
+2
Additionally, the milestone of gold surpassing US$4,000 per ounce has underlined both its strong momentum and the questions about whether this is a sustainable trend or ripe for a pullback.
World Gold Council
+1
From a sentiment standpoint:
The risk-on component: if data disappoints, gold could rally further.
The risk-off / hawkish policy risk: if inflation or jobs data surprise to the upside, the dollar and rates may rise, weighing on gold.
For the upcoming London → New York sessions, focus is on how gold reacts around major technical zones, and whether price structure shows continuation or reversal.
Thus, the bias today is conditional bullish, leaning long on confirmed demand zones, but ready to flip to bearish if supply zones trigger rejection.
📉 TECHNICAL ANALYSIS (SMC + Liquidity Structure)
The price is in a broader up-trend (following the breakout above key resistance zones) but is now entering high-probability structural decision zones.
We have clear Supply and Demand zones:
Some prior Resistance turned Support zones around ~4,021-4,074 (per recent reports) act as demand/higher-probability buy areas.
OneRoyal News
+1
A supply zone around ~4,080 and above is noted as a target and potential reversal area if momentum falters.
OneRoyal News
+1
Regarding SMC confirmations: look for liquidity sweeps (stop-loss hunts), fake BOS (Break of Structure), or mitigation before entering. A clean confirmation before a trade increases probability.
Example: If price rises into 4,080-4,078 and then sweeps above 4,086 then reverses, that may signal a “trap buy and sell” scenario (structure break then reversal). Conversely, if price dips to 3,990-3,988 or 3,930-3,928 and shows a sweep of liquidity then a strong bullish candle, we may have a CHoCH and continuation long.
🔑 KEY PRICE ZONES
4,080–4,078 ▶️ Sell Zone – High-probability supply nearest to session high, look for rejection.
4,161–4,163 ▶️ Buy Zone – A higher demand zone / breakout target area acting as strong structural bounce.
4,081–4,083 ▶️ Buy Zone – Demand zone near current structure, reactive long setup if confirmed.
3,990–3,988 ▶️ Buy Zone – Deep demand/support zone for larger reversal potential.
Stop-loss levels:
Sell stop-loss: 4,086
Buy stop-loss (4,161 zone): 4,155
Buy stop-loss (4,081 zone): 4,075
Buy stop-loss (3,990 zone): 3,982
⚙️ TRADE SETUPS
✅ BUY SCENARIO 1 – STRUCTURAL SUPPORT HIGH TARGET
Entry: 4,161–4,163
Stop-loss: 4,155
TP1: ~4,180 TP2: ~4,210 TP3: Open
Logic: A breakout into this zone or strong bounce from it would indicate continuation of bullish momentum and structural demand dominance.
✅ BUY SCENARIO 2 – MID-STRUCTURAL DEMAND
Entry: 4,081–4,083
Stop-loss: 4,075
TP1: ~4,100 TP2: ~4,135 TP3: Open
Logic: A reactive long setup if price pulls back to this zone and confirms demand (liquidity sweep + bullish candle). Good London session focus.
✅ BUY SCENARIO 3 – DEEP SUPPORT ACCUMULATION
Entry: 3,990–3,988
Stop-loss: 3,982
TP1: ~4,020 TP2: ~4,060 TP3: 4,100+
Logic: Larger-scope reversal zone, ideal if price falls into this area and shows structure change (CHoCH) from bearish to bullish.
⚠️ SELL SCENARIO – SESSION SUPPLY REJECTION
Entry: 4,080–4,078
Stop-loss: 4,086
TP1: ~4,040 TP2: ~3,990 TP3: ~3,930
Logic: If price rises into this supply zone and shows rejection (e.g., wick up, reversal candle) then expect a short. Especially potent during New York session when liquidity is high.
🧠 NOTES / SESSION PLAN
Prioritize confirmation: don't enter solely on touching zone — wait for structure (M5/M15) and liquidity event.
London session: likely focus on BUY setups (4,081 zone, 3,990 zone).
New York session: monitor for the SELL setup at 4,080–4,078 if price approaches.
Monitor macro data releases (U.S. inflation, job numbers) which could provoke volatility and invalidate setups.
Risk management: each trade should respect stop-loss and maintain risk ≤2% of account; trail stops once TP1 hits.
Avoid chasing after large rapid moves; allow the market to structure into zones rather than predicting broken conditions.
🏁 CONCLUSION
The bias for today: bullish conditional — we favour buys on confirmed demand zones (4,161–4,163; 4,081–4,083; 3,990–3,988) but remain alert for a bearish reversal if price exhausts into the supply zone around 4,080–4,078 with clear rejection. Today’s structure offers a wide range of actionable zones; success will depend on discipline to wait for confirmation and managing risk strictly.

XAUUSD (Gold) Daily Chart Analysis: Reaching Key Resistance/FVGKey Observations and Analysis
Recent Price Action: Gold has experienced a strong upward move, currently trading around $4,142.19. This rally has approached a critical area marked on the chart.
Key Resistance / Fair Value Gap (FVG): The price is entering a large shaded box labeled "D / FVG".
This box, spanning from approximately $4,160 to $4,240, represents a Daily Fair Value Gap (FVG) or a significant imbalance left by a prior sharp move down (a large bearish candle on November 21st-22nd).
In technical analysis, particularly concepts like Smart Money Concepts (SMC), an FVG acts as a high-probability target where the market often returns to fill the inefficiency. It also typically serves as a strong resistance zone.
Break of Structure (BOS): An area labeled "BOS" (Break of Structure) around the $4,020 level indicates a recent shift in market structure from potentially bearish/ranging to bullish on this timeframe, confirming the recent upward momentum.
Prior Low ('X'): A previous low labeled "X" around the $4,000 psychological level was initially respected before the rally commenced.
Expected Reaction: The chart includes a projected price path (the black arrow/zigzag line) suggesting the price may tap the FVG and then experience a reversal or sharp pullback from this key supply/imbalance zone.
Conclusion
The XAUUSD market is currently testing a significant Daily Fair Value Gap (FVG) / Resistance zone. Traders will be looking for a reaction around the $4,160 - $4,240 area to determine if the bullish momentum will pause, reverse, or break through to continue higher.

Buy gold around 4105, target 4160-4199Gold Market :
Analysis: Yesterday, we maintained our buying stance on gold, placing buy orders at 4047, 4073, and 4078. Today, we will continue to place buy orders. Gold has broken through the previous daily chart's correction high and started a new major rebound. The strength and magnitude of this rebound are very significant. Do not try to catch it; those who sold yesterday are mostly at a loss. Trying to guess the top makes it very difficult to capture the absolute highest point. The daily chart closed with a strong bullish candle with no upper or lower shadow. Today's buying will continue to push the price higher. Where is the top? Such a strong upward trend has no clear top. We need to follow it, even if it means risking everything to buy. The area around 4046 on the daily chart is already the bottom of the daily consolidation range. Even if there is a pullback later, it's unlikely to break through this level again. Pullbacks are our buying opportunities.
Gold prices rose sharply in the Asian session, presenting buying opportunities on minor dips. Waiting for strong support is unlikely; hourly support is around 4105. The key level to avoid in the Asian session is 4161. A break below this level could lead to further upward movement on the daily chart. I anticipate a period of consolidation around this level. I expect a rise in the Asian session followed by consolidation in the US session.
Support: 4105 and 4075; Resistance: 4161; Key level for market strength/weakness: 4105.
Fundamental Analysis:
Recent comments from Federal Reserve officials signaled continued interest rate cuts, suggesting a continuation of rapid easing policies, which should support further upward movement in gold.
Trading Recommendation:
Buy gold around 4105, target 4160-4199.

Gold price analysis October 11✨ Gold Analysis XAUUSD – 10/11/2025
Gold price has officially broken the Keylevel 4031 zone, confirming a strong bullish wave is forming. This development makes the intraday trading strategy clearer and more favorable when giving full priority to BUY setups following the trend.
Main scenario:
✅ BUY right at the price zone 4045
✅ BUY when the price rejection signal appears around the support zone 4031
🎯 Profit target: 4150
Sub-scenario (low risk):
❌ SELL is only considered if a false break appears and the price closes the candle back below 3985 – however, this possibility is currently very low.
👉 Comment: The break zone 4031 is the perfect confirmation point for the uptrend. Prioritize looking for buying opportunities with the main wave instead of trading against the trend.

Gold Ends Its Pullback, New Bullish Wave Targets to 4,268?Hey Realistic Traders!
"XAUUSD Correction Wave is Over, Could This Be the Next Big Move?"
Let’s dive into the technical analysis to see what the chart is really telling us.
Technical Analysis
On the daily chart, XAUUSD has rebounded once again around the EMA200, with multiple bounces confirming the strength of its broader bullish trend. Afterward, Gold consolidated within a symmetrical triangle pattern, a formation that often appears as a corrective phase within an uptrend where selling pressure gradually weakens. A breakout from this pattern typically marks the beginning of a new bullish wave.
The recent breakout was accompanied by strong momentum. A bullish Marubozu candlestick highlighted renewed buying interest, while the MACD golden cross added confirmation to the bullish bias. Together, these signals reinforce the case for a continuation of the prevailing uptrend.
In this scenario, the first upside target is located near 4,163 , aligning with a historical resistance area, where a short-term pullback may occur. If bullish momentum continues, XAUUSD could extend higher toward the second target near 4,267, just below its all-time high.
This bullish outlook remains valid as long as the price stays above 3,916. A move below that level would invalidate the setup and shift the outlook back to neutral.
Beyond technicals, Gold’s bullish outlook is also supported by a broader macro trend, as many central banks continue to reduce their U.S. dollar exposure and increase gold allocations in their reserves, adding further strength to the long-term bullish narrative.
Support the channel by engaging with the content, using the rocket button, and sharing your opinions in the comments below.
Disclaimer: "Please note that this analysis is solely for educational purposes and should not be considered a recommendation to take a long or short position on Gold."

The bullish trend in gold has begun to continue.
News:
Gold prices broke through resistance again in early US trading on Monday (November 10), resulting in a volatile rebound in the market. Spot gold opened at its lowest point of the day and then rose steadily throughout the day, currently trading around $4090, up 1.91%.
With the government shutdown nearing its end, the Federal Reserve may be poised to shift its policy. "The Fed currently lacks comprehensive data support... but it is already sensing weakness in the labor market." In the absence of reliable data anchoring, policy decisions will face significant challenges.
Technical aspects:
The combination of technical and fundamental factors has strengthened the short-term upward momentum for gold, with support around 4050 and the Bollinger Band middle line at 4030 acting as lower support. Resistance is located at 4120.00.
If the yield tests the upper Bollinger Band at 4.146%, gold may face opportunity cost pressure and retrace to the middle line; however, the MACD golden cross indicates solid lower support. If the price holds above the short-term support at 4050, it may further test 4120.00.
Trading strategy:
Buy:4050-4045, SL: 4040, TP: 4080-4120

Gold - The bullrun is over today!💰Gold ( TVC:GOLD ) creates a massive top:
🔎Analysis summary:
Starting all the way back in 2015, Gold created a major rounding bottom pattern. After the breakout, Gold started its major bullrun, rallying about +300% over the past couple of years. But after this rally, Gold is now showing clear signs of a serious top formation.
📝Levels to watch:
$4,000
SwingTraderPhil
SwingTrading.Simplified. | Investing.Simplified. | #LONGTERMVISION

GOLD near Resistance ? What's next??#GOLD.. after a perfect move according to our last idea regarding gold and now market just reached near to our expected resistance area.
That is around 4115-22
Keep close and don't be lazy here.
Good luck
trade wisely
