XAUUSD PROFITABLE Gold had behaved accordingly and hit take profit, next move can be to wait and relax for it to play out before executing
Goldprediction
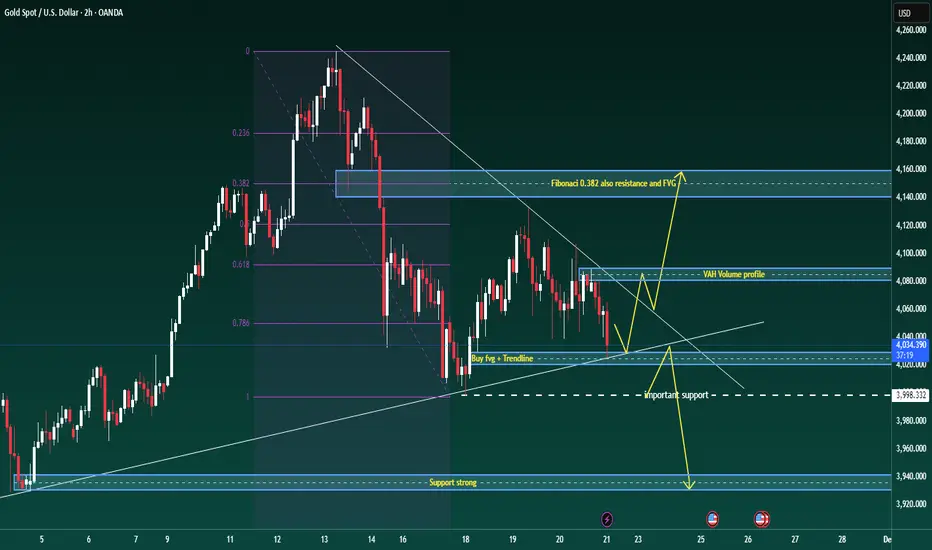
Gold is stuck in a wide range, ready for a decisive break.Good evening traders, Brian here with a fresh look at gold on the 2-hour chart.
Price is compressing in a broad sideways range, building energy for the next leg – the break from this structure will set the tone for the coming sessions.
Fundamental analysis
The core driver remains the Fed’s December decision. The market is effectively split on whether we see a cut or a delay:
A camp of institutions argues that rising unemployment and softer data could still justify a 25-basis-point cut in December, keeping pressure on the dollar and supporting gold on dips.
Others point out that the Fed is short of clean, up-to-date data and may prefer to wait until next year before committing to an easing cycle.
As a result, pricing for a December cut is roughly “fifty–fifty” and highly sensitive to the next run of labour-market and activity data.
In short: the macro backdrop is undecided, so intraday direction will be driven mainly by levels and liquidity until the next data catalyst hits.
Technical analysis
On the H2 chart, gold is in a broad consolidation after the recent sell-off:
Price is trading inside a descending structure, repeatedly respecting the short-term trendline from the recent high.
The Fibonacci retracement of the latest impulse shows the 0.382 level lining up with a prior fair-value gap and horizontal resistance – this forms a key rejection zone overhead.
Below price, there is a confluence of support where the rising trendline meets a small bullish FVG around 4027–4029, followed by a more important horizontal support band near 3998.
The volume profile highlights a Value Area High (VAH) around 4075–4080, which is likely to act as a reaction zone if price rotates back into it.
Until we break convincingly out of this structure, I treat it as a large accumulation range with a slight downside bias: sellers are still defending lower highs, but buyers are stepping in aggressively at trendline support.
Key levels
Resistance zones:
4080–4085 (VAH / short-term supply)
4135–4145 (Fibonacci 0.382 + FVG + structural resistance)
Support zones:
4027–4029 (trendline + FVG confluence buy area)
3995–4000 (important horizontal support)
3940 region (deeper support if the range finally breaks down)
Trade scenarios
1. Primary long – buy the trendline/FVG confluence
Entry: 4027–4029
Stop: 4023
Targets: 4035 – 4050 – 4068 – 4080
Idea: look for price to react at the rising trendline where it overlaps with the small FVG. A clean rejection candle or shift in intraday order flow from that zone sets up a rotation back towards the VAH and potentially the upper boundary of the range.
2. Break-and-retest short – if the trendline fails
Trigger: clear H1/H2 close below the rising trendline and the 4027 area
Plan: wait for price to retest the underside of the broken trendline / prior support
Entry: on rejection of that retest
Initial targets: 4000, then 3940 if momentum accelerates
This scenario treats any breakdown as a structural shift, using the retest as a lower-risk point to join the move rather than chasing the first leg.
3. Intraday scalp zones
These are discretionary, short-term opportunities for active traders:
Reaction sells: around 4085, and higher up if we spike into the 4135–4145 resistance band. Look for exhaustion or rejection patterns back into the range (potential targets 4060 then 4033).
Reaction buys: into 3998–4000 if we see a liquidity sweep below the current range, with tight stops and quick profit-taking back towards the mid-range.
Gold Weakening Inside Triangle – Bears Eye $3,950 SupportGold is currently consolidating inside a symmetrical triangle formation between 3972 support and 4025 resistance showing reduced volatility and awaiting breakout confirmation. The structure suggests indecision but with a slight bearish bias due to repeated lower highs.
Sell Zone: 3995-4020 (near upper triangle resistance and 0.382-0.5 fib region)
Stop Loss: Above 4046
TP1: 3950 TP2: 3915 TP 3: 3885
⚠️ Current bias: Neutral to bearish unless gold breaks and holds above 4025-4046 zone. Weak low near 3886 may attract liquidity if bearish pressure continues.
Note
Please risk management in trading is a Key so use your money accordingly. If you like the idea then please like and boost. Thank you and Good Luck!

Gold Under Pressure: Key Resistance Holds, More Downside LikelyGold is moving inside a descending channel showing clear bearish pressure. Price is struggling to hold above 4050-70 and repeated rejections from the upper trendline confirm sellers are still in control. A clean break below 4025 can open the way toward the deeper liquidity zones around 4010 and 3975. As long as price stays below the falling trendline the bias remains bearish and any small pullback toward 4075-90 will likely act as a selling opportunity. Only a strong breakout above 4100-20 would shift momentum back to buyers.
✅ Bias: Sell below 4060-85 resistance
Sell Zone : 4075–4090
Stop Loss : Above 4120
Take Profit : 4025 - 4010 - 3975
Note
Please risk management in trading is a Key so use your money accordingly. If you like the idea then please like and boost. Thank you and Good Luck!

Gold at Make-or-Break Level – High-Probability Short Setup LoadiGold is still trading inside a corrective structure after forming a clear lower low and then consolidating. Price has tapped the mid range zone and is now reacting from a short term supply area. As long as gold stays below 4130–4145 the bearish structure remains intact and the downside continuation toward 4025 → 4000 → 3950 remains the primary expectation. A short setup becomes active once price gives rejection or a small BOS from the current supply zone. The trade becomes invalid if gold breaks and closes above 4150 which would shift structure and open the way for a deeper pullback toward 4175–4200.
Sell Zone : 4130 - 4145
Invalidation : Break & close above 4150
Targets: 4075 → 4025 → 4000 → 3950
Note
Please risk management in trading is a Key so use your money accordingly. If you like the idea then please like and boost. Thank you and Good Luck!

Moving sideways and waiting for a breakout🔍 1. Descending Trendline (red line)
This is an important dynamic resistance.
Price has touched the descending trendline many times and been rejected → the overall trend still leans bearish.
Each retest of the trendline that fails to break gives a sell signal.
👉 Only when price closes above the descending trendline will the short-term trend have a chance to reverse.
🟦 2. Upper Resistance (light blue zone)
This is the area where the market previously made a strong reversal → strong supply zone.
If price breaks the trendline and moves toward this zone, it is a high-probability area where selling pressure may appear again.
🟩 3. Key Support (green zone)
Price has reacted many times at this support zone → strong support.
This is also where price can form a reversal pattern if buyers return.
👉 If price breaks below this support, the bearish trend will continue strongly toward the lower support zone.
🔄 4. Trading Scenarios
Scenario 1: Breakout of the descending trendline → Price moves up to resistance
Price may bounce from the current support area → move up to retest the descending trendline.
If the trendline is broken and retested successfully → target is the major resistance zone above.
For BUY:
Wait for a break & retest of the descending trendline.
BUY GOLD : 4000 - 3998
Stoploss : 3988
Take Profit : 100-300-500pips
SELL GOLD : 4130 - 4132
Stoploss : 4142
Take Profit : 100-300-500pips

XAUUSD GOLD ANALYSIS What’s Moving the Market Today? 21NovemberOANDA:XAUUSD GOLD ANALYSIS What’s Moving the Market Today? (November 21, 2025)
Welcome back to Trade with DECRYPTERS, where we turn complex charts into clean buy & sell zones.
Keep it simple let levels guide your decisions.
*📰 Market Overview*
Gold is consolidating after failing to extend above the intraday reaction zone, hovering near $4,070–4,080 as the Dollar Index holds firm around 99.0.
A steady dollar, fading rate-cut expectations and slow macro flows all limit immediate upside.
Volatility remains muted as markets wait for PMI data and fresh signals from the Fed.
Buyers continue defending dips, but sellers are active in the higher scalp zones.
*Key fundamentals driving today’s move:*
📈 DXY steady near 99.0 → caps bullish momentum
🏦 Fed pause confirmed; December cut odds drop to ~22%
🌍 Geopolitical risks + tariffs continue supporting safe-haven demand
🏛 Central bank demand strong: +634t YTD, up 28% YoY
📊 ETF flows: Q3 +222t inflows, but November shows light outflows as investors book profits
*📆 What’s Ahead Key Events to Watch*
🔸 PMI – Nov 21
Manufacturing expected ~49 & Services ~51.
Weak PMI = increased cut bets → gold bullish.
Strong PMI = DXY bounce → gold dips toward lower zones.
🔸 FOMC Meeting – Dec 16
Markets price a clear pause (78%) but a dovish surprise could unlock upside toward 4,150+.
Hawkish language may trigger a sweep into deeper demand (3,978–3,962).
🔸 Geopolitical Risk Premium
Tensions in US–China, Mideast and Eastern Europe continue to keep gold supported.
Any escalation = instant safe-haven spike; calmness = DXY strength → gold softens.
*🟩 GOLD TECHNICAL LEVELS*
Price continues to respect the mid-range structure with buyers defending the lower band and sellers reacting strongly at intraday supply.
After testing 4032–4049 demand, gold pushed back toward 4070–4080, confirming buyers still active.
*🎯 EQUILIBRIUM (EQ): 4,065.00*
Hold above EQ = bullish intraday momentum toward 4,094 → 4,105 → 4,123
Stay below EQ = re-test lower supports 4,050 → 4,032 with possible deeper sweep later
*🟩 📌 SCALP BUY AREA: 4,032 – 4,050*
Strong demand zone lining up with CB/ETF accumulation areas.
Ideal for intraday dip-buys during low volatility windows.
First reaction zone for bullish setups, especially inside the astrology short window.
If this breaks cleanly, expect a fast move toward 3,978–3,962.
*🟥 📌 SCALP SELL AREA: 4,094 – 4,105*
Repeated rejection zone — sellers remain active here.
Perfect for fading rallies with tight stops above 4,110.
If volume breaks above it, momentum quickly shifts to 4,123+.
This zone forms the short-term ceiling of current consolidation.
*🔺 📌 BULLISH BREAKOUT LEVEL: 4,123+*
A confirmed breakout above this level flips structure bullish.
Targets extend toward 4,148 → 4,165.
Usually triggered by macro catalysts (PMI/FOMC/geo shocks).
Watch for fakeouts if volume is weak.
*🔻 📌 SMART MONEY BUY ORDERS: 3,962 – 3,978*
Deep liquidity pocket where institutions are loading positions.
Expect sharp V-shaped reversals if this zone is tapped.
Only comes into play on deeper corrections or heavy data surprises.
Reclaim above 4,000 from here = strong upward momentum.
*📌 CONCLUSION*
Gold remains locked in a tight range, respecting both demand and supply zones as the EQ at 4,065 continues to act as the true pivot for direction. Holding below it opens the path for a controlled dip into deeper demand, while any strong break above EQ can trigger a clean push toward 4,123+. With macro data and geopolitical risk still guiding sentiment, patience and level-to-level execution remain the winning edge. Stay focused, let price come to your zones.
Please support me with your likes & comments to motivate deeper daily analysis!
Share your charts and thoughts let’s grow together.
Best Regards,
M. MOIZ KHATTAK | Founder, TRADE WITH DECRYPTERS

GOLD 4H CHART ROUTE MAP UPDATE & TRADING PLAN FOR THE WEEKHey Everyone,
Please see our updated 4h chart levels and targets for the coming week.
We are seeing price play between two weighted levels with a gap above at 4124 and a gap below at 4042. We will need to see ema5 cross and lock on either weighted level to determine the next range.
We will see levels tested side by side until one of the weighted levels break and lock to confirm direction for the next range.
We will keep the above in mind when taking buys from dips. Our updated levels and weighted levels will allow us to track the movement down and then catch bounces up.
We will continue to buy dips using our support levels taking 20 to 40 pips. As stated before each of our level structures give 20 to 40 pip bounces, which is enough for a nice entry and exit. If you back test the levels we shared every week for the past 24 months, you can see how effectively they were used to trade with or against short/mid term swings and trends.
The swing range give bigger bounces then our weighted levels that's the difference between weighted levels and swing ranges.
BULLISH TARGET
4124
EMA5 CROSS AND LOCK ABOVE 4124 WILL OPEN THE FOLLOWING BULLISH TARGETS
4212
EMA5 CROSS AND LOCK ABOVE 4212 WILL OPEN THE FOLLOWING BULLISH TARGET
4328
EMA5 CROSS AND LOCK ABOVE 4328 WILL OPEN THE FOLLOWING BULLISH TARGET
4422
EMA5 CROSS AND LOCK ABOVE 4422 WILL OPEN THE FOLLOWING BULLISH TARGET
4422
EMA5 CROSS AND LOCK ABOVE 4422 WILL OPEN THE FOLLOWING BULLISH TARGET
4494
BEARISH TARGETS
4042
EMA5 CROSS AND LOCK BELOW 4042WILL OPEN THE FOLLOWING BEARISH TARGET
3964
EMA5 CROSS AND LOCK BELOW 3964 WILL OPEN THE FOLLOWING BEARISH TARGET
3873
EMA5 CROSS AND LOCK BELOW 3873 WILL OPEN THE SWING RANGE
3767
3646
As always, we will keep you all updated with regular updates throughout the week and how we manage the active ideas and setups. Thank you all for your likes, comments and follows, we really appreciate it!
Mr Gold
GoldViewFX

GOLD - Elliott Wave AnalysisGold has now confirmed a breakout from the contracting triangle, completing the B wave of the corrective structure. This breakout supports the expectation that price is preparing for a C-wave advance toward the upper Fibonacci cluster.
Current Structure
• Triangle confirmed as wave B
• Breakout aligns with the internal subdivisions
• Wave (2) still unfolding as a W-X-Y / ABC-type correction
• C-wave upside targets: 4140–4180
• Key fib levels: 0.618 = 4153, 0.764 = 4188
What to Expect Next
A clean impulsive rise is anticipated as the C-wave develops.
Invalidation remains below the B-wave low.
Completion of Wave (2) in the highlighted zone would maintain the broader bearish sequence.
Structure remains clear and the roadmap is intact.

Gold price analysis November 20Gold continues to show a solid reaction at the main trendline, indicating that the bullish structure is still maintained by organized buying. The market's continued respect for this support line is an important signal, keeping the possibility of extending the trend to the 4200 zone high.
However, it is important to note: a H4 candle closing below the trendline will be the first sign confirming the weakening of the bullish momentum. At that time, the balance of forces will tilt towards the sellers and the price may correct deeply to the 3936 zone - the confluence of the next strong support.
Recommended strategy:
Activate BUY when the market shows a price rejection signal at 4041.
Profit target: 4200.
Risk management: H4 closes below 4041 → switch to SELL strategy, aiming at 3936.

Gold Non-Farm Payrolls Plus Government Opening
Gold prices fluctuated between slight gains and minor pullbacks during Thursday's Asian trading session, consolidating around $4080. With the US September non-farm payrolls report due later in the day, the market remained cautious, with investors generally choosing to postpone adding new directional positions.
The likelihood of a Fed rate cut in December has further decreased recently. With a cautious policy stance, the dollar has strengthened and risen to its highest level since May, thus putting significant pressure on gold, which does not generate interest.
However, the data gaps in the US economy caused by the prolonged government shutdown have led to market skepticism about the true economic momentum. Investment institutions pointed out, "Because the data recovery after the shutdown is incomplete, the actual growth momentum may be lower than it appears, therefore, support for gold remains."
Despite the combined effects of multiple factors, gold prices, while under pressure, have not experienced a one-sided decline.
From the 1-hour chart, gold is expected to trade within a range during the daytime session. The key resistance level to watch is 4110, while the key support level is 4030. Technically, a pullback is more likely. We will patiently await the non-farm payroll data tonight and adjust our strategy accordingly. However, we also reserve the possibility that the market might break down prematurely due to market expectations before the non-farm payroll data release.
In the middle positions, observe more and act less, be cautious about chasing orders, and patiently wait for key entry points. I will provide specific operational strategies in the channel, so please pay attention.
Strategy Signals:
Buy: 4105-4110,SL:4120,TP:4050,4030

XAUUSD – Battle Zones of the Day🌐 MARKET CONTEXT
Gold enters today’s session after a day of compressed volatility, where price repeatedly tapped into both buy-side and sell-side liquidity but failed to develop a clean trend. The intraday structure remains bearish, with price rejecting premium zones and forming lower highs on M30.
Recent Catalysts:
USD maintains mild strength following hawkish Fed tone
Market awaits midweek economic releases → low conviction sentiment
Risk sentiment remains neutral; no strong safe-haven flows
Session Expectations:
London Session: Early liquidity sweeps expected toward premium zones
NY Session: Higher probability of real directional expansion
Bias: Bearish intraday until discount zones induce a CHoCH
Price currently trades mid-range, making extreme liquidity zones the safest execution points.
📉 TECHNICAL ANALYSIS (SMC + LIQUIDITY STRUCTURE)
Market Structure
M30 structure: Lower Highs → Lower Lows
Equilibrium area: 4075–4085
Inducement layers stacking above 4147 and 4070
Liquidity
BSL: Above 4147 + 4070
SSL: Below 4033 and deep pocket at 3993
Market forming engineered liquidity wicks in both directions
Imbalance Zones
Bearish FVG at 4147–4148 (perfect scalp sell)
Minor imbalance at 4070–4071
Discount imbalances at 4033 and 3993 support buy setups
🔑 KEY PRICE ZONES (Clear, Attractive Explanations)
4148–4147 ▶️ Premium Liquidity Trap – Ideal Scalp Sell
A premium zone holding an unmitigated bearish OB + BSL inducement.
Smart money uses this area to trigger breakout buyers, then slam price back down.
4071–4070 ▶️ Secondary Premium Liquidity – Fast Rejection Zone
A mini liquidity pool just above equilibrium.
Engineered to sweep early-session highs before reversing sharply.
4035–4033 ▶️ Discount Reaction Zone – Scalping Demand
Micro OB + SSL cluster resting underneath → excellent for intraday rebounds.
Expect clean, mechanical reactions here with low drawdown.
3995–3993 ▶️ Deep Discount Liquidity Pool – High-Value Reversal Zone
Major SSL accumulation + HTF discount zone alignment.
A powerful reversal area if reached — institutions hunt this level for discounted entries.
⚙️ TRADE SETUPS (SMC-Driven, High Precision)
✔️ SELL SETUP 1 – PREMIUM SCALP
Entry: 4148–4147
Stoploss: 4126
TP1: 4135
TP2: 4120
TP3: 4085
Logic: BSL sweep + FVG fill → fast bearish rejection expected.
✔️ SELL SETUP 2 – MID-RANGE LIQUIDITY SWEEP
Entry: 4071–4070
Stoploss: 4077
TP1: 4058
TP2: 4043
TP3: 4033
Logic: Sweep of mini-BSL followed by displacement downwards.
✔️ BUY SETUP 1 – INTRADAY REBOUND
Entry: 4035–4033
Stoploss: 4027
TP1: 4048
TP2: 4070
Logic: SSL sweep → micro CHoCH potential → ideal for quick bounce.
✔️ BUY SETUP 2 – DEEP DISCOUNT REVERSAL
Entry: 3995–3993
Stoploss: 3987
TP1: 4010
TP2: 4040
TP3: 4070
Logic: Strong HTF discount reaction zone → high-probability reversal if tapped.
🧠 NOTES / SESSION PLAN
Avoid mid-range trading — only execute at extreme liquidity zones
Expect fake-outs during London opening
NY session likely delivers the main trend move
Always wait for M5/M15 confirmation (CHoCH + BOS)
Avoid buying near premium zones to prevent entering into liquidity traps
🏁 CONCLUSION
XAUUSD holds a bearish intraday structure, favoring premium sell setups at 4147 and 4070.
Discount zones at 4033 and 3993 remain high-probability areas for intraday bounces and potential reversals.
Trade only at liquidity extremes. Be patient. Let the traps form — then strike.

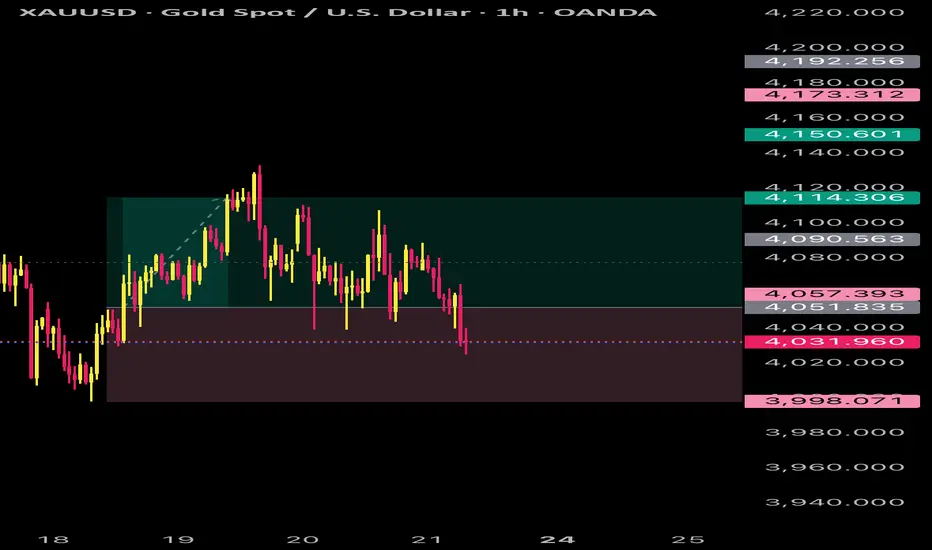
XAUUSD (Gold) Is heading UPWARDS! - time to buyA few weeks ago XAUUSD (Gold) was in a short term downtrend but finally broke out of it. The price broke through the downward channel to the upside, the price also held onto strong support (the white trendline which acted as a support level). The price tested the white trendline several times but kept bouncing back each time it hit the support zone. The price then broke through all recent resistance zones and will very likely hit the next resistance zone which is marked as the "Take profit" area. BUY GOLD NOW!

GOLD ANALYSIS What’s Moving the Market Today? November 20, 2025OANDA:XAUUSD GOLD ANALYSIS What’s Moving the Market Today? (November 20, 2025)
Welcome back to Trade with DECRYPTERS, where we turn complex charts into clean, practical buy & sell zones that anyone can understand.
Our goal is simple: react to levels, not emotions.
Follow the zones, follow the structure the market will guide you.
*📰 Market Overview*
Gold slipped after failing to hold above $4,100, drifting back into the mid-range as the Dollar Index (DXY) pushes toward 100.15.
December rate-cut expectations have cooled to around 50%, reducing bullish momentum for metals.
Markets remain fragile with data uncertainty, Fed division, and global tensions all contributing to volatility.
*Key Drivers Behind Today’s Move:*
📈 DXY Strength → A stronger dollar limits upside for gold.
🏦 Fed Minutes Split → Policymakers prefer a “wait & watch” stance, keeping gold range-bound.
📉 Shutdown Data Gaps → Missing CPI/NFP prints create unpredictable volatility bursts.
🌍 Geopolitical Tensions → US–China, Mideast and Ukraine-Russia keep safe-haven flows alive.
🏛 Central Bank Demand → Q3 +220 tonnes; Poland & Kazakhstan leading accumulation.
📊 ETF Flow Behavior → After a record +222t Q3 build, November shows slight outflows but AUM stays near all-time highs — meaning investors are still holding heavy gold exposure.
*📆 What’s Ahead — Key Events to Watch*
🔸 FOMC Meeting – Dec 9–10
Rate cuts remain a coin toss. A surprise hawkish stance could pressure gold quickly, while a dovish tone fuels moves toward upper ranges.
🔸 CPI / NFP Drop After Shutdown Delay
With imputed CPI around ~3.0% core expected, any surprise deviation triggers instant volatility.
Clustered data releases = strong intraday whipsaws.
🔸 Geopolitical Risk Premium
Escalations boost gold instantly.
Calm periods = USD strength and pressure on metal prices.
*🟩 GOLD TECHNICAL LEVELS*
Gold pulled back toward $4,050, but buyers are still active above the $4,000 handle.
The chart currently shows a controlled range with liquidity on both sides — a perfect environment for level-based trading.
*🟩 📌 BUY AREA: 4,005 – 4,028*
Strong accumulation zone where previous demand stepped in.
If price taps into this region, expect sharp rejections and bullish reaction candles.
This zone remains valid as long as gold does not break below $4,000.
Best area for swing & intraday long setups.
*🟥 📌 SELL AREA: 4,107 – 4,121*
This is your first reaction zone previous rejections, wick prints, and liquidity sweeps occurred here.
Expect immediate resistance on first touch.
Ideal short-term scalp sell region unless a clean breakout occurs.
Break above → opens room toward 4,150.
*📝 CONCLUSION*
Gold is playing a tight game between demand at 4,005–4,028 and selling pressure at 4,107–4,121, with EQ hovering near the mid-range.
Holding below EQ favors a deeper pullback into the buy zone, while a clean reclaim above EQ shifts momentum toward 4,148–4,165.
Until CPI/FOMC hits, gold remains range-bound with controlled volatility.
If gold close above 4100 we can see it to 4180
Stay patient.
Follow the levels.
Let the market hit your zones not your emotions.
🙌 Your Support Matters
Please support this analysis with your likes & comments it helps motivate me to share more detailed insights with you.
Feel free to drop your charts & views in the comments. I always reply!
Best Regards,
M. MOIZ KHATTAK | Founder – TRADE WITH DECRYPTERS

POssible 1:5 R2R on XAUUSDThis is a Follow up after the first entry from the previous post, Target 1 has been hit @ 4101 .
Still with Targets 2 and 3 in sight, we will b e anticipating a break and close above the 4089 price zone for a possible reentry as described in chart to target between 4172 - 4211 .
No Entry until this requirement
This is something to look out for upon the release of NFP today
Else, a possible Slide down to $3900
Patience is the way! Ieios

Gold Resistance Rejection: Is the Next Leg Down Starting?Gold ( OANDA:XAUUSD ) has touched its upside targets as I expected in my previous idea .
Gold is currently trading near the Resistance zone($4,192 – $4,133) .
In terms of Elliott Wave theory, it appears that Gold is completing a Double Three Correction(WXY) .
I expect Gold to drop to at least $4,049 after breaking the Support lines .
First Target: $4,049
Second Target: $4,009
Stop Loss(SL): $4,192
Points may shift as the market evolves
Please respect each other's ideas and express them politely if you agree or disagree.
Gold Analyze (XAUUSD), 1-hour time frame.
Be sure to follow the updated ideas.
Do not forget to put a Stop loss for your positions (For every position you want to open).
Please follow your strategy; this is just my idea, and I will gladly see your ideas in this post.
Please do not forget the ✅ ' like ' ✅ button 🙏😊 & Share it with your friends; thanks, and Trade safe.

XAU/USD Intraday Plan – NFP Will Decide the Next MoveGold failed to clear the 4115 resistance yesterday, which led to a retest of the 4053 level — now acting as intraday support. Price is currently trapped between the MA200 and MA50, reflecting indecision ahead of the NFP release.
We need to see a clean break above the immediate resistance at 4078.
A sustained move above 4115 would confirm a momentum shift and open the door toward
4170 → 4232.
If price fails to clear 4078, we may see continued consolidation or another pullback into the Support Zone.
A break below 3,996 would expose the HTF Support Zone (3968–3921).
📌Key Levels to Watch:
Resistance:
4078
4115
4170
4232
Support:
4053
4027
3996
3968
3921
🔎Fundamental Focus:
Today is all about NFP, one of the most market-moving releases for gold. With job creation, wages, and unemployment all being published together, we can expect sharp volatility in both directions.

Gold H1 – Sideway or Preparing for a Bigger Break?🟡 XAUUSD – Intraday Smart Money Plan | by Ryan_TitanTrader (20/11)
📈 Market Context
Gold continues to move inside a tight consolidation as markets digest fresh headlines:
Treasury markets just erased hopes for a December rate cut and now even a January cut is doubtful, following hawkish tones revealed in the latest Fed minutes.
This shift reinforces USD strength in the short term and pressures gold’s bullish momentum, keeping price trapped between well-defined liquidity zones.
Key implications from the news:
• The 6-month Treasury yield jumped back to 3.83%, aligning with hawkish expectations.
• Rate-cut bets evaporating → USD stays firm, limiting gold’s upside.
• Institutions are engineering both-side liquidity sweeps ahead of upcoming Fed speakers.
• Gold is currently hovering around ~$4,070 inside a neutral zone where no clean premium/discount imbalance exists.
Until the market receives fresh macro catalysts, price is likely to sweep liquidity at the edges of the range before choosing direction.
🔎 Technical Analysis (1H / SMC Structure)
• Structure: Price remains inside a short-term sideways distribution after the recent CHoCH + BOS sequence.
• Premium Sell Zone: 4145–4147, aligning with unmitigated supply + buy-side liquidity resting above recent highs.
• Discount Buy Zone: 4004–4002, sitting inside last clean demand with previous sell-side sweep.
• Liquidity Map:
→ Buy-side liquidity: above 4145–4150 (equal-high cluster).
→ Sell-side liquidity: below 4004–3997, where earlier long positions were cleared.
🔴 Sell Setup (Premium Reaction Zone)
• Entry: 4145 – 4147
• Stop-Loss: 4155
• Take-Profit:
→ 4085 (minor imbalance)
→ 4045 (range midpoint)
→ 4004 – 4002 (discount demand)
📌 Execution rule: Wait for liquidity sweep into zone + bearish CHoCH M5–M15 before entering.
🟢 Buy Setup (Discount Reaction Zone)
• Entry: 4004 – 4002
• Stop-Loss: 3997
• Take-Profit:
→ 4040 (short-term range high)
→ 4075 (inefficiency fill)
→ 4140 (premium retest)
📌 Valid only if price sweeps the 4000–3997 liquidity pocket and shows strong bullish displacement.
⚠️ Risk Management Notes
• Expect increased volatility as markets reposition after the sharp decline in rate-cut expectations.
• Avoid trading inside the 4030–4080 chop zone unless a clear structure break occurs.
• Reduce risk size during sudden USD spikes caused by Treasury-yield moves.
• Trail stops progressively as each liquidity level is taken.
📝 Summary
Gold is currently stuck in a clean intraday range as hawkish Fed minutes remove hopes for early rate cuts, pushing USD up and holding gold below premium supply.
SMC structure favors liquidity-sweep setups at both edges:
• Sell Zone: 4145–4147 (premium supply)
• Buy Zone: 4004–4002 (discount accumulation)
Expect classic manipulation → reaction → continuation patterns until the market resolves the new macro pressure.
📍 Follow @Ryan_TitanTrader for more Smart Money updates.

XAUUSD : Bearish Flip Targets $3930 LiquidityKey Observations and Interpretation
Previous Trend: The price experienced a strong bullish move, peaking around the $4,240 level, followed by a significant retracement.
Break of Structure (BOS): There was a previous Break of Structure (BOS) to the upside around $4,040, which indicated the start of the recent upward move. The price has now retraced back to and below this level.
Market Structure Shift/Change of Character: The move from the $4,240 peak down to the recent low near $3,990, followed by a lower high (X) at approximately $4,120, suggests a potential shift in market character from bullish to bearish.
Inducement/Minor Liquidity Sweep (I/S): The price action that led up to the high at X seems to have swept minor internal liquidity (I/S) before the larger drop.
Demand Zone/Fair Value Gap (D/FVG): The shaded area between roughly $4,040 and $4,070 represents a zone that was likely a prior demand zone or contains a Fair Value Gap (FVG). Price is currently interacting with this zone. In a bearish scenario, this zone is expected to act as resistance (a supply zone) after the structure shift.
Target Liquidity ($$$): The chart highlights multiple clear liquidity targets below the current price, marked by the triple dollar signs ($$$). These are levels where retail traders have likely placed stop-loss orders or where sell-limit orders are resting. These levels are approximately:
$3,980
$3,960
$3,930
📉 Projected Move
The analysis projects a likely scenario where the price:
Tests/Fills the D/FVG Zone: The price may experience a small bounce or consolidation within the $4,040 - $4,070 D/FVG zone (now acting as potential resistance/supply).
Continuation Lower: From this zone, the expectation is for the price to continue its move down.
Liquidity Sweep: The primary targets for the bearish move are the highlighted liquidity levels ($$$) below the $4,000 psychological level, with the deepest target around $3,930.

Gold Price Outlook – Trade Setup (XAU/USD)📊 Technical Structure
TVC:GOLD Gold (XAU/USD) is trading near $4,075, struggling to gain traction after a sharp intraday recovery. Price remains capped by the resistance zone at $4,081–$4,086, while intraday support is seen between $4,041–$4,045.
The structure currently favours a short-term bearish reaction, with price showing repeated rejection at the resistance zone. A break below $4,060 could accelerate downside momentum toward the support zone, while any sustained push above $4,093 would invalidate the bearish bias.
🎯 Trade Setup
Idea: Sell from resistance zone targeting retest of support.
Entry: $4,081 – $4,086
Stop Loss: $4,094
Take Profit 1: $4,045
Take Profit 2: $4,041
Risk–Reward Ratio: ≈ 1 : 3.4
Bias turns bullish only if price closes above $4,093.
🌐 Macro Background
Gold trades above $4,100 ahead of the delayed US September NFP report, which was pushed back due to the 43-day government shutdown, the longest in U.S. history.
FXStreet notes that:
“Gold edges higher to near $4,110 as uncertainty over US jobs data and cautious sentiment support safe-haven demand.” 【FXStreet】
NFP Impact:
A weaker-than-expected jobs report would likely revive expectations for a December rate cut, boosting gold through lower yields and a softer USD.
Fed Divisions:
The FOMC Minutes showed policymakers divided—some supporting further cuts, others opposing another move in December.
Market Pricing:
The CME FedWatch Tool shows only a 30% probability of a December rate cut, sharply lower than nearly 60% last week, limiting gold’s upside.
Overall, gold’s upside remains constrained by shifting rate expectations, but uncertainty around delayed data continues to provide safe-haven support.
🔑 Key Technical Levels
Resistance: $4,081 – $4,086
Support: $4,041 – $4,045
Psychological Level: $4,100
📌 Trade Summary
Gold remains trapped between resistance at $4,081–$4,086 and support at $4,041–$4,045. Price is showing rejection at resistance, favouring a short-term bearish pullback.
Downside targets lie at $4,045 and $4,041, unless incoming NFP data triggers renewed bullish momentum.
⚠️ Disclaimer
This analysis is for reference only and does not constitute trading advice. Trading involves significant risk, and proper risk management is essential.

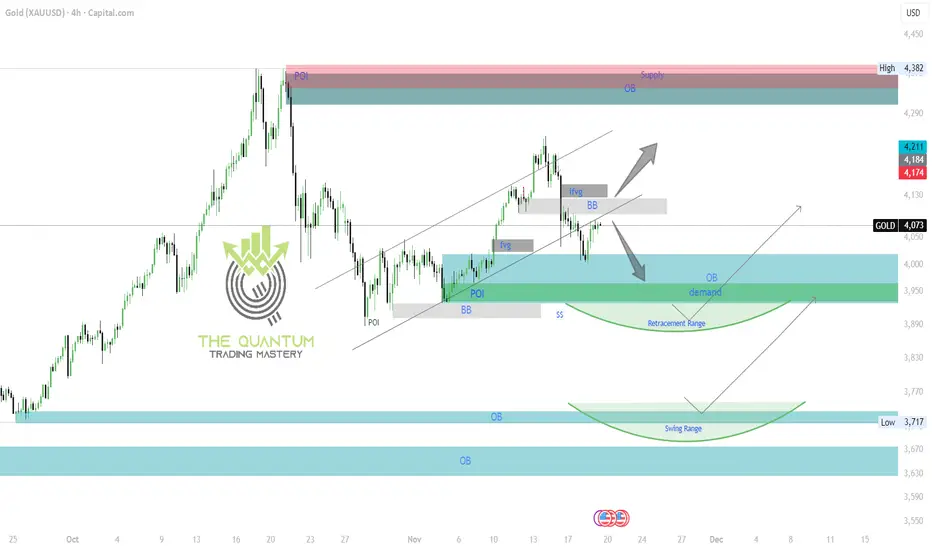
GOLD 4H CHART ROUTE MAP UPDATE & TRADING PLAN FOR THE WEEKGold 4H Analysis
On the 4H chart, price is currently moving between two major weighted levels, with an imbalance (gap) above around 4124 and another below near 4000. As long as price remains trapped between these zones, we should expect a series of side-to-side tests until one of the weighted levels breaks and holds to confirm the next directional range.
With this structure in mind, the plan remains to buy dips from our key support levels. These updated levels — including POI, BB, OB, and demand zones — help us track the move downward and catch bullish reactions as price bounces.
Scenario 1:
If price rejects from above at the BB zone at 4115–4120, we anticipate a bearish move back toward the OB + Demand zone, potentially into the Retracement Range, to sweep liquidity.
A 4H candle closing below the Demand zone around 3930 would confirm a deeper leg into the Swing Range near the 3700 levels.
If the 4H candle does not close below demand and only performs a liquidity sweep, then we expect a push to higher levels afterward.
Scenario 2:
If price cross above level, the BB zone at 4115–4120, we consider bullish and target will be above supply zone at 4330.
Note:
The Swing Range produces much larger bounces compared to our weighted levels, which is the key difference between the two.
Continue buying dips at our support levels, aiming for 20–40 pip scalps.
Each structural level we mark is designed to give 20–40 pip bounces — ideal for clean entries and exits.
Please boost, share and comment if you like the idea and analysis.
The QUANTUM TRADING MASTERY
GOLD 1H CHART ROUTE MAP UPDATE & TRADING PLAN FOR THE WEEKHey Everyone,
Please see our updated 1h chart levels and targets for the coming week.
We are seeing price play between two weighted levels with a gap above at 4114 and a gap below at 4057. We will need to see ema5 cross and lock on either weighted level to determine the next range.
We will see levels tested side by side until one of the weighted levels break and lock to confirm direction for the next range.
We will keep the above in mind when taking buys from dips. Our updated levels and weighted levels will allow us to track the movement down and then catch bounces up.
We will continue to buy dips using our support levels taking 20 to 40 pips. As stated before each of our level structures give 20 to 40 pip bounces, which is enough for a nice entry and exit. If you back test the levels we shared every week for the past 24 months, you can see how effectively they were used to trade with or against short/mid term swings and trends.
The swing range give bigger bounces then our weighted levels that's the difference between weighted levels and swing ranges.
BULLISH TARGET
4114
EMA5 CROSS AND LOCK ABOVE 4114 WILL OPEN THE FOLLOWING BULLISH TARGETS
4175
EMA5 CROSS AND LOCK ABOVE 4175 WILL OPEN THE FOLLOWING BULLISH TARGET
4232
EMA5 CROSS AND LOCK ABOVE 4232 WILL OPEN THE FOLLOWING BULLISH TARGET
4289
EMA5 CROSS AND LOCK ABOVE 4289 WILL OPEN THE FOLLOWING BULLISH TARGET
4361
BEARISH TARGETS
4057
EMA5 CROSS AND LOCK BELOW 4057 WILL OPEN THE FOLLOWING BEARISH TARGET
4006
EMA5 CROSS AND LOCK BELOW 4006 WILL OPEN THE FOLLOWING BEARISH TARGET
3965
EMA5 CROSS AND LOCK BELOW 3965 WILL OPEN THE SWING RANGE
3923
3861
As always, we will keep you all updated with regular updates throughout the week and how we manage the active ideas and setups. Thank you all for your likes, comments and follows, we really appreciate it!
Mr Gold
GoldViewFX

Gold price analysis November 19Gold is showing a very positive reaction around the large-frame trendline, where buying pressure is quite strong. The break of the key resistance zone 4080 has opened up a new bullish momentum and sent the market straight towards the psychological level of 4100. The bullish structure is more clearly consolidated and the current momentum is targeting the resistance zone 4145 – the upper range of today's trading session.
The previous BUY setups have worked out well, especially the position from 4075 which has given impressive profits. The overall trend remains in favor of the buyers while the important support zones continue to be well defended.
💡 Reference strategy:
Current BUY around 4090
BUY when price rejection signal at support 4080
BUY DCA when price breaks 4103
Target: 4175 – even extend to 4200
Risk: trend invalidated if price breaks trendline and closes candle below 4050
