XAU/USD Intraday Plan – NFP Will Decide the Next MoveGold failed to clear the 4115 resistance yesterday, which led to a retest of the 4053 level — now acting as intraday support. Price is currently trapped between the MA200 and MA50, reflecting indecision ahead of the NFP release.
We need to see a clean break above the immediate resistance at 4078.
A sustained move above 4115 would confirm a momentum shift and open the door toward
4170 → 4232.
If price fails to clear 4078, we may see continued consolidation or another pullback into the Support Zone.
A break below 3,996 would expose the HTF Support Zone (3968–3921).
📌Key Levels to Watch:
Resistance:
4078
4115
4170
4232
Support:
4053
4027
3996
3968
3921
🔎Fundamental Focus:
Today is all about NFP, one of the most market-moving releases for gold. With job creation, wages, and unemployment all being published together, we can expect sharp volatility in both directions.
Goldprediction

Gold H1 – Sideway or Preparing for a Bigger Break?🟡 XAUUSD – Intraday Smart Money Plan | by Ryan_TitanTrader (20/11)
📈 Market Context
Gold continues to move inside a tight consolidation as markets digest fresh headlines:
Treasury markets just erased hopes for a December rate cut and now even a January cut is doubtful, following hawkish tones revealed in the latest Fed minutes.
This shift reinforces USD strength in the short term and pressures gold’s bullish momentum, keeping price trapped between well-defined liquidity zones.
Key implications from the news:
• The 6-month Treasury yield jumped back to 3.83%, aligning with hawkish expectations.
• Rate-cut bets evaporating → USD stays firm, limiting gold’s upside.
• Institutions are engineering both-side liquidity sweeps ahead of upcoming Fed speakers.
• Gold is currently hovering around ~$4,070 inside a neutral zone where no clean premium/discount imbalance exists.
Until the market receives fresh macro catalysts, price is likely to sweep liquidity at the edges of the range before choosing direction.
🔎 Technical Analysis (1H / SMC Structure)
• Structure: Price remains inside a short-term sideways distribution after the recent CHoCH + BOS sequence.
• Premium Sell Zone: 4145–4147, aligning with unmitigated supply + buy-side liquidity resting above recent highs.
• Discount Buy Zone: 4004–4002, sitting inside last clean demand with previous sell-side sweep.
• Liquidity Map:
→ Buy-side liquidity: above 4145–4150 (equal-high cluster).
→ Sell-side liquidity: below 4004–3997, where earlier long positions were cleared.
🔴 Sell Setup (Premium Reaction Zone)
• Entry: 4145 – 4147
• Stop-Loss: 4155
• Take-Profit:
→ 4085 (minor imbalance)
→ 4045 (range midpoint)
→ 4004 – 4002 (discount demand)
📌 Execution rule: Wait for liquidity sweep into zone + bearish CHoCH M5–M15 before entering.
🟢 Buy Setup (Discount Reaction Zone)
• Entry: 4004 – 4002
• Stop-Loss: 3997
• Take-Profit:
→ 4040 (short-term range high)
→ 4075 (inefficiency fill)
→ 4140 (premium retest)
📌 Valid only if price sweeps the 4000–3997 liquidity pocket and shows strong bullish displacement.
⚠️ Risk Management Notes
• Expect increased volatility as markets reposition after the sharp decline in rate-cut expectations.
• Avoid trading inside the 4030–4080 chop zone unless a clear structure break occurs.
• Reduce risk size during sudden USD spikes caused by Treasury-yield moves.
• Trail stops progressively as each liquidity level is taken.
📝 Summary
Gold is currently stuck in a clean intraday range as hawkish Fed minutes remove hopes for early rate cuts, pushing USD up and holding gold below premium supply.
SMC structure favors liquidity-sweep setups at both edges:
• Sell Zone: 4145–4147 (premium supply)
• Buy Zone: 4004–4002 (discount accumulation)
Expect classic manipulation → reaction → continuation patterns until the market resolves the new macro pressure.
📍 Follow @Ryan_TitanTrader for more Smart Money updates.

XAUUSD : Bearish Flip Targets $3930 LiquidityKey Observations and Interpretation
Previous Trend: The price experienced a strong bullish move, peaking around the $4,240 level, followed by a significant retracement.
Break of Structure (BOS): There was a previous Break of Structure (BOS) to the upside around $4,040, which indicated the start of the recent upward move. The price has now retraced back to and below this level.
Market Structure Shift/Change of Character: The move from the $4,240 peak down to the recent low near $3,990, followed by a lower high (X) at approximately $4,120, suggests a potential shift in market character from bullish to bearish.
Inducement/Minor Liquidity Sweep (I/S): The price action that led up to the high at X seems to have swept minor internal liquidity (I/S) before the larger drop.
Demand Zone/Fair Value Gap (D/FVG): The shaded area between roughly $4,040 and $4,070 represents a zone that was likely a prior demand zone or contains a Fair Value Gap (FVG). Price is currently interacting with this zone. In a bearish scenario, this zone is expected to act as resistance (a supply zone) after the structure shift.
Target Liquidity ($$$): The chart highlights multiple clear liquidity targets below the current price, marked by the triple dollar signs ($$$). These are levels where retail traders have likely placed stop-loss orders or where sell-limit orders are resting. These levels are approximately:
$3,980
$3,960
$3,930
📉 Projected Move
The analysis projects a likely scenario where the price:
Tests/Fills the D/FVG Zone: The price may experience a small bounce or consolidation within the $4,040 - $4,070 D/FVG zone (now acting as potential resistance/supply).
Continuation Lower: From this zone, the expectation is for the price to continue its move down.
Liquidity Sweep: The primary targets for the bearish move are the highlighted liquidity levels ($$$) below the $4,000 psychological level, with the deepest target around $3,930.

Gold Price Outlook – Trade Setup (XAU/USD)📊 Technical Structure
TVC:GOLD Gold (XAU/USD) is trading near $4,075, struggling to gain traction after a sharp intraday recovery. Price remains capped by the resistance zone at $4,081–$4,086, while intraday support is seen between $4,041–$4,045.
The structure currently favours a short-term bearish reaction, with price showing repeated rejection at the resistance zone. A break below $4,060 could accelerate downside momentum toward the support zone, while any sustained push above $4,093 would invalidate the bearish bias.
🎯 Trade Setup
Idea: Sell from resistance zone targeting retest of support.
Entry: $4,081 – $4,086
Stop Loss: $4,094
Take Profit 1: $4,045
Take Profit 2: $4,041
Risk–Reward Ratio: ≈ 1 : 3.4
Bias turns bullish only if price closes above $4,093.
🌐 Macro Background
Gold trades above $4,100 ahead of the delayed US September NFP report, which was pushed back due to the 43-day government shutdown, the longest in U.S. history.
FXStreet notes that:
“Gold edges higher to near $4,110 as uncertainty over US jobs data and cautious sentiment support safe-haven demand.” 【FXStreet】
NFP Impact:
A weaker-than-expected jobs report would likely revive expectations for a December rate cut, boosting gold through lower yields and a softer USD.
Fed Divisions:
The FOMC Minutes showed policymakers divided—some supporting further cuts, others opposing another move in December.
Market Pricing:
The CME FedWatch Tool shows only a 30% probability of a December rate cut, sharply lower than nearly 60% last week, limiting gold’s upside.
Overall, gold’s upside remains constrained by shifting rate expectations, but uncertainty around delayed data continues to provide safe-haven support.
🔑 Key Technical Levels
Resistance: $4,081 – $4,086
Support: $4,041 – $4,045
Psychological Level: $4,100
📌 Trade Summary
Gold remains trapped between resistance at $4,081–$4,086 and support at $4,041–$4,045. Price is showing rejection at resistance, favouring a short-term bearish pullback.
Downside targets lie at $4,045 and $4,041, unless incoming NFP data triggers renewed bullish momentum.
⚠️ Disclaimer
This analysis is for reference only and does not constitute trading advice. Trading involves significant risk, and proper risk management is essential.

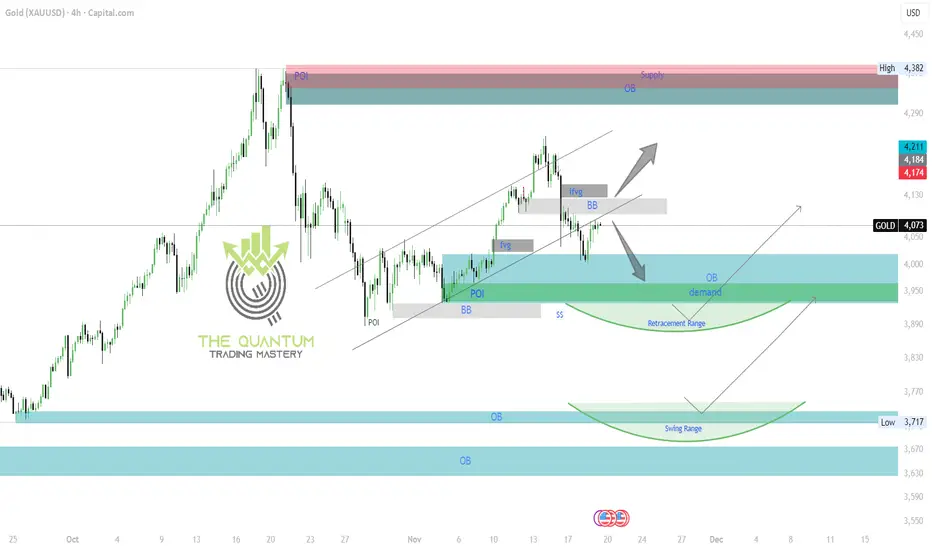
GOLD 4H CHART ROUTE MAP UPDATE & TRADING PLAN FOR THE WEEKGold 4H Analysis
On the 4H chart, price is currently moving between two major weighted levels, with an imbalance (gap) above around 4124 and another below near 4000. As long as price remains trapped between these zones, we should expect a series of side-to-side tests until one of the weighted levels breaks and holds to confirm the next directional range.
With this structure in mind, the plan remains to buy dips from our key support levels. These updated levels — including POI, BB, OB, and demand zones — help us track the move downward and catch bullish reactions as price bounces.
Scenario 1:
If price rejects from above at the BB zone at 4115–4120, we anticipate a bearish move back toward the OB + Demand zone, potentially into the Retracement Range, to sweep liquidity.
A 4H candle closing below the Demand zone around 3930 would confirm a deeper leg into the Swing Range near the 3700 levels.
If the 4H candle does not close below demand and only performs a liquidity sweep, then we expect a push to higher levels afterward.
Scenario 2:
If price cross above level, the BB zone at 4115–4120, we consider bullish and target will be above supply zone at 4330.
Note:
The Swing Range produces much larger bounces compared to our weighted levels, which is the key difference between the two.
Continue buying dips at our support levels, aiming for 20–40 pip scalps.
Each structural level we mark is designed to give 20–40 pip bounces — ideal for clean entries and exits.
Please boost, share and comment if you like the idea and analysis.
The QUANTUM TRADING MASTERY
GOLD 1H CHART ROUTE MAP UPDATE & TRADING PLAN FOR THE WEEKHey Everyone,
Please see our updated 1h chart levels and targets for the coming week.
We are seeing price play between two weighted levels with a gap above at 4114 and a gap below at 4057. We will need to see ema5 cross and lock on either weighted level to determine the next range.
We will see levels tested side by side until one of the weighted levels break and lock to confirm direction for the next range.
We will keep the above in mind when taking buys from dips. Our updated levels and weighted levels will allow us to track the movement down and then catch bounces up.
We will continue to buy dips using our support levels taking 20 to 40 pips. As stated before each of our level structures give 20 to 40 pip bounces, which is enough for a nice entry and exit. If you back test the levels we shared every week for the past 24 months, you can see how effectively they were used to trade with or against short/mid term swings and trends.
The swing range give bigger bounces then our weighted levels that's the difference between weighted levels and swing ranges.
BULLISH TARGET
4114
EMA5 CROSS AND LOCK ABOVE 4114 WILL OPEN THE FOLLOWING BULLISH TARGETS
4175
EMA5 CROSS AND LOCK ABOVE 4175 WILL OPEN THE FOLLOWING BULLISH TARGET
4232
EMA5 CROSS AND LOCK ABOVE 4232 WILL OPEN THE FOLLOWING BULLISH TARGET
4289
EMA5 CROSS AND LOCK ABOVE 4289 WILL OPEN THE FOLLOWING BULLISH TARGET
4361
BEARISH TARGETS
4057
EMA5 CROSS AND LOCK BELOW 4057 WILL OPEN THE FOLLOWING BEARISH TARGET
4006
EMA5 CROSS AND LOCK BELOW 4006 WILL OPEN THE FOLLOWING BEARISH TARGET
3965
EMA5 CROSS AND LOCK BELOW 3965 WILL OPEN THE SWING RANGE
3923
3861
As always, we will keep you all updated with regular updates throughout the week and how we manage the active ideas and setups. Thank you all for your likes, comments and follows, we really appreciate it!
Mr Gold
GoldViewFX

Gold price analysis November 19Gold is showing a very positive reaction around the large-frame trendline, where buying pressure is quite strong. The break of the key resistance zone 4080 has opened up a new bullish momentum and sent the market straight towards the psychological level of 4100. The bullish structure is more clearly consolidated and the current momentum is targeting the resistance zone 4145 – the upper range of today's trading session.
The previous BUY setups have worked out well, especially the position from 4075 which has given impressive profits. The overall trend remains in favor of the buyers while the important support zones continue to be well defended.
💡 Reference strategy:
Current BUY around 4090
BUY when price rejection signal at support 4080
BUY DCA when price breaks 4103
Target: 4175 – even extend to 4200
Risk: trend invalidated if price breaks trendline and closes candle below 4050

Gold pullbacks present buying opportunities.The gold pullback has ended, with a steady rebound after retracing to the 4000 psychological level, forming an upward trend.
Therefore, the strategy should focus on buying, following the mainstream trend.
From the current price action, the 4100 resistance level has been broken and has now become support. The Fibonacci retracement level also shows the 0.382 Fibonacci retracement is around 4092.
The 1-hour moving average for gold has turned upwards, indicating continued upward momentum. After breaking and stabilizing above 4100, gold is now steadily rising on the 1-hour chart. The 4090 area has formed short-term support, and a pullback to the 4090-4100 range presents a buying opportunity.
Therefore, we simply need to wait for a pullback to the 4090-4100 range to buy.
I personally believe the US session will provide such an opportunity.

XAUUSD - Time to buy gold...XAUUSD was recently in a short term downtrend for a few weeks but has now shown some clear bullish movements ahead. XAUUSD (Gold) has broken out of a downward trend channel that was acting as strong resistance, The price is very likely to head to the next strong resistance level which is marked as the take profit zone (green line). Time to buy!

Gold bulls launch a counterattack!
news:
On Wednesday (November 19), spot gold rose modestly for the second consecutive trading day, attempting to extend the previous day's rebound from the psychological level of nearly $4,000 per ounce, and is currently trading around $4,100. Overnight declines in Wall Street stocks indicate that market concerns about the US economy have led to fragile risk sentiment, putting dollar bulls on the defensive.
This, coupled with the ongoing geopolitical risks stemming from the Russia-Ukraine conflict, has become a key factor supporting the rise of the safe-haven precious metal.
technology:
From an hourly perspective, the $4,100 level may become a direct resistance level. If it can be effectively broken, it may trigger short covering and push gold prices to test the intermediate resistance of $4,150-$4,145, and then move towards the $4,200 mark.
Signal:
buy:4075-4080 SL:4065 TP:4140-4175

Gold Strategy 11/18: Break this Points gold will more FALL📝 GOLD TRADING PLAN – Nov 18
1. Market Context
Price is moving around 4030–4040 after a bearish BMS break.
Main structure: corrective bounce within a broader liquidity-seeking environment.
Expectation: liquidity sweep → reaction → directional move.
2. Key Trading Zones (from chart)
🔽 BUY ZONES
Primary Buy Zone
3982 – 3980
→ SL: 3977
Strong confluence (trendline + OB + support).
Deep Buy Zone
3927 – 3920 (OB zone)
→ SL below 3920
Only active if price sweeps below 3980 and continues lower.
🔼 SELL ZONE
Primary Sell Zone
4056 – 4058
→ SL: 4061
Strong confluence: FVG + resistance + liquidity sweep zone.
Sell Targets
TP1: 4000
TP2: 3980
TP3: 3930 (only if heavy news-driven volatility)
3. Expected Price Scenarios
Scenario 1 – Most Probable
🔹 Price retests trendline → minor bounce → pushes into 4056–4058
🔹 Sell from that zone → target 4000 → 3980
Scenario 2 – Secondary
🔹 Price drops first → reaches 3982–3980
🔹 Look for bullish reaction → Buy → retest 4040–4050
Scenario 3 – High-volatility Move (News Impact)
🔹 If price breaks below 3980 decisively → drops toward 3927–3920
🔹 Strong Buy zone → expect reversal back into 4000–4030
4. News Impact – Nov 18
High-impact events today:
FED speakers: Waller, Barr, Barkin (10:00pm–11:00pm)
→ Strong volatility expected on gold.
President Trump Speaks – 6:00am
USD Housing Starts – 8:15pm
🔔 Notes:
Avoid large positions before major speeches.
Keep SL tight; gold reacts aggressively to USD news.

An upward trend line has formed,be wary of a breakout above 4100#XAUUSD TVC:GOLD OANDA:XAUUSD
The intraday short limit order has been closed with profit, but there is still some room for a short-term pullback. The hourly chart shows an upward trend line below, with the 4H middle line converging with the MA5 and MA10 moving averages around 4077. The hourly moving averages also point to around 4077, which is also a previous area of dense trading volume, and may provide some support in the short term. Therefore, if gold prices pull back to 4082-4077 during the European session, I think we can try to go long on gold with a small position.

Gold Roadmap => Short-termGold ( OANDA:XAUUSD ) is currently moving below the Support zone($4,053 – $4,025) , but given the cluster of supports ahead , we can consider this beak is a fake break .
From an Elliott Wave perspective, it seems that gold has completed its wave 5 near the support lines , and we can anticipate a corrective upward movement .
Also, we can observe positive Regular Divergence (RD+) in consecutive valleys.
I expect Gold to rise to the Resistance zone($4,125 – $4,097) in the next step after breaking the Resistance lines and confronting the $4,073 level .
First Target: $4,091
Second Target: $4,113
Stop Loss(SL): $3,987
Please respect each other's ideas and express them politely if you agree or disagree.
Gold Analyze (XAUUSD), 1-hour time frame.
Be sure to follow the updated ideas.
Do not forget to put a Stop loss for your positions (For every position you want to open).
Please follow your strategy; this is just my idea, and I will gladly see your ideas in this post.
Please do not forget the ✅ ' like ' ✅ button 🙏😊 & Share it with your friends; thanks, and Trade safe.

XAUUSD – Clean 1H Demand + 4H Support Reaction
Bias
Bullish short-term after price tapped a strong 1H demand zone that aligns perfectly with 4H support.
Why I Took This Setup
Price returned to a fresh 1H demand zone
Same level is a 4H support, giving stronger confluence
Liquidity was taken below the zone before the rejection
Strong bullish reaction + momentum shift on lower timeframes
Trade Plan
Entry: Inside the refined 1H demand zone
SL: Below the zone
TP: Next major swing high
Reasoning
Market grabbed liquidity, tapped a clean zone, and showed immediate strength. Structure is now pushing upward with clear bullish intention.

Gold: Fakeout Completed, Pennant Target is on goingHi guys!
Gold just completed a textbook sequence of bearish structures. After the strong drop that formed the flagpole, price consolidated inside a pennant pattern. This type of setup typically continues in the direction of the prior move, and the measured target sits around $3,946, which aligns with your highlighted zone.
Before breaking lower, price formed an inverse head and shoulders, the reaction to the target of this pattern happened and we saw a clear fakeout right above the trendline.
As long as Gold stays below this broken trendline, the expectation is for a retest/rejection, followed by continuation toward the pennant’s full target.
The overall structure still favors the downside unless the market reclaims the fakeout region convincingly.
Disclaimer: As part of ThinkMarkets’ Influencer Program, I am sponsored to share and publish their charts in my analysis.

XAU/USD 19 November 2025 Intraday AnalysisH4 Analysis:
-> Swing: Bullish.
-> Internal: Bullish.
Analysis and bias remains the same as analysis dated 20 October 2025.
Price has printed as per previous intraday expectation by printing a bearish CHoCH which indicates, but not confirms, bullish pullback phase initiation.
Price is currently trading within an established internal range, however, I will continue to monitor price with regards to depth of pullback.
Intraday expectation:
Price to continue bearish, react at either discount of 50% internal EQ, or H4 supply zone before targeting weak internal high priced at 4,380.990.
Note:
The Federal Reserve’s sustained dovish stance, coupled with ongoing geopolitical uncertainties, is likely to prolong heightened volatility in the gold market. Given this elevated risk environment, traders should exercise caution and recalibrate risk management strategies to navigate potential price fluctuations effectively.
Additionally, gold pricing remains sensitive to broader macroeconomic developments, including policy decisions under President Trump. Shifts in geopolitical strategy and economic directives could further amplify uncertainty, contributing to market repricing dynamics.
H4 Chart:
M15 Analysis:
-> Swing: Bullish.
-> Internal: Bullish.
As per analysis dated 14 November 2025, price has printed a bearish CHoCH to indicate, but not confirm bearish pullback phase initiation.
Price is currently trading within an established internal range.
Intraday expectation:
Price to trade down to either discount of 50% internal EQ, or M15 demand zone before targeting weak internal high, priced at 4,245.195
Note:
Gold remains highly volatile amid the Federal Reserve's continued dovish stance, persistent and escalating geopolitical uncertainties. Traders should implement robust risk management strategies and remain vigilant, as price swings may become more pronounced in this elevated volatility environment.
Additionally, President Trump’s tariff announcements, particularly against China, are expected to further amplify market turbulence, potentially triggering sharp price fluctuations and whipsaws.
M15 Chart:

GOLD HIGH PROBABILITY BUY SOON!!!🚨 XAUUSD HIGH PROBABILITY BUY SETUP 🚨
* Here We Can See Clearly The Next Potential Moves For GOLD Coming Hours.
* Keep Your Eyes Close On Your Trading Positions.
* Happy PIP Hunting Traders.
FXKILLA.

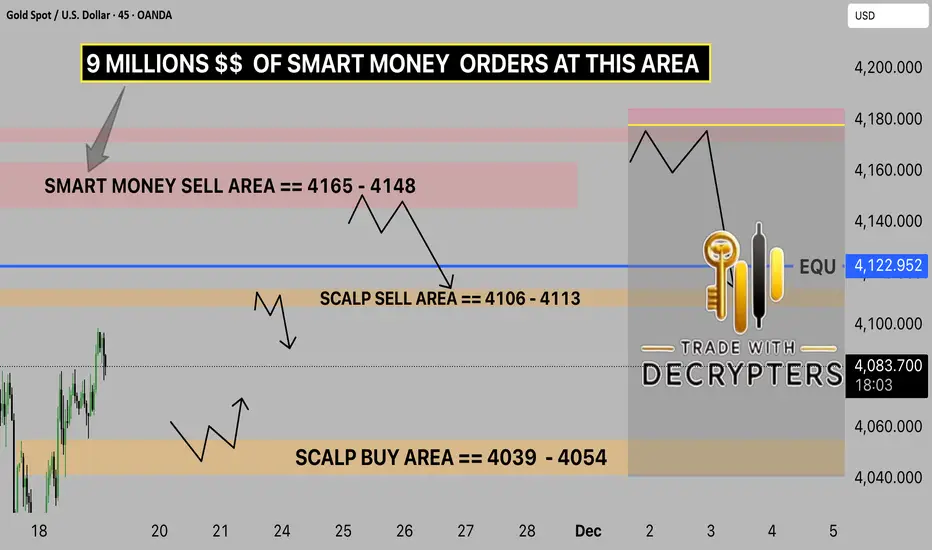
GOLD Analysis (Nov 19, 2025) - Key Levels for BreakoutOANDA:XAUUSD GOLD ANALYSIS What’s Moving the Market Today? (November 19, 2025)
Welcome back to Trade with DECRYPTERS, where we turn complex charts into clean buy & sell zones.
Keep it simple. Let levels drive your decisions.
*📰 Market Overview*
Gold dipped after failing to hold above $4,100, sliding toward the mid-range as the U.S. Dollar Index (DXY) climbs toward 99.55. Expectations for a December rate cut weaken (now ~47%), adding pressure on metals.
*Key fundamentals driving today’s volatility:*
📈 DXY rebound → reduces short-term gold momentum
🏦 Fed hawkish tone after October’s cut; policymakers want “pause & observe”
📉 Shutdown-related data blackout = mixed signals + unpredictable volatility
🌍 Geopolitical tensions (US–China tariffs, Mideast, Ukraine-Russia) continue to anchor safe-haven flows
🏛 Central banks still buying: Q3 +220t, Poland +67t YTD
*📊 ETF flows:*
ETF flows hit a record +222t in Q3, but November is seeing mild outflows even as AUM holds near $472B. It’s like investors took a big bite earlier, but are now nibbling less while still keeping most of their gold on the table.
*📆 What’s Ahead Key Events to Watch*
🔸 FOMC Meeting – Dec 10
Odds remain mixed with a slight hawkish tilt; any surprise tough tone could pressure gold short-term.
🔸 Data Blackout Continues
With CPI/NFP still imputed, November data may drop in clusters, triggering sudden volatility spikes.
🔸 Geopolitical Risk Premium
Escalation brings instant safe-haven demand, while de-escalation boosts DXY and pushes gold lower.
🟩 *GOLD TECHNICAL LEVELS*
By analyzing the #Gold chart on the 4H timeframe, we can see that after dropping to 3998 dollars, price found strong demand and has now climbed back up to around 4050 dollars.
*Whats NEXT ON GOLD ?* 👀👀
🎯 EQUILIBRIUM: 4122.95
Hold above = bullish momentum toward 4148
Stay below = re-test 4054 & possibly sweep 4039
🟩 📌 SCALP BUY AREA: 4039 – 4054
Strong intraday support + previous demand footprint.
🟥 📌 SCALP SELL AREA: 4106 – 4113
Expected rejection zone first reaction area.
🚨 📌 SMART MONEY SELL AREA: 4165 – 4148
CONCLUSION:-
Gold remains in a tight battle between demand at 4039–4054 and rejection zones near 4106–4113, with EQ at 4122.95 acting as the true directional trigger. Holding below EQ favors a pullback toward 4054/4039, while a clean break above opens momentum toward 4148–4165. Overall, range-bound with a slight downside bias until EQ is reclaimed.
*Please support me with your likes and comments to motivate me to share more analysis with you and share your opinion & chart with me !*
*Best Regards , M.MOIZ KHATTAK | FOUNDER OF TRADEWITHDECRYPTERS*
GOLD BOUNCES FROM $4,000 - FOMC MINUTES TODAY!💰 GOLD BOUNCES FROM $4,000 - FOMC MINUTES TODAY! 📈
Current Price: $4,085 - $4,090 🟢
Opening Price: $4,079
Yesterday's Close: $4,066 (+0.56%)
Today's Performance: +0.56% ✅
Status: 🟢 RECOVERY MODE - CRITICAL DAY
🚨 MAJOR EVENT TODAY - FOMC MINUTES! ⚡
THE $4,000 SUPPORT HELD! Gold successfully defended the critical psychological level and is now bouncing. But TODAY is the most important day this week!
What's Happening:
✅ $4,000 Support HELD - Bulls defended successfully!
✅ Morning Star Pattern Formed - Bullish reversal signal at support
✅ FOMC Minutes TODAY - Will determine next major move
✅ NFP Data Thursday - First post-shutdown jobs report
✅ Risk-Off Sentiment - Safe-haven flows supporting gold
✅ Expected to RISE - Analysts forecast upward movement
📊 TECHNICAL ANALYSIS
Market Structure: BULLISH RECOVERY 🟢🟢
Gold has bounced off the ascending trendline AND the $4,000 psychological level - a DOUBLE support confluence! Bulls are back in control short-term.
Key Development: Bulls managed to hold psychological level of $4,005 and formed Morning Star pattern indicating renewed buying activity
Critical Support Levels (Defended!) 🔵
Support 1: $4,050 - $4,060 (Current base - Strong)
Support 2: $4,000 - $4,005 (HELD! Psychological + Trendline)
Support 3: $3,987 - $4,002 (November open)
Support 4: $3,965 (November 6 low)
Support 5: $3,930 (Major support)
Key Resistance Levels (Recovery targets) 🔴
Resistance 1: $4,096 - $4,100 (KEY - 50-day MA + Descending trendline)
Resistance 2: $4,112 - $4,120 (20-day SMA - Strong)
Resistance 3: $4,140 - $4,150 (Major barrier)
Resistance 4: $4,170 - $4,212 (Previous descending trendline)
📈 TECHNICAL INDICATORS
RSI (14): 49 (Neutral - Can move either direction) ⚪
MACD: Rising sharply, approaching zero line (Bullish momentum!) 🟢
MFI: Growing - Liquidity inflow into asset ✅
4H RSI: Bounced up but below 50 (Recovery attempt) ⚡
Moving Averages:
Price broke above 100-day MA ✅
Testing 50-day MA at $4,096 🔴
20-day SMA at $4,112 (Resistance) 🔴
Above ascending trendline ✅
VWAP & SMA20: Aligned with market price - Equilibrium between buyers/sellers
🎯 TODAY'S TRADING STRATEGIES
SCENARIO 1: BULLISH BREAKOUT 🟢 (60% Probability)
On November 20, 2025, price of XAU/USD expected to RISE
IF Gold Breaks Above $4,100:
Break of descending trendline and 50-day MA around $4,096 could open rally toward $4,212
LONG Setup:
Entry: Break and close above $4,100-$4,112
Targets:
TP1: $4,140 📍 (+40 pips)
TP2: $4,170 📍 (+70 pips)
TP3: $4,212 📍 (+112 pips - Previous trendline touch)
Stop Loss: $4,065 (Below support)
Risk/Reward: Excellent 1:3+ ratio ✅
SCENARIO 2: FALSE BREAKOUT / REJECTION 🔴 (30% Probability)
IF Gold Gets Rejected at $4,096-$4,112:
Bulls tried but failed - retest of support coming
SHORT Setup (Scalp):
Entry: Rejection at $4,100-$4,112 (confirmed with bearish candle)
Targets:
TP1: $4,065 📍
TP2: $4,050 📍
TP3: $4,000 📍 (Retest)
Stop Loss: $4,125 (Tight!)
⚠️ WARNING: This is counter-trend - use small positions!
SCENARIO 3: FOMC VOLATILITY 📊 (10% Probability)
IF FOMC Minutes Cause Whipsaw:
Strategy: WAIT for Clear Direction
Let the dust settle after FOMC release
Trade the REACTION, not the news
Entry: After 30-60 minutes of FOMC release
Follow the momentum with trend
💎 BEST TRADE SETUPS FOR TODAY
CONSERVATIVE APPROACH (Highly Recommended!) 🎯
WAIT FOR FOMC MINUTES! Don't trade BEFORE the release.
Setup A - Breakout Play (Preferred):
WAIT for FOMC minutes (Today, US session)
IF gold breaks $4,100-$4,112 with volume
Entry: $4,105-$4,112 (after confirmation)
Target: $4,140 → $4,170 → $4,212
SL: $4,080
Why: Riding institutional momentum
Setup B - Dip Buy:
IF gold pulls back to $4,050-$4,060
Entry: $4,052-$4,060 (on bounce)
Target: $4,100 → $4,120
SL: $4,035
⚠️ DO NOT TRADE during first 30 min after FOMC release! Wait for clarity!
🌍 FUNDAMENTAL ANALYSIS
TODAY'S MAJOR EVENTS 📅
🔥 FOMC MINUTES (US Session - CRITICAL!)
This is THE event today. Will show:
Fed's thinking on December rate cut
Concerns about economy post-shutdown
Inflation outlook
Market waiting for FOMC Minutes release and speech by Fed member John Williams
Thursday: NFP Data (First post-shutdown report)
September NFP expected: +50,000 jobs
Unemployment Rate: 4.3% (forecast)
This could be market-moving!
BULLISH FACTORS ⬆️⬆️
✅ $4,000 Support Held - Technical strength confirmed
✅ Morning Star Pattern - Bullish reversal at support
✅ Risk-Off Sentiment - Stocks falling, gold rising
✅ Softer Treasury Yields - Making gold more attractive
✅ Shutdown Concerns - Economic weakness = gold support
✅ Analysts predict gold may reach $4,456-$4,509 by end November
✅ Central banks targeting 750-900 tonnes purchases for 2025
BEARISH RISKS ⬇️
⚠️ Hawkish FOMC - If minutes show Fed reluctant to cut rates
⚠️ Strong NFP Thursday - Would reduce rate cut odds
⚠️ Resistance at $4,100-$4,112 - Strong technical barrier
⚠️ December Rate Cut Odds - Only 43% (down from 63%)
⚠️ DXY Still Above 99.50 - Dollar maintaining strength
🔥 MARKET SENTIMENT: CAUTIOUSLY BULLISH
What's Different Today:
The $4,000 level held perfectly - this is VERY bullish technically. But FOMC minutes could change everything in minutes!
Analyst Views:
Short-term (Today/Tomorrow):
$4,000 held, bulls need acceptance above $4,100 for rally to gather steam. FOMC minutes will determine direction.
This Week:
Critical - FOMC + NFP data will set tone for rest of November
Month End:
IF recovery continues → $4,200-$4,300 possible
IF rejected at $4,100 → Chop between $4,000-$4,100
💡 PROFESSIONAL GAME PLAN
For DAY TRADERS:
⚡ Wait for FOMC!
Do NOT trade 1 hour before release
Do NOT trade first 30 min after release
After dust settles, trade the direction
Use tight stops (whipsaws common)
For SWING TRADERS:
📊 This is Your Setup!
IF $4,100 breaks with FOMC → GO LONG (hold 3-5 days to $4,170+)
IF rejected at $4,100 → WAIT for next dip to $4,000
Target: $4,212 (1-2 week hold)
For LONG-TERM INVESTORS:
💎 Accumulation Zone
$4,000-$4,080 range is BUYING opportunity
Long-term targets: $4,500-$5,000 (2026)
Strategy: Build position gradually
Vision: Multi-month hold
📅 TODAY'S TIMELINE
Asian Session (Done): Gold bounced to $4,085-$4,090 ✅
European Session (Now): Consolidation before FOMC
US Session: FOMC MINUTES RELEASE 🔥🔥🔥
After FOMC: Big volatility expected - direction determined
Tomorrow (Thursday):
NFP Data (September) - First post-shutdown
This will confirm or reverse today's move
🎬 BOTTOM LINE (TL;DR)
Price: $4,085 (Bouncing)
Bias: 🟢 BULLISH (IF breaks $4,100)
Key Level: $4,100 (Break = Rally | Reject = Chop)
Today's Event: FOMC MINUTES (Trade-defining!)
Best Action: WAIT for FOMC, then trade the breakout
Risk Level: HIGH (Event volatility!)
🔔 THE $4,100 LEVEL - TODAY'S BATTLEGROUND!
IF GOLD BREAKS ABOVE $4,100-$4,112:
✅ Bulls win!
✅ Target $4,140 → $4,170 → $4,212
✅ Possible rally to $4,250+
✅ GO LONG after confirmation
IF GOLD REJECTS AT $4,100:
⚠️ Bulls stall
⚠️ Range between $4,000-$4,100 continues
⚠️ Wait for next setup
⚠️ Don't force trades
FOMC DECIDES EVERYTHING!
📊 Dovish = GOLD UP 🚀
📊 Hawkish = GOLD DOWN/SIDEWAYS 📉
📊 TECHNICAL OUTLOOK
Trend: 🟢 BULLISH (Short-term recovery active)
Momentum: IMPROVING - MACD rising 📈
Support: HOLDING at $4,050-$4,060 ✅
Resistance: TESTING at $4,096-$4,112 🎯
Pattern: Morning Star reversal + Trendline bounce
Next Move: Break $4,112 = UP | Reject = CHOP
Key Technical:
Having bounced off ascending trendline and $4,000, gold broke above 100-day MA and now testing descending trendline/50-day MA confluence
⚠️ RISK MANAGEMENT - FOMC DAY!
✅ Wait for FOMC - Don't guess the news!
✅ Small Positions - Risk MAX 1% (High volatility!)
✅ Wide Stops - Give trades room (40-50 pips)
✅ Quick Profits - Lock gains on FOMC spikes
✅ No Revenge - If wrong, accept and move on
🎯 SWING TRADE SETUPS
Setup A - FOMC Breakout (Recommended):
WAIT for FOMC minutes release
Entry: IF breaks $4,112 (after FOMC)
Target 1: $4,170 (Hold 2-3 days)
Target 2: $4,212 (Hold 5-7 days)
Target 3: $4,250 (Hold 1-2 weeks)
Stop Loss: $4,070
Setup B - Rejection Trade:
Entry: IF rejected at $4,100 (after FOMC)
Target 1: $4,050 (Hold 1-2 days)
Target 2: $4,000 (Hold 2-3 days)
Stop Loss: $4,125
🏆 PROFESSIONAL ANALYSIS SUMMARY
Gold has executed a PERFECT TECHNICAL BOUNCE from the $4,000 psychological level. The formation of a Morning Star candlestick pattern at support is a classic bullish reversal signal.
The Setup:
Price trading at $4,085.62 as of 19.11.2025
Held $4,000 support perfectly (double bottom with trendline)
Now testing critical $4,096-$4,112 resistance zone
FOMC minutes today will determine next major move
Most Likely Scenarios:
Scenario 1 (60%):
FOMC shows Fed concerned about economy → Gold breaks $4,112 → Rally to $4,170-$4,212
Scenario 2 (30%):
FOMC shows Fed staying hawkish → Gold rejected at $4,100 → Range $4,000-$4,100 continues
Scenario 3 (10%):
FOMC very dovish → Gold explodes through $4,212 → $4,250+
The Big Picture:
$4,000 holding is VERY bullish. This was the make-or-break level and bulls defended it perfectly. If FOMC is dovish or neutral, gold has clear path to $4,200+
💪 TRADING PSYCHOLOGY TIP
THE BOUNCE IS HERE!
Yesterday we were at $4,000 and scared. Today we're at $4,085 and hopeful. This is why you MUST have a plan and stick to it. Those who bought at $4,000 yesterday are now profitable. Discipline wins! 🎯
🎓 LESSON: THE MORNING STAR PATTERN
What happened at $4,000:
Day 1: Long bearish candle (fear)
Day 2: Small candle (indecision)
Day 3: Long bullish candle (bulls return)
This is a Morning Star - one of the most reliable bullish reversal patterns! It shows bears exhausted and bulls taking control.
Trading Strategy:
When you see this at major support (like $4,000), it's a HIGH probability long setup!
🔮 FORECAST
Today: FOMC minutes → Breakout $4,112 OR rejection
Tomorrow: NFP data → Confirm today's direction
End of Week: $4,140-$4,170 OR back to $4,000
Next Week: Recovery continues to $4,200+ if $4,100 breaks
Month End: $4,250-$4,300 (IF bullish scenario plays out)
🚨 FOMC MINUTES - WHAT TO WATCH FOR
Dovish Signals (Gold UP 🟢):
Concerns about economic weakness
Mentions of shutdown impact
Opens door to December cut
Worries about labor market
Hawkish Signals (Gold DOWN/FLAT 🔴):
Confidence in economy
Inflation still concerning
No urgency to cut rates
Strong labor market comments
Neutral (Gold CHOP ⚪):
Data-dependent language
Wait-and-see approach
No clear direction
📊 SUPPORT/RESISTANCE SUMMARY
Strong Support: $4,050, $4,000 (CRITICAL)
Weak Support: $4,065, $4,040
Weak Resistance: $4,096, $4,100
Strong Resistance: $4,112, $4,140, $4,170, $4,212
Breakout Level: $4,112 (Game changer!)
Breakdown Level: $4,000 (Would be very bearish)
⚠️ FINAL DISCLAIMER
Today is a high-impact event day. FOMC minutes can cause extreme volatility and rapid price swings. This analysis is for educational purposes only. Never trade the news blindly - wait for confirmation. Use stop losses religiously. Position sizes should be smaller than normal on event days. False breakouts are common immediately after news. The first move after FOMC is often NOT the real move. Past performance does not guarantee future results. Consult a licensed financial advisor before trading.
📱 CRITICAL DAY AHEAD!
💬 FOMC minutes in few hours!
🔔 HIGH volatility expected
⚡ Trade the reaction, not the prediction!
🙏 Be patient, be disciplined!
#Gold #XAUUSD #FOMC #ForexTrading #TechnicalAnalysis #NFP #MorningStar #BullishReversal #EventTrading #RiskManagement #FOMCMinutes #MarketAnalysis #DayTrading #SwingTrading
GOLD XAUUSD PROFITS Gold has held on to the structure and will continue to follow its trend to the upside for more trades to be taken

GOLD H1 – Trump’s Fed Comments Shake Market Sentiment🟡 XAUUSD – Intraday Smart Money Plan | by Ryan_TitanTrader (19/11)
📈 Market Context
Gold is trading in a tight corrective structure as markets react to breaking headlines that Donald Trump is considering removing Fed Chair Jerome Powell.
This news injects uncertainty into Fed policy expectations, causing short-term volatility in USD and positioning gold at a critical decision zone.
• Trump’s comments increase speculation about a potential policy shift, which may temporarily weaken USD sentiment.
• However, gold remains capped below the premium supply zone as institutional flows continue to engineer liquidity sweeps.
• Price is hovering near $4,080 ahead of key Fed-related discussions, keeping both sides of liquidity active.
Institutional order flow suggests controlled accumulation at the discount range while premium regions remain defended by sellers.
🔎 Technical Analysis (1H / SMC Structure)
• Structure: Price is forming a short-term distribution pattern after multiple BOS events from the 4150 breakdown.
• Premium Sell Zone: 4109–4111, aligning with unmitigated supply and internal liquidity pockets.
• Discount Buy Zone: 4009–4007, sitting inside a clean demand block + previous sell-side sweep.
• Liquidity:
→ Buy-side liquidity sits above 4111, where equal-high clusters form.
→ Sell-side liquidity rests between 4007–4000, where earlier long positions were cleared.
🔴 Sell Setup (Premium Reaction Zone)
• Entry: 4109 – 4111
• Stop-Loss: 4119
• Take-Profit:
→ 4055 (minor inefficiency)
→ 4028 (BOS retest)
→ 4009–4007 (discount demand)
📌 Execute only after a liquidity sweep into the zone + bearish CHOCH on M5–M15.
🟢 Buy Setup (Discount Reaction Zone)
• Entry: 4009 – 4007
• Stop-Loss: 4000
• Take-Profit:
→ 4040 (short-term range high)
→ 4075 (inefficiency rebound)
→ 4105/4110 (premium retest)
📌 Valid if price sweeps 4007 and shows bullish displacement.
⚠️ Risk Management Notes
• Expect volatility as traders react to Trump’s comments on Fed leadership.
• Avoid trading in the 4030–4080 chop zone without a clear structural break.
• Reduce position size during impulsive spikes around USD sentiment shifts.
• Trail stops once price clears each liquidity pocket.
📝 Summary
Gold is being influenced heavily by uncertainty around Trump’s remarks about replacing Fed Chair Powell. Liquidity is building at both extremes, offering clean opportunities at the edges of the range.
• Sell Zone: 4109–4111 (premium supply)
• Buy Zone: 4009–4007 (discount accumulation)
Expect a manipulation → reaction → continuation pattern as institutions play both sides of the current structure.
📍 Follow @Ryan_TitanTrader for more Smart Money updates.
🎁 Gifts in BIO for traders who follow daily plans.

XAUUSD – High-Impact Levels to Dominate the Day🌐 MARKET CONTEXT
Gold opens today in a compression phase after a high-volatility session yesterday, where both premium and discount liquidity pools were partially swept. Despite this, the market structure on M30 remains intraday bearish, with price continuously rejecting premium supply while building liquidity below.
Recent Drivers:
USD strengthened modestly following hawkish comments from Fed speakers
Market remains in “wait mode” ahead of upcoming PMI and inflation data
Safe-haven demand is neutral → no strong fundamental bias, giving technicals more influence
Sentiment Outlook:
London session: Liquidity grabs likely on both sides before directional movement
NY session: Expected expansion after liquidity sweep
Bias: Bearish intraday unless discount zones trigger a structure shift
Gold is currently trading in the middle of the intraday range, meaning entries must be placed at premium or deep-discount liquidity zones only.
📉 TECHNICAL ANALYSIS (SMC + LIQUIDITY)
Market Structure
Current structure: Lower High → Lower Low
M30 equilibrium → 4135–4140
Price hovering under potential inducement levels near 4170–4180
Multiple unmitigated OBs match today’s entries
Liquidity Map
Buy-side liquidity (BSL): above 4176
Mini BSL: above 4147
Sell-side liquidity (SSL): below 4116 and deeper at 3993
Clear liquidity pockets for engineered wicks and traps
Imbalance (FVG)
Bearish FVG at 4176–4178 → optimal sell zone
Small discount imbalance at 4116–4118 → scalp buy reaction zone
Deep imbalance around 3993–3995 → strong liquidity magnet for later sessions
🔑 KEY PRICE ZONES (With Captivating Explanations)
4178–4176 ▶️ Premium Supply – High Probability Sell Zone
Large premium imbalance + unmitigated bearish OB + BSL inducement above.
This is where institutions typically offload positions before pushing price lower.
4148–4147 ▶️ Scalp Sell Zone – Minor Liquidity Trap
Previous sweep zone with compressed liquidity.
Expect a quick reaction as price hunts micro-BSL then rejects.
4118–4116 ▶️ Discount Buy Zone – Scalping Reaction Point
Mitigation of bullish micro-OB + SSL liquidity resting below.
Perfect for small intraday bounces or CHoCH attempts.
3995–3993 ▶️ Deep Discount Buy Zone – High-Value Liquidity Pool
Major SSL cluster + higher timeframe discount region.
If price drops this low, expect aggressive reactions and potential intraday reversal.
⚙️ TRADE SETUPS
✅ SELL SETUP 1 – MAIN PREMIUM SUPPLY
Entry: 4178–4176
Stoploss: 4184
TP1: 4160
TP2: 4148
TP3: 4120
Logic: BSL sweep → imbalance fill → sharp rejection expected in London.
⚠️ SELL SETUP 2 – SCALPING PREMIUM REJECTION
Entry: 4148–4147
Stoploss: 4126 (Adjusted for safety as provided)
TP: 4137 – 4128 – 4120
Logic: Liquidity trap + inducement zone → ideal quick scalp.
✅ BUY SETUP 1 – SCALPING DISCOUNT DEMAND
Entry: 4118–4116
Stoploss: 4110
TP1: 4126
TP2: 4140
Logic: SSL sweep + micro CHoCH potential. Perfect scalp in NY open.
✅ BUY SETUP 2 – DEEP DISCOUNT REVERSAL
Entry: 3995–3993
Stoploss: 3987
TP1: 4010
TP2: 4040
TP3: 4110 (If strong reversal forms)
Logic: High probability liquidity reversal zone. Strong reaction expected.
🧠 NOTES / SESSION PLAN
Wait for M5/M15 confirmation before executing buys in discount zones
Avoid buying near premium zones; structure favors sell setups first
Expect stop-hunt wicks during London session
New York session likely provides the real expansion move
Avoid trading immediately after high-impact USD news
🏁 CONCLUSION
Gold remains in a bearish intraday structure on M30, with two premium sell zones (4178 and 4148) offering the best risk–reward setups.
Discount buy zones (4116 and 3993) provide high-quality countertrend reactions and potential reversals.
Trade only at extremes. Avoid mid-range noise.

Gold is going to new ATH ?
1. **Significance of This Week**: The upcoming week is crucial for price trends in gold.
2. **NFP News Impact**: Scheduled Non-Farm Payroll (NFP) news on Thursday is anticipated to significantly influence market direction.
3. **Trading Strategy**: It may be wise to wait for the NFP report before making trading decisions.
4. **Price Prediction**: If the NFP data comes in weaker than expected, there may be a potential for gold prices to rise, possibly reaching new all-time highs (ATH).
5. **Key Price Levels**: A price range of $3,800 to $4,000 is critical; if the price holds above this level, it could lead to further increases.
Let me know if you need any further analysis or insights!
