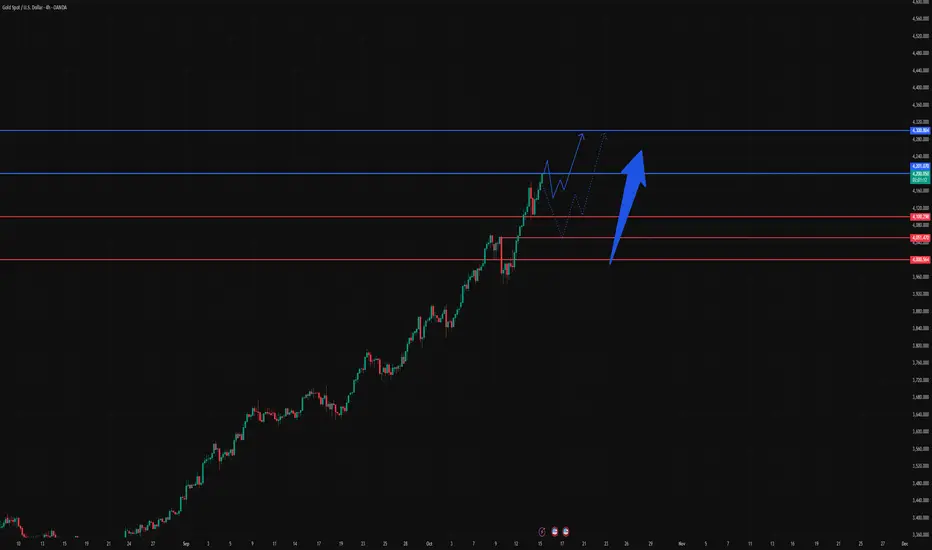
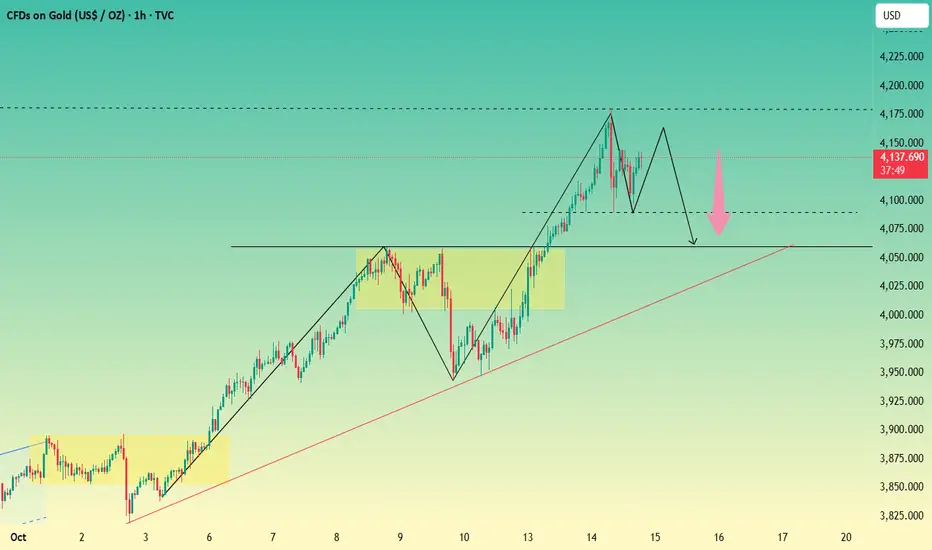
XAUUSD on Retracement overall bullish trend XAUUSD is still on bullish Bias and holding rising wedge pattern but retracement can be on strike.
What will I do Today?
✳️ currently market is bit tricky for scalpers and retailers let's assume a scanario or condition of mine .
- I'm on buy from 4190 and expecting H4 candle remains above the mentioned upper zone then hold for targets.
My target will be $4235 & 4260 In extension !!
✳️ Secondly
if any candle closes below 4180 then our buying will be postpond and we'll have retracement towards 4135 then 4110 in extension ,
Additional Tip:
-BUY the Dips
OR
Goldprediction

XAUUSD Delivered Excellent profits [ 1570 pips straight]Thanks to those traders who followed us and made profits 📈🙏 keep grinding 💪.
I booked profits on buying orders during overnight session, entering around 4142 & 4132 and exiting near 4105 while my shorter-term longs hit the 4098 target on yesterday Ny session drop.
Next I bought XAUUSD 4102 which I hold overnight and it's 1200 pips floating in profits.
Going forward, I’ll continue buying dips from my key entry zones as long as Gold holds above the bullish trend till 4170.

XAUUSD: Key levels to watch in today's trading sessionAfter a correction from 4180 → 4090, OANDA:XAUUSD rebounded strongly immediately and continued to rise to new ATH levels in today's trading session. With a strong uptrend and high volatility at the moment, we will look for intraday scalps as prices head towards support and resistance zones.
In the Options market, gold is being accepted for trading in the high value zone after the price surpassed the 4200 USD/Ounce mark with more than 320 Longcall contracts being filled at 4200 USD/Ounce.
At 4250 on the Futures market, there are more than 250 Longcall contracts being filled right now, so this will be the target that prices can aim for in today's trading session.
Update: More than 100 contracts at 4260 and 4275.
Some other support and resistance levels that we can monitor for trading in today's session:
Resistance:
Margin zone resistance:
Resistance:
Support:
Margin zone support:
Support: ,
Strong support:
Take advantage of the above support and resistance zones and trade short-term when the price reacts at these support and resistance zones.
Wait for reactions such as Engulfing candles, Doji,... at the support and resistance zones.
Always set stop losses when trading and manage risks closely.
Victor Dan @ ZuperView

The 4200 Era Is Coming — Where Will the Next Bull Run Begin?Gold has reached new highs during its rebound, breaking through the recent technical resistance at 4180. In the short term, there is no significant resistance above, and no clear peak signal has emerged, demonstrating the continued strength of the bulls.
From the current technical perspective, gold has formed a clear W-shaped double bottom structure in the short term, combining the 4090 and 4097 levels, providing support for further gains. Therefore, the deep pullback that occurred yesterday is only regarded as a technical pullback in a strong pattern, and does not change its inherent bullish logic; coupled with the support of multiple risk-averse factors in the market, under the resonance of technical and news aspects, according to the previous fluctuation range, gold is expected to continue to rise to the 4210-4230 area.
As the center of gravity of gold continues to rise, the key now is to find the next reliable support level. The current short-term support has clearly moved up to the 4155-4140 area, which is the best position for bulls to re-accumulate strength before the next breakthrough. Therefore, the 4155-4140 area is the entry area for us to focus on building long positions in gold in batches; the short-term upward target area is 4200-4210.
If you’re following this rally, don’t just watch — prepare your next move.
💬 Like & Follow for real-time updates and in-depth gold insights.
📈 Follow me for real-time gold insights &to my traders' channel for exclusive setups in bio!

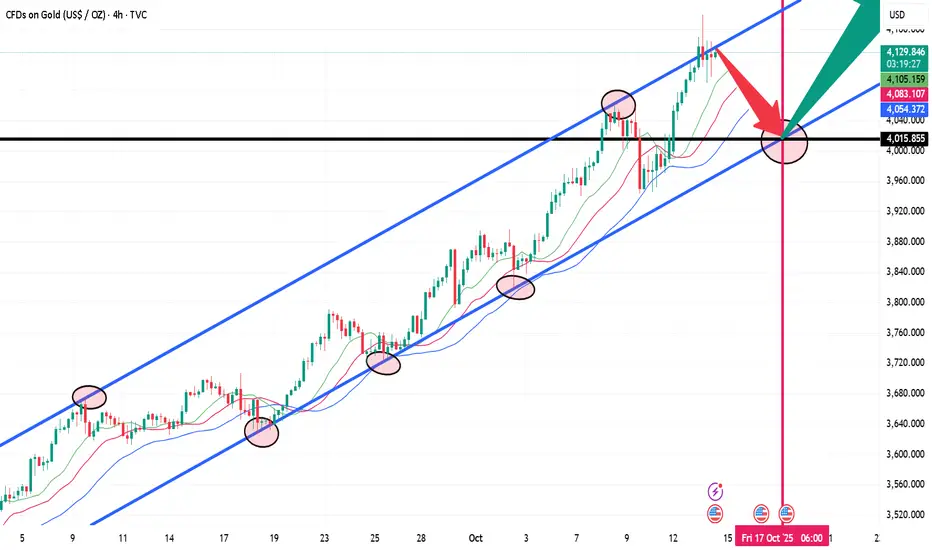
XAUUSD – Bearish Reversal Setup at Key ResistanceOANDA:XAUUSD has reached a key overextended zone after a strong bullish rally, showing signs of exhaustion near the upper boundary of the pitchfork channel. Daily candles are printing wicks into resistance, indicating potential supply.
Bearish Confluences:
Price rejection at upper pitchfork channel resistance
Extended distance from EMA ribbon (mean reversion likely)
Slowing bullish momentum with smaller daily candles
Bearish setup triggered at local resistance zone
Fibonacci Targets (retracement from recent swing low to high):
🎯 Target 1 – 0.382: $3,716
🎯 Target 2 – 0.5: $3,629
🎯 Target 3 – 0.618: $3,567
Invalidation:
Daily close above $3,895 resistance (red zone) would invalidate this setup.

Setting new highs, it is right to go long on the pullbackI reminded everyone yesterday that once the W-shaped formation is confirmed and structural support is provided for the bulls, the upward trend will continue. The final result is in line with our expectations again. Gold is still fluctuating upward. If this trend continues, it is expected to reach 4210-4230.
As the price of gold continues to rise and returns to a unilateral upward trend, the short-term highs and support are also moving up. From the perspective of the big cycle trend, the current daily MA5 moving average and the 4H middle track have also come to around 4088-4090, which is also the position that short-term bulls need to focus on defending. Before failing to effectively fall below this position, we can still maintain the bullish trend unchanged, and any decline can be regarded as an opportunity for bulls to enter the market.
Judging from the hourly chart, the current gold price has reached the 42,000 integer mark. The continuous upward fluctuation has caused the current technical indicators to enter the overbought risk zone. Do not blindly chase the rise in the short term and be alert to the market's potential correction demand. The short-term support can be seen at 4180-4165. If gold subsequently falls back to this short-term support, we can consider continuing to go long on gold.
OANDA:XAUUSD
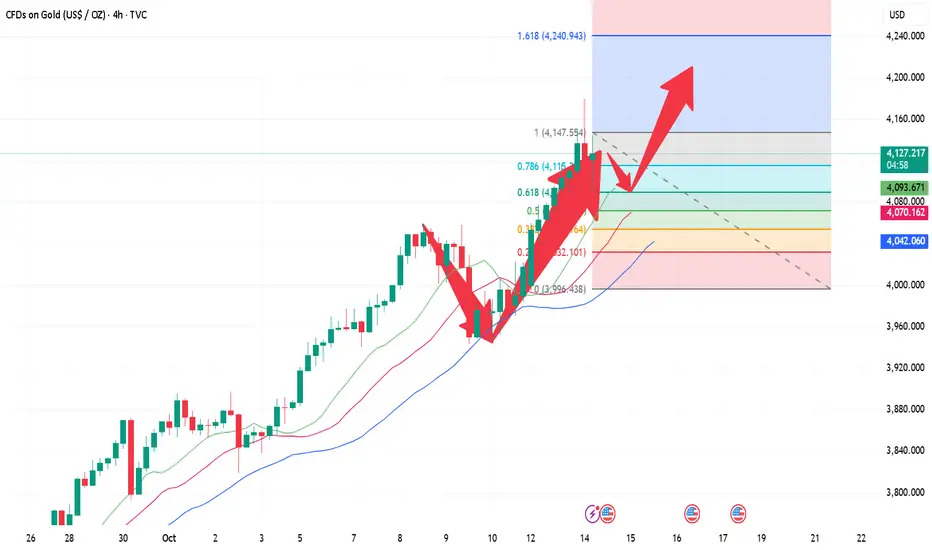
Is Gold XAUUSD due for a Retrace? VWAP & Volume Profile Plan🏆 Gold (XAUUSD) Market Update 🏆
Gold (XAUUSD) has rallied strongly and is now pushing into new highs 📈. In my view, price looks overextended — when applying the VWAP indicator, we can clearly see that price has stretched three deviations away from VWAP ⚖️.
I’m also analyzing the Volume Profile to identify value areas that could serve as key support zones on any retracement 🔍. While my overall bias remains bullish, I’d like to see price return to equilibrium — roughly the 50% retrace of the recent price swing (on the 4-hour timeframe, measured from the order block low) 📊.
Additionally, I’m observing a potential Three-Drive Pattern forming, which could hint at a short-term correction before any continuation higher 🔄.
⚠️ Disclaimer: This content is for educational purposes only and not financial advice.

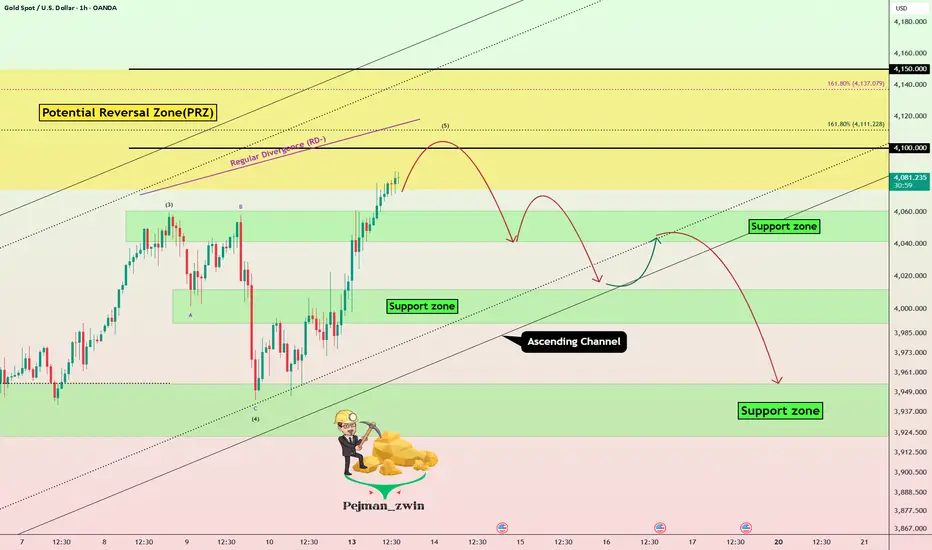
Gold Near $4,100 PRZ – Time for a Reversal?Just like we discussed last week, Gold ( OANDA:XAUUSD ) moved exactly as expected and hit its targets .
Now, as we start the new week, Gold is continuing to form a New All-Time High(ATH) and is currently near a Potential Reversal Zone(PRZ) and the $4,100 round number .
From an Elliott Wave perspective , it looks like Gold is completing wave 5, which could top out in this PRZ.
We’re also seeing a Regular Divergence(RD-) between the two consecutive peaks , which suggests that Gold might start a correction soon.
I expect Gold to begin a correction and at least drop down to the lower line of the ascending channel after breaking the Support zone($4,061 – $4,041) .
Note: If Gold breaks the lower line of that ascending channel, we can expect further downside.
Note: Also, keep in mind that Powell speaks tomorrow, which could influence Gold’s movement. As I mentioned, a bullish DXY outlook could also help push Gold lower.
Second Target: $3,963
Stop Loss(SL): $4,153(Worst)
Please respect each other's ideas and express them politely if you agree or disagree.
Gold Analyze (XAUUSD), 1-hour time frame.
Be sure to follow the updated ideas.
Do not forget to put a Stop loss for your positions (For every position you want to open).
Please follow your strategy; this is just my idea, and I will gladly see your ideas in this post.
Please do not forget the ✅ ' like ' ✅ button 🙏😊 & Share it with your friends; thanks, and Trade safe.
Gold → Bulls are strong, can they fall sharply today?Yesterday, gold opened with a volatile pullback, found support at the 4,106 level, and then staged a sharp rally. It hit an intraday high near 4,179 before crashing sharply to 4,090, subjecting both bulls and bears to intense market volatility. Especially for the bulls: after a sustained rally, market sentiment was overwhelmingly bullish—many bet on gold surging to 4,200, and some even chased the highs. However, after oscillating near 4,178, gold collapsed suddenly, breaking below the 4,100 level. This undoubtedly dealt a heavy blow to market buyers. Critically, gold rebounded but then fell again to 4,090, shifting market sentiment—only to rebound once more to the 4,140 zone, where it paused and entered a consolidation phase.
For us, who reaped substantial profits from short positions yesterday, I had long been leaning toward a gold collapse. Here’s why: gold soared over 200 points in just three days, from 3,946 last Friday to 4,179. While market news contributed to this rally, its impact was not absolute—all news has limited influence unless it continues to escalate. In reality, no such sustained escalation occurred. Additionally, although the U.S. government shutdown persists, its impact has weakened due to frequent past occurrences. Moreover, despite gold’s strong upward move, its rally lacked stability—a trend evident in the price action. There’s no such thing as an endless rally; the market was merely waiting for an opportunity or excuse to trigger a sell-off. This is why I emphasized the need to guard against a bearish collapse yesterday.
It’s undeniable that the bulls still have momentum for further gains—especially since gold tested the 4,090 level twice yesterday without breaking below it, indicating lingering bullish strength. However, Powell’s speech last night offered little actionable insight, as he did not explicitly mention whether a rate cut would be implemented in October. This has left the market struggling to form a clear forecast.
Regarding rate cuts: the U.S. government shutdown has caused a lack of economic data, leaving the Fed without sufficient references to make decisions—which could even hinder the progress of rate cuts. Additionally, tariff tensions have reignited. Even though U.S. inflationary pressures have eased somewhat, renewed tariffs could reignite inflation—a factor the Fed must consider. While there are strong calls for rate cuts within the Fed, and the U.S. labor market faces significant downside risks (which supports rate cuts to some extent), the future remains uncertain. As a result, the market has grown skeptical about rate cuts, and this skepticism will likely weaken the bullish momentum for gold to some degree.
Yesterday, we entered three short positions and one long position. The only losing trade was a short position entered at 4,147 last night. Overall, profits were quite substantial. Today, we will consider shorting gold around the 4,200 level; if 4,200 is broken, we will adjust our strategy accordingly.
For specific trading decisions, please follow my real-time updates. I post my trading ideas and strategies daily. If you lack a plan or clear direction for gold trading and struggle to achieve consistent, stable profits, you can refer to and follow my updates as a reference and guide to help you avoid mistakes.

Gold Bulls in Control — Eyes on $4,200 Breakout📰 Key Fundamental Drivers
Gold remains elevated above $4,100/oz, consolidating after recent surges.
Safe-haven demand is strong, supported by persistent U.S.-China tensions and global economic uncertainty.
Market expectations for Fed cuts remain robust, with ~99% chance priced in for October and ~94% for December.
Institutional flows (ETF & central banks) continue to add structural support.
Some caution from Fed officials about inflation and pacing of cuts could moderate upside in the near term.
📈 Technical & Price Structure
Support zones to watch: ~$4,100 → ~$4,050 → ~$4,000
Resistance / upside targets: $4,200 → $4,300 → $4,400+
Gold is in a strong uptrend, but short-term momentum is overextended. A pullback or consolidation is healthy and expected.
If price holds above support, the upside bias remains intact. A break below $4,000 would be an early warning.
🎯 Bias & Trade Strategy
Bias: Bullish overall, with caution in the short term.
Trade ideas:
Buy on pullbacks into support zones (e.g. $4,050–$4,100) with tight stops.
Breakout longs if price decisively clears $4,200.
Scalp / reaction shorts near resistance zones if rejection patterns appear.
Pay attention to upcoming U.S. data, Fed commentary, and any sudden USD strength as risk factors.
⚠️ Risk Note
Risk only 1–2% per trade
Confirm setups with volume/candle patterns
Avoid over-leveraging — gold volatility remains high
📌 For educational purposes only – Trade Smart. Athens
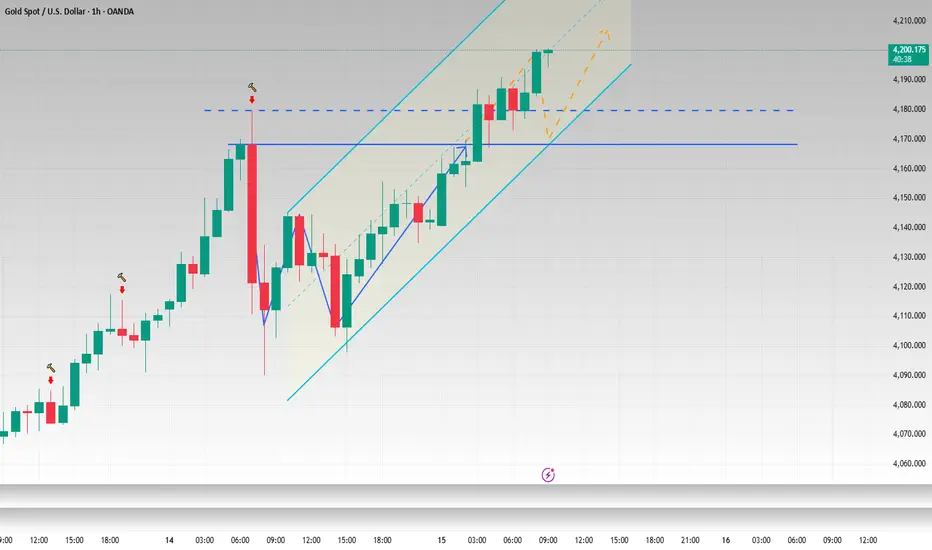
Gold (xauusd): still bullishHello guys!
Gold (XAU/USD) is showing a strong bullish trend on the 30-minute chart, but we can see that the upward trendline has recently been broken. Despite this, the price is approaching a key support zone between 4,086 and 4,058 (highlighted in blue), which has held as a strong buying area in the past.
Currently, the market could play out in two scenarios:
Blue scenario – A shallow pullback from the current price down to the support zone, followed by a rebound.
Red scenario – A slightly deeper retracement, touching the lower end of the support zone before buyers step in.
In both cases, this support area is likely to act as a strong demand zone, providing a good opportunity to enter long positions . The overall bullish trend remains intact, so the expectation is that after this retracement, the price will continue upward toward 4,180 and beyond.
✅ Key levels to watch:
Support: 4,086 – 4,058
Resistance: near 4,180 (next target)
Trading plan: Wait for the price to approach the blue support area and look for bullish confirmation (reversal candlestick, bullish engulfing, or strong buying volume) to enter long positions.
Disclaimer: As part of ThinkMarkets’ Influencer Program, I am sponsored to share and publish their charts in my analysis.

Gold as a Safe Haven Asset During Market Uncertainty1. The Historical Role of Gold as a Store of Value
Gold’s reputation as a safe haven asset is deeply rooted in history. Long before modern currencies were created, gold was used as money due to its rarity, durability, and universal acceptance. Empires and civilizations—from the Romans to the Chinese—recognized its intrinsic value. Unlike paper currencies, which can lose value due to inflation or political manipulation, gold has maintained its purchasing power over centuries. This enduring legacy has built investor confidence, making gold the ultimate hedge against economic collapse or monetary instability.
2. Gold’s Relationship with Inflation and Currency Devaluation
One of the key reasons investors flock to gold during uncertainty is its ability to preserve value during inflationary periods. When central banks print excess money or economies experience hyperinflation, the real value of currency declines. Gold, on the other hand, cannot be printed or artificially inflated. Its supply grows slowly through mining, keeping its scarcity intact. Historically, during times of high inflation—such as the 1970s oil crisis—gold prices surged as investors sought protection from declining fiat currency values.
3. Gold’s Performance During Financial Crises
Gold tends to perform strongly during financial market crises. For instance, during the 2008 Global Financial Crisis, stock markets around the world plummeted, yet gold prices surged from around $700 to over $1,200 per ounce in the following years. Investors shifted their capital from volatile equities and collapsing real estate markets into gold as a safer store of wealth. Similarly, during the COVID-19 pandemic in 2020, when uncertainty and market panic dominated, gold reached a record high of over $2,000 per ounce, reinforcing its role as a safe haven asset in times of chaos.
4. Gold’s Role in Portfolio Diversification
In investment strategy, diversification is key to managing risk. Gold often acts as an effective hedge because it has a low or even negative correlation with traditional asset classes like equities or bonds. When markets are in turmoil, stocks often decline, but gold tends to rise or remain stable. By including gold in a portfolio, investors can reduce volatility and overall risk exposure. Institutional investors, mutual funds, and even central banks include gold as a strategic component to ensure portfolio stability during downturns.
5. Gold as a Hedge Against Geopolitical Risk
Geopolitical instability—such as wars, trade conflicts, or political crises—creates uncertainty in global markets. During such times, currencies fluctuate, stock indices decline, and investor confidence weakens. Gold often becomes the preferred asset during these events because it is not tied to any one government or economy. For example, during the Russia-Ukraine conflict in 2022, global demand for gold increased as investors sought refuge from potential currency devaluation and market disruptions. Its universal acceptance makes it a neutral and borderless asset that retains value regardless of political boundaries.
6. Central Bank Policies and Their Impact on Gold
Central banks play a major role in influencing gold prices. When central banks adopt expansionary monetary policies—such as lowering interest rates or increasing money supply—gold prices often rise. Low interest rates reduce the opportunity cost of holding non-yielding assets like gold, making it more attractive to investors. Additionally, when central banks themselves buy gold, it signals trust in its long-term value. In recent years, emerging economies like China, India, and Russia have increased their gold reserves to diversify away from U.S. dollar dependence, strengthening gold’s status as a global reserve asset.
7. Investor Psychology and Market Sentiment
Gold’s appeal is not just economic—it’s psychological. During times of fear or uncertainty, investors instinctively move toward tangible assets that they can trust. Gold’s physical nature and intrinsic value give it emotional security that paper assets lack. This “flight to safety” effect means that when news of market instability spreads, investors collectively buy gold, driving up its price. This psychological factor reinforces the cycle of gold appreciation during uncertain times, as more people seek safety in an asset they perceive as stable and permanent.
8. Gold vs. Other Safe Haven Assets
While gold is the most well-known safe haven asset, others—like the U.S. dollar, Swiss franc, or U.S. Treasury bonds—also attract investors in crises. However, gold holds unique advantages. Unlike currencies, which can be manipulated through monetary policy, gold’s value is independent of any central authority. It is also free from credit risk, meaning it cannot default like bonds. Furthermore, unlike real estate or commodities like oil, gold is highly liquid and portable. This makes it an ideal asset for immediate protection and long-term wealth preservation during global financial stress.
9. Technological and Industrial Demand Supporting Gold Prices
Beyond its financial role, gold has growing industrial and technological applications, especially in electronics, renewable energy, and medical devices. Its conductivity and resistance to corrosion make it a critical material in high-tech industries. This real-world demand adds a fundamental layer of value to gold, ensuring that its price is not solely dependent on investor sentiment. Jewelry demand—especially from countries like India and China—also supports its global market stability. Together, these factors create a strong baseline for gold prices, even when financial markets are calm.
10. The Future Outlook for Gold as a Safe Haven
Looking ahead, gold’s role as a safe haven is expected to remain strong. In a world marked by rising geopolitical tensions, digital currency volatility, and potential economic slowdowns, investors will continue viewing gold as a stabilizing force. The rise of digital gold and gold-backed exchange-traded funds (ETFs) has made it easier for retail investors to participate in the gold market. Moreover, as global debt levels rise and faith in fiat currencies weakens, the demand for gold is likely to persist. Even in an increasingly digital economy, gold’s timeless appeal as a tangible, limited, and universally trusted asset ensures its continued relevance.
Conclusion
Gold’s reputation as a safe haven asset is well-deserved and time-tested. It offers protection against inflation, currency devaluation, market volatility, and geopolitical instability. Its scarcity, universal acceptance, and psychological comfort make it a unique hedge in uncertain times. Whether held by individuals, institutions, or central banks, gold continues to shine as a reliable symbol of stability and security.
In a global economy where uncertainty is the only constant, gold stands as a timeless reminder that true value endures beyond market cycles and monetary systems. For investors seeking long-term security amid financial turbulence, gold remains the ultimate safeguard of wealth.

GOLD Intraday Chart Update for 15 Oct 25GOOD Morning Traders,
As long as GOLD sustains above 4080 FMP Level it will remains bullish however the only way to join Trend Rally is following Psychological Levels with 3080 chain
Major Support zone for the day is located @ 4130-4150 below this zone GOLD will move Towards 4100 or even 4080
Above 4150 Psychological Level GOLD Next Target will be 4230 FMP Level or even 4250
Disclaimer: Forex is Risky

Gold is strong. 4200 is not far away.Gold continued its upward trend after the Asian market opened on Tuesday. It reached a high near 4180 in the European session before plummeting, quickly falling back to around 4090 before continuing its upward trend. This marked a distinct bottoming-out and rebound pattern, causing significant market volatility.
Wednesday's Asian market opened with a continuation of Tuesday's trend, reaching a new all-time high near 4191, once again approaching the 4200 mark.
Gold's current pattern makes bears vulnerable to the powerful bulls, leaving short-term bears in despair. Gold continues its upward trend, with a remarkably strong daily chart, giving the market continued hope for a bullish outlook.
The previous gains were excessive, and any pullback would be far greater than we had anticipated. Tuesday's drop is a case in point. Although it was merely a market correction, it led many traders to believe the bull trend was over. However, this was not the case. The price pullback merely provided an opportunity to go long, and the bravest traders are already enjoying the rewards. Overall, the current trend remains strong. Barring any negative news regarding gold, the overall strategy remains to buy on pullbacks, with an eye on new highs.
Trading Strategy:
Go long on pullbacks near 4150, with a stop-loss at 4135. Profit range: 4080-4190-4200.
For aggressive trading, go long in batches between 4160-65.
When the price first hits 4195, you can try shorting with a small position, which can yield a profit of 15-20 pips.

Gold hits new highs again. Latest analysis.Gold prices continued their upward trend in early Asian trading on Wednesday, reaching new highs. After hitting a record high of 4179 on Tuesday, bullish profit-taking triggered a nearly $90 drop, reaching as low as 4090. Although prices retreated below 4100, bargain-hunting quickly helped gold extend its upward trend.
Gold's continued rise is driven by a combination of safe-haven demand, the Federal Reserve's dovish shift, and a weaker dollar. Factors ranging from the trade war to falling bond yields and the dollar's decline in the foreign exchange market are pushing gold prices toward higher peaks. In the short term, the international trade situation may be a key variable; if signals of a reconciliation emerge, gold prices could experience a correction.
Gold's trend structure remains intact, with the daily chart closing in a bullish trend. The 10-day and 7-day moving averages remain upward, retreating close to the 5-day moving average at 4083 on Tuesday. After stabilizing at 4090, prices regained support. The short-term chart maintains an intact ascending channel, with the Bollinger Bands opening upward and the price extending along the upper middle band.
Trading Strategy:
Go long near 4145, with a stop-loss at 4130. Profit range: 4180-4200.
Short with a small position if the price first touches 4195, with profit targets focused around 4150.
Key Levels:
First Support: 4135, Second Support: 4110, Third Support: 4090
First Resistance: 4185, Second Resistance: 4195, Third Resistance: 4200

Explosive Battle Ahead — Can Gold Smash Through 4180 Again?Gold retreated $90 from 4180 to around 4090, then hit the 4100-4090 area twice before rebounding, and is currently consolidating around 4150. Although the short-term retracement of gold is not small, it is obvious that it has not destroyed the upward trend and pattern structure. However, it has exacerbated market differences to a certain extent and also increased short-term volatility. First, 4160 represents the 23.6% retracement level. Next, we must closely monitor two areas. First, 4160 represents the 23.6% retracement level of the recent short-term rally. If gold fails to break through this area during its subsequent rebound, it could form a technical M-shaped double top with the 4180 high in the short term, favoring a downward trend for gold and potentially leading to a further correction.
Second, we must pay close attention to the area around 4125, which represents the 61.8% retracement level of the recent short-term rally. If gold remains above 4125 during its subsequent pullback, it indicates that the bullish trend in gold has not ended and that it may continue to reach new highs.
Based on the above considerations, regarding short-term trading:
1. First, we can consider shorting gold in small quantities in the 4150-4160 area, and then patiently wait for gold to retrace.
2. Once gold retreats to the 4125-4115 area, we can try to go long again, and then patiently wait for gold to rebound further, or even retest the recent high near 4180.

Gold → How to operate at nightToday, we highlighted the risks in gold’s upward movement. We also guided everyone to enter short positions on gold at high levels based on the intraday trend, and all these positions yielded solid profits. Currently, gold is trading within the 4,090–4,180 range. It has tested the lower end twice but failed to break below the 4,090 support level—this indicates strong buying interest (support) at lower prices, and the sharp drop during the Asian session was likely just profit-taking by funds that entered at high levels.
Keep an eye on Fed Chair Powell’s speech in 10 minutes. As mentioned earlier, if Powell echoes the current rhetoric in favor of rate cuts, the bullish momentum will continue, and gold will keep hitting new highs. Conversely, if Powell expresses further resistance to rate cuts—causing market expectations for a Fed rate cut to plummet—gold will test the 4,090 support again. A break below this level may trigger a wave of profit-taking sell-offs, and gold’s bull market will come to a complete end.
Trading Strategy
Enter a light short position on gold around the 4,180 level, with a 3-point stop-loss. PS: Stop-losses are a must for news-driven markets; without them, you could easily get trapped if the price breaks out sharply. On the downside, focus on the 4,090 support. If this level is broken, continue to enter short positions on any rebound.
For specific trading decisions, please follow my real-time updates. I post my trading ideas and strategies daily. If you lack a plan or clear direction for gold trading and struggle to achieve consistent, stable profits, you can refer to and follow my updates as a reference and guide to help you avoid mistakes.
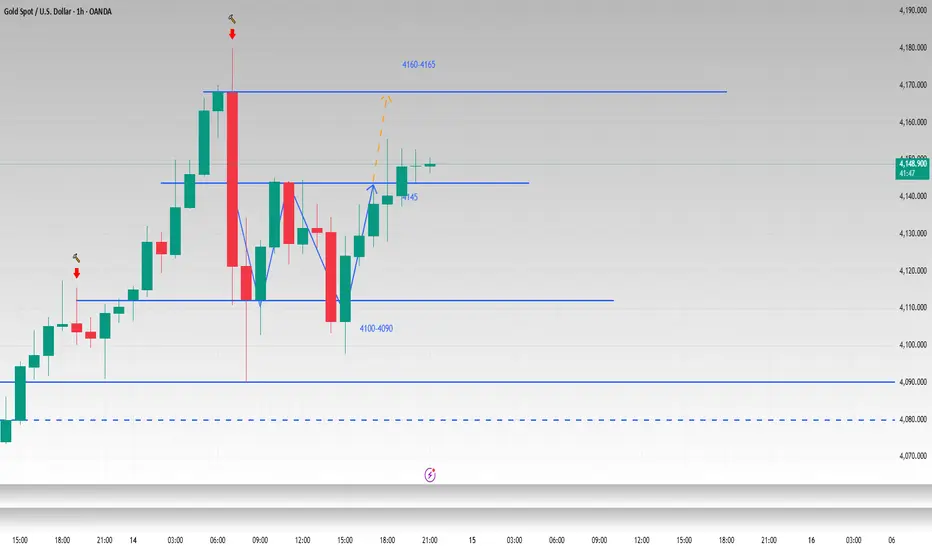
W pattern is established and the bullish pattern remain unchangeI have said before that gold is in a fluctuating upward state whether viewed from the weekly or daily charts, and there is no reversal signal. I mentioned in my previous post that from the hourly chart, gold has the prototype of a W shape, and the neckline is at 4145. In the evening of the US session, gold successfully broke through the neckline and touched around 4155. Although the bullish momentum of gold has stagnated slightly after a slow rise, I am still optimistic that gold will reach 4160-4165. If it falls back to around 4145-4135 again, we can still consider trying to go long on gold.
OANDA:XAUUSD
Bullish on gold. A recurring profit-taking?Federal Reserve Chairman Powell delivered a speech at the National Association for Business Economics in Philadelphia, his first public appearance at a major Fed meeting since last month's policy meeting. The previous meeting revealed significant disagreements among officials on the timing and magnitude of future rate cuts, and Powell's remarks are seen as a crucial moment to fine-tune expectations.
Gold prices are consolidating around the 4090-4145 range in the short term, with the 1-hour Bollinger Bands gradually flattening, suggesting another short-term trend shift. Quaid recommends paying attention to the short-term resistance level of 4150. If the price breaks through 4150 strongly, the Bollinger Bands will open upward again and the price may create a new high again.
As gold continues to rise strongly, Quaid recommends that the bullish strategy is to go long at 4100-4090, which is a more stable option. The recent volatility is large, so it is better to go long at low levels and establish positions in batches at multiple points to avoid unexpected events that may cause trend changes.
If the price breaks through 4150 with great strength, you can still go long when waiting for gold to pull back to around 4140-4130. The profit range is 4180 or above.

10.14Gold bulls continue to exert their strength!!!Gold is currently stabilizing after a broad range-bound consolidation on the 4-hour chart. It experienced an unexpected intraday plunge, but the momentum has been minimal. A rapid intraday rise followed by a sustained decline could present an opportunity for a short position. The price has rebounded after retracing to previous support levels, and the K-line charts are still trading above the short-term moving average, suggesting a relatively strong trend in the short term. There are currently no significant technical patterns on the hourly chart. On the smaller timeframes, pressure is building on the short-term moving average, maintaining a weak trend. There may be some room for correction in the short term. Focus on the support level around 4005 in the short term.
Gold remains strong. Should we continue to go long?After hitting an all-time high of 4179.47, gold fell sharply to around 4090. It is currently bottoming out and fluctuating around 4151. US President Trump's shifting stance on tariffs continues to boost market risk appetite. Coupled with the emergence of bargain-hunting in the US dollar, this has led to profit-taking in gold amidst severely overbought conditions.
The economic uncertainty caused by the prolonged US government shutdown, the resurgence of trade tensions, and the risk of escalating conflict between Russia and Ukraine are likely to continue supporting safe-haven gold, suggesting that gold bears should exercise caution.
On Monday, gold began its upward trend from 4025, reaching a high of 4115 in US trading, a 90-point increase. The market did not offer most traders the opportunity to go long on a pullback, and gold continued its upward trend on Tuesday.
Undoubtedly, the current trend necessitates a continued bullish stance. Focus on the strong support range of 4100-4080, which is a key support level. If prices fall back into this range, there is no problem maintaining a long position, but it remains to be seen whether prices can break back into this area.
From the 1-hour chart, MA5, 10, and 20 gradually converge around 4130, and there are signs of crossing upward. At the same time, this area is also the current position of the middle track of the Bollinger band. In the short term, if the price cannot pull back to the support area near 4100, you can also try to perform long operations around 4130. Quaid believes that if gold begins to rise around 4130, the high around 4180 could be re-broken.
Trading Strategy:
Buy in batches between 4100 and 4080, with a stop-loss at 4070 and a profit range of 4050-4180.
Aggressive Trading: Go long around 4130, with a profit range of 4180 or above.

Gold prices have not "fallen", only "adjusted"
News:
During Tuesday's Asian session (October 14th), spot gold retreated sharply from its all-time high of $4,179.47 per ounce, now fluctuating around $4,125 per ounce, near the lower limit of its intraday range. US President Trump's shifting stance on tariffs continued to boost market risk appetite, and coupled with dip-hunting in the US dollar, this prompted profit-taking in gold amidst severely overbought conditions.
As Democrats and Republicans continue to blame each other for the government shutdown that began on October 1st, the impasse over the reopening of the US government is expected to continue into its third week.
US President Trump reignited the trade war last Friday, threatening 100% tariffs, which continued to provide support for safe-haven gold.
In geopolitical terms, the escalating conflict between Russia and Ukraine has become another factor contributing to the precious metal's record highs.
Specifically:
From a technical perspective, the rally over the past seven weeks or so has consistently followed an upward-sloping trendline.
Furthermore, after breaking through the $4,055-4,060 resistance area, gold prices have surged past the $4,100 mark, solidifying the short-term bullish outlook for gold.
However, the 14-day Relative Strength Index (RSI) is already showing severe overbought signals, suggesting a period of consolidation before further gains are possible.
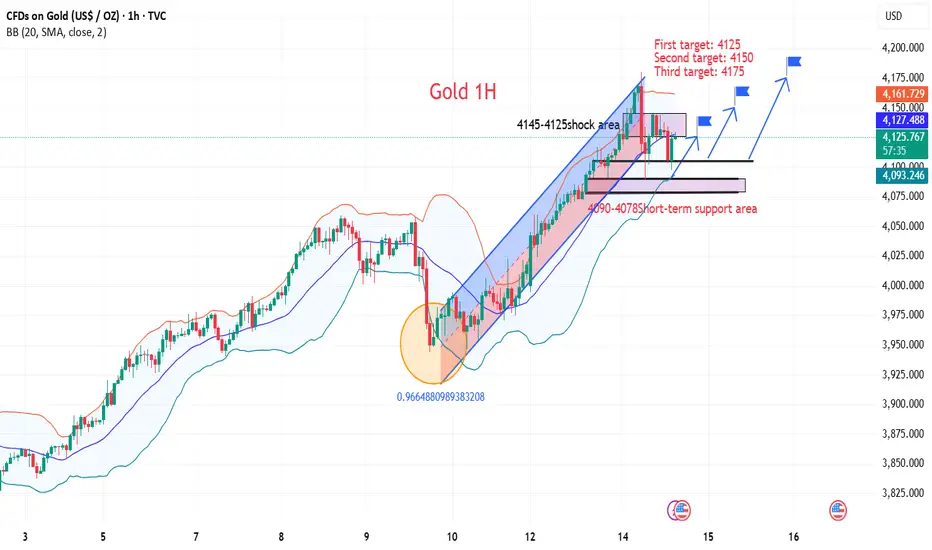
Any meaningful technical pullback currently could be seen as a buying opportunity. The $4,090-4,078 area provides strong support, but a break below this support level could trigger a technical sell-off. Conversely, if gold successfully forms a double bottom in the $4,090 area, the short-term correction in gold could be over, potentially ushering in a new round of gains.
Trading strategy:
Buy: 4090-4110-4115, SL: 4078, TP: 4125-4150-4175
10.14 Tariffs and interest rate cut expectations resonate!Judging from the current 4-hour chart:
4100 is essentially the current hurdle for gold.
It's also the most important support level today.
Gold opened today in the 4100-4110 range. Although it recently retreated to around 4090, the real-world price still closed above 4110.
If we analyze the trend from last week's low of 3950 to the current 4180 level, we can see that the 618 support level is precisely around 4090.
4090 also happens to be the low point of the recent retracement.
According to wave theory, if the retracement does not exceed 618, new highs are inevitable. If it breaks through 4180 again, the next target may be around 4230.