Gold at a Critical Crossroads: Surge to $4700 or Drop to $3500?If the price breaks through the yellow zone, it could reach the red zone range. And if it doesn't cross the yellow zone, there's a chance it could head toward the 4700 range
Goldprediction

XAUUSD Bearish Outlook – Liquidity Grab Into FVG ZoneThis is my new update for gold. On the 1H timeframe, we can see a double top followed by a change of character (CHOCH) to the downside, confirming bearish intent. I’ve marked two Fair Value Gaps (FVG 1 and FVG 2) as potential retracement zones.
Price has now reached a support level and bounced, forming equal highs (marked with dollar signs), indicating liquidity above. I expect a liquidity grab above these equal highs before a potential drop.
The retracement may reach FVG 1 (~50% Fibonacci) or FVG 2 (~61.8% Fibonacci). From either level, if we see a CHOCH to the downside on the 5M timeframe, that could be a strong sell confirmation, aligning with the 1H bearish structure.
My target is around $3,950, making this a high-probability short setup based on Smart Money Concepts.

Last trading day. Watch for resistance levels.After the CPI data was released as expected, while the results appear bullish for gold, the market reaction was muted, and the price rebound was relatively weak. This is likely because the current gains may have already overdrawn all positive expectations, and the market needs a period of cooling off.
On the 4-hour chart, gold prices rose on the data, returning to a range of fluctuations. The moving averages are showing a relatively flat trend. The 5-, 10-, and 20-minute moving averages intersect with the middle Bollinger Band in the 4100-4110 range, which also represents a significant short-term support level. The 30-minute moving average is nearing its intersection with the upper Bollinger Band in the 4170-4180 range.
Based on technical indicators, watch for resistance at 4160 in the short term, with a breakout at 4180. Focus on support at 4100-4110 below.
Quaid believes that as the last trading day of the week, the price may also fluctuate slightly around 4130. But if it suddenly starts to break upward, then we need to pay attention to the suppression situation above. When the price first hits around 4160 and fails to break upward effectively, short sell with a light position at this position and make a profit of 30-40 points.
A happy weekend is coming, Quaid hopes everyone reaches their profit targets this week.

Gold bulls under pressure await reversal
News:
Spot gold prices fluctuated within a narrow range, consolidating after a sharp pullback from all-time highs. Spot gold traded around $4,133 intraday, rising slightly after two consecutive days of decline, as safe-haven demand remained supported by a combination of economic anxiety and geopolitical tensions.
The US-China trade standoff remained a focus for investors, with reports that Washington was considering new export restrictions ahead of the US-China talks.
The US government shutdown, now in its fourth week, continued to weigh on market sentiment. Meanwhile, the prospect of further monetary easing from the Federal Reserve also impacted investor positioning.
Specifically:
The 4-hour level six-month moving average and the 2-hour level 66-day moving average of gold are resonating support at the 4160 line. Today, we will see its gains and losses. The 4-hour 5-day and 10-day moving averages are concentrated at the 4140 line. Breaking below this level today triggered further declines.
Currently, the upper side is focused on short-term resistance at 4160, while the lower side is focused on short-term support at 4065-4070. Gold is under pressure and struggling to break through. Trading strategies should prioritize shorting during rebounds and under pressure. For intermediate positions, be cautious in following orders and patiently wait for key entry points.
I'll provide detailed trading strategies on the channel, so stay tuned.
Trading strategy:
Buy: 4165-4160, SL: 4175, TP: 4120-4090

GOLD WEEKLY CHART MID/LONG TERM ROUTE MAPHey everyone,
Please check out our updated Weekly Chart Route Map, featuring updated revised key levels after completion of our last long term weekly chart idea for precise level-to-level tracking.
We’ve refreshed our long-term structure on the weekly chart. Price action recently rejected the 4294 level and is now range-bound between 4284 (resistance) and 4059 (support). This consolidation aligns with a detachment from the EMA5, highlighted on the chart with a circle. Even if a full detachment doesn’t materialize, a partial (halfway) correction remains the more probable scenario.
To determine the next directional move, we’ll need a decisive test and break of either boundary level. On the broader horizon, 3006 stands as the long-range pivotal swing zone, which may come into play if a major correction unfolds.
🔹 Note: The key distinction between a retracement range and a swing range is that swing ranges typically produce larger bounces and wider price reactions compared to standard retracement ranges.
We’ll continue to update this outlook throughout the week as the structure develops. Thank you all for your likes, comments and follows, we really appreciate it!
Mr Gold
GoldViewFX

GOLD on the RISE!XAUUSD moved as we analyzed. Now waiting for BreakOut from RESISTANCE to see if it will retesting and continue flying UP todsy or when markets reopen next week.

XAUUSD: The return of CPI and PPI newsAfter a series of absences from news, in today's trading session two CPI (Consumer Price Index) and PPI (Producer Price Index) will be announced. Therefore, OANDA:XAUUSD can be very volatile and we should be cautious in the last trading session of the week.
The CPI is forecast to be favorable for the dollar and the PPI is forecast to be slightly lower than the previous period , but we still need clearer confirmation to assess the trend of gold in the near future.
Some key levels that we need to pay attention to in today's trading session:
Resistance: , ,
Support:
Support:
Strong support:
Always be patient and wait for the price to reach the support and resistance zones above and get confirmation. Do not place limit orders or enter orders when the price is increasing or decreasing sharply.
Take advantage of the above support and resistance zones and trade short-term when the price reacts at these support and resistance zones.
Take profit when the price moves from 10 to 20 prices since entering the order at the support and resistance areas.
Wait for reactions such as Engulfing candles, Doji,... at the support and resistance zones.
Always set stop loss when trading and manage risks closely.
Note : Price may spike through support or resistance levels and then reverse. Therefore, it is crucial to patiently wait for the candle to close before entering a trade.
Victor Dan @ ZuperView

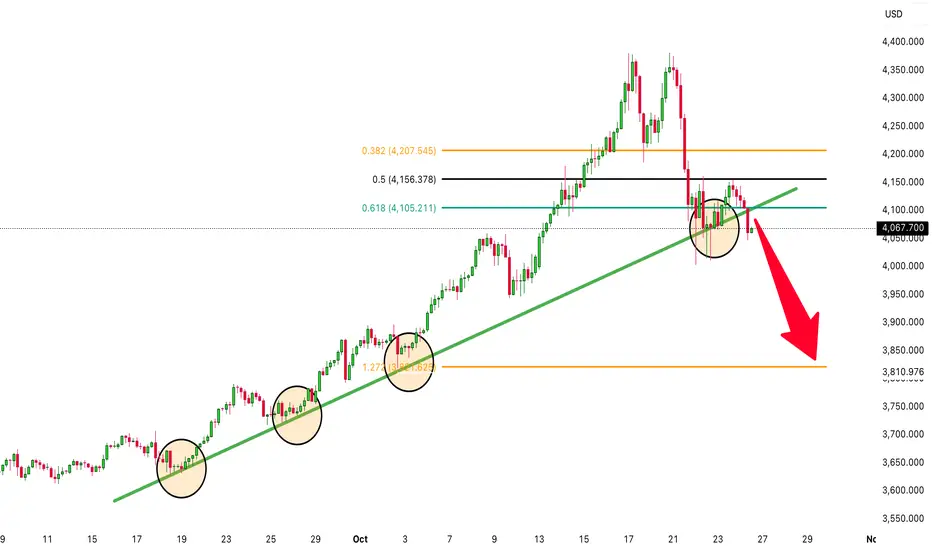
Time for GOLD To DROP! (XAUUSD is heading to the downside!)For many weeks gold (XAUUSD) has been sky rocketing to the upside, however there have been many new signals indicating that it could be a bearish move to the downside. Nothing keeps going up forever! Gold has broken major support levels including the trendline that has been holding it up for weeks. It has also been struggling to break above the fibonacci level of 0.50! Time to sell!
GOLD HIGH PROBABILITY SETUP SOON!!! 🚨 XAUUSD HIGH PROBABILITY BUY SETUP 🚨
* Here We Can See Clearly The Next Potential Moves For GOLD Coming Hours/Days.
* Keep Your Eyes Close On Your Trading Positions.
* Happy PIP Hunting Traders.
FXKILLA.

Gold is in a volatile market. Awaiting data releases.In the current market, the critical dividing line of $4,180 is not only a technical resistance level, but also a tipping point for the reshaping of market logic. The surge and pullback have become a shift in market momentum, fueled by an irrational exuberance fueled by bullish sentiment. The surge in gold prices over the past three months is essentially the product of a triple force: policy expectations, geopolitical risks, and central bank gold purchases.
During this process, market sentiment shifted from cautious testing to frenzied pursuit of gains. The RSI indicator briefly crossed the overbought threshold of 80, suggesting that gold prices had broken free from fundamental support. This correction is also inevitable due to a technical correction. When gold prices reached the all-time high of $4,400, market structure shifted subtly: quantitative trading systems triggered stop-loss orders, institutional investors began taking profits, and retail investors' enthusiasm for the rally reached its peak. This pullback is not a trend reversal, but rather a temporary release of upward momentum. Like a spring that rebounds after being compressed to its limit, the market needs to oscillate through fluctuations to clear floating chips and accumulate energy for subsequent breakthroughs.
The market is currently in a fundamentals "information black hole." The US government shutdown has delayed the release of key data such as the non-farm payroll report and CPI, creating a "policy expectations vacuum." In the absence of economic data guidance, investors are increasingly divided over the pace of the Fed's rate cuts. However, central bank gold purchases and geopolitical risks have limited downside potential, creating a volatile market with a "bottom and a ceiling."
In the short term, gold will maintain a volatile pattern centered around $4,180. Quaid recommends buying low and selling high within the $4,180-$4,000 range, monitoring Fed policy signals and geopolitical developments. We should also be wary of data shocks after the US government shutdown ends and the risk of a sudden easing of geopolitical conflicts. A break below $4,000 could trigger a technical sell-off.
Thus, short-term traders seek certainty amidst volatility. The current volatility in the gold market is essentially a technical correction within the bull market, not the end of the trend. The $4,180 level marks both a battleground for bulls and bears and a starting point for reconstructing market logic.
For investors, remaining patient amid volatility and seeking certainty amid disagreements may be the best strategy to deal with the current market.
The last trading day of the week, coupled with the release of CPI data, marks the first major data release since the US government shutdown, potentially triggering significant market volatility.
Strategy implementation will remain in place until the CPI data is released. I will update the strategy in the channel after the data is released.

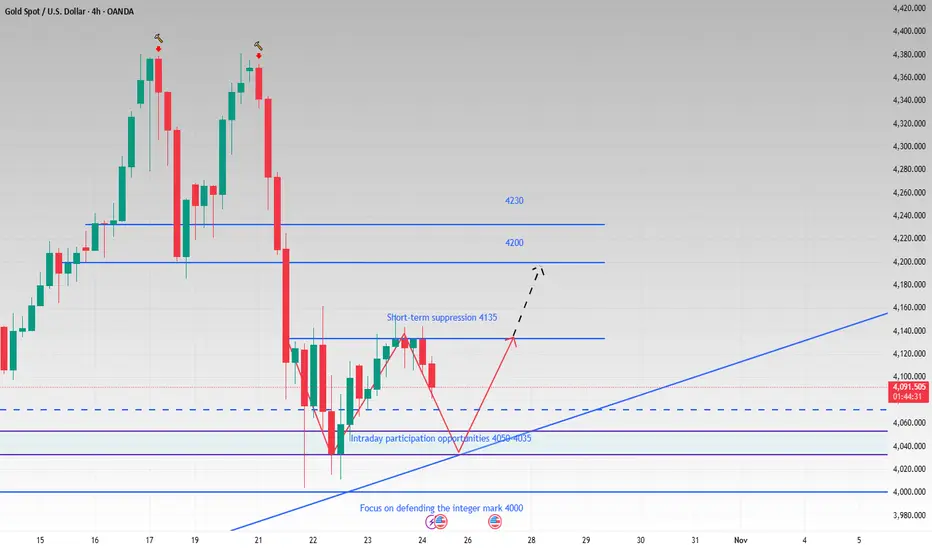
4H see W shape. Support is not broken and it is still bullish.Although gold has experienced a temporary pullback today, we remain bullish as long as the price remains above the upward trend line. While the hourly chart shows a downward trend, with moving averages diverging downward and technical indicators like the MACD forming a death cross, it appears that bears have regained control of the market in the short term.
But from the 4H perspective, if the short-term decline continues and it can effectively rebound after touching the trend line and move out of the W-shaped structure, then gold will be expected to hit the 4135-4145 pressure again, and then gradually hit the 4160, 4200 and other periodic resistance levels until the bulls return. As time goes by, the support points on the short-term trend line are constantly moving up. If it falls back to 4050-4035, try to go long on gold in batches with light positions, and the target is 4090-4130.
OANDA:XAUUSD
Bullish Gold XAUUSD Setup: Breakout, Retest & Trade OpportunityGold is currently bullish and beginning to break market structure 📈. Price is moving toward previous highs, which may act as resistance. Ideally, I’m watching for price to push through these highs, then retest the level for a potential long opportunity ✅.
In the video, I break everything down clearly — including:
📊 Trend direction
🏛 Market structure
💹 Price action
📉 Volume profile analysis
🎯 How to plan the trade step-by-step
⚠️ This is not financial advice — educational purposes only.

XAUUSD on consolidation ready for again upside XAUUSD is cool down & captured the consolidation zone from 4090-4140 .
What are my conditions For Today's session?
Currently i m looking for buy trade from 4085-4175 zone ,I'm expecting H4 and H1 Candle closing will be above 4100 .
Targets: 4145- 4175.
✳️Secondly if H4-H1 candle closes below 4070
our buying will be postpond and market will test 4045.

XAUUSD SELL SIDE TRADEGold’s short-term downside from the 4144 to 4100 level is driven by a firmer U.S. dollar, renewed expectations that the Federal Reserve will keep rates elevated, and easing geopolitical tensions that have reduced safe-haven demand. A recent 6% correction—its biggest in 12 years—triggered heavy profit-taking after weeks of record highs. Technically, overbought signals and breached support levels accelerated the sell-off, while stronger U.S. retail data fueled the dollar’s rise. These combined macro and technical pressures are prompting traders to book profits near resistance zones and eye consolidation around the 4100 mark before potential stabilization

Gold remains volatile. Choose an entry point.Gold experienced a dip on Wednesday, falling to 4004 before rebounding. It tested resistance near 4162 before falling again during the European trading session. It retreated twice to around 4010 during the US trading session before recovering above 4100 at the end of the day.
Judging from the gold market's rhythm on Wednesday, despite some twists and turns, the main structure remained within the moving average range. The 10-day moving average provided strong support, while the 20-day moving average, at 4020 and 4000, formed a support band that effectively provided a short-term bottom.
If gold continues to fluctuate and consolidate in the last two trading days of this week but does not fall below 4000, it could indicate a continued upward trend. If supported by positive fundamental news, gold could experience another short-term uptrend.
If 4000 points falls, panic selling by bulls could intensify, potentially leading to further declines in gold prices in the short term. This could also create the risk of a stampede caused by a sell-off by bulls.
Currently, the weekly MA5 remains near 4000, but the 20-day moving average has risen to 4035. In the short term, focus on the area around 4035, with the 4000 mark remaining the key level. On the upside, focus on the current intersection of the 5- and 10-day moving averages, around 4170-4180.
From the 1-hour chart, there will also be some short-term resistance above 4145, so the approximate short-term range is expected to be between 4000 and 4180. A smaller range of 4035-4145 is also expected.
In addition, the US September CPI inflation data, due to be released this Friday, is attracting much attention. If the report shows higher-than-expected inflation, it could boost the US dollar in the short term and put pressure on dollar-denominated gold prices.
In the short term, we recommend going long around 4110, with a stop-loss at 4100 and a profit range of 4140-4160.
Short-term resistance at 4160 has been persistent, so consider a short position with a profit of 30-40 pips.

GOLD at Immediate support ? Holds or not??#GOLD... well guys market just make a supporting area that is around 4110-11
Keep close and sustain above means another rise expected.
So stay sharp.
Good luck
Trade wisely

XAU/USD Intraday Plan | Support & Resistance to WatchGold remains under downside pressure after failing to hold above the 4151 resistance yesterday, with price now trading around 4104. The metal continues to trade below both the MA50 and MA200, confirming that short-term momentum remains bearish within a broader corrective phase.
If buyers can reclaim 4117 and 4151, a corrective bounce toward 4192 and 4227 may follow. However, failure to defend 4075 could trigger another wave of selling toward 4020, and potentially deeper into the 3984-3953 zone, where fresh demand could start building up.
📌 Key levels to watch:
Resistance:
4117
4151
4192
4227
Support:
4075
4044
4020
3984
🔎 Fundamental focus:
Gold continues to trade under macro uncertainty as the U.S. government shutdown drags on, delaying major data releases and weighing on investor confidence. The lack of economic transparency has led to erratic price swings, while persistent U.S.–China trade tensions and weaker manufacturing sentiment add further risk aversion.

GOLD 4H CHART ROUTE MAP UPDATE & TRADING PLAN FOR THE WEEKHey Everyone,
Please see our updated 4h chart levels and targets for the coming week.
We are seeing price play between two weighted levels with a gap above at 4333 and a gap below at 4225. We will need to see ema5 cross and lock on either weighted level to determine the next range.
We will see levels tested side by side until one of the weighted levels break and lock to confirm direction for the next range.
We will keep the above in mind when taking buys from dips. Our updated levels and weighted levels will allow us to track the movement down and then catch bounces up.
We will continue to buy dips using our support levels taking 20 to 40 pips. As stated before each of our level structures give 20 to 40 pip bounces, which is enough for a nice entry and exit. If you back test the levels we shared every week for the past 24 months, you can see how effectively they were used to trade with or against short/mid term swings and trends.
The swing range give bigger bounces then our weighted levels that's the difference between weighted levels and swing ranges.
BULLISH TARGET
4333
EMA5 CROSS AND LOCK ABOVE 4333 WILL OPEN THE FOLLOWING BULLISH TARGETS
4422
EMA5 CROSS AND LOCK ABOVE 4422 WILL OPEN THE FOLLOWING BULLISH TARGET
4494
EMA5 CROSS AND LOCK ABOVE 4494 WILL OPEN THE FOLLOWING BULLISH TARGET
4572
BEARISH TARGETS
4225
EMA5 CROSS AND LOCK BELOW 4225 WILL OPEN THE FOLLOWING BEARISH TARGET
3985
EMA5 CROSS AND LOCK BELOW 4122 WILL OPEN THE SWING RANGE
3985
3857
EMA5 CROSS AND LOCK BELOW 3857 WILL OPEN THE SECONDARY SWING RANGE
3741
3632
As always, we will keep you all updated with regular updates throughout the week and how we manage the active ideas and setups. Thank you all for your likes, comments and follows, we really appreciate it!
Mr Gold
GoldViewFX

The bottom of gold price is still under construction
News:
On Thursday (October 23rd), gold prices regained safe-haven support after a recent pullback, primarily driven by escalating geopolitical tensions and expectations of new US export restrictions.
Risk aversion reignited, while investors awaited Friday's US CPI data to assess the Federal Reserve's policy path. After hitting a record high of $4,381.21, gold prices recently came under short-term pressure, entering a technical correction.
Gold prices found renewed support this week amid heightened geopolitical uncertainty and rising US policy risks.
Specifically:
Gold daily chart: Yesterday, the price stabilized at the middle line, closing with a long lower shadow candlestick. This suggests the 4000 low has temporarily stabilized. Whether it effectively serves as the bottom of a short-term correction will require further confirmation.
On the 4-hour chart, gold prices broke below the neckline of the double top pattern, strengthening bearish momentum. The neckline area (4225-4220) will now become new resistance, and bears may be positioned there with a stop-loss placed above resistance, aiming for a further break below the trendline.
Trading strategy:
Buy: 4190-4185, SL: 4205, TP: 4120-4090

RGLD Ready to Shine—Ride the Next Precious Metals WaveRoyal Gold Inc. (RGLD) is showing trending buy momentum supported by boosted FY2025 earnings estimates and solid growth in streaming revenues. Monitor price action near Weekly Support for an entry on this high-quality precious metals play.

FNV Pullback Sets Up a Trending Buy OpportunitiesFranco-Nevada (FNV) is currently down but showing signs of stabilizing near key support levels. This pullback could offer a favourable entry on a trending buy setup if volume picks up and price breaks below support. Consider this a disciplined buy-the-dip opportunity with defined risk.

Barrick Gold (B) Poised for Further Gains as Gold Prices SurgeThis trade idea highlights Barrick Gold's strong momentum backed by rising gold prices and robust Q2 earnings showing increased gold and copper production. With the stock recently rallying over 100% year-to-date and analysts rating it as undervalued on key metrics, this setup offers potential for continued upside. Watch for key Support levels and volume confirmation to enter, applying strict risk management.

GOLD POSSIBLE MOVEMENT ON 4HRSBear it in mind that Gold is on bullish movement so I am working on this pattern to form before considering any entry.... Dyor
Continuation pattern 🕊️🙏
