GOLD POSSIBLE MOVEMENT ON 4HRSBear it in mind that Gold is on bullish movement so I am working on this pattern to form before considering any entry.... Dyor
Continuation pattern 🕊️🙏
Goldprediction

XAU/USD 23 October 2025 Intraday AnalysisH4 Analysis:
-> Swing: Bullish.
-> Internal: Bullish.
Analysis and bias remains the same as analysis dated 20 October 2025.
Price has printed as per previous intraday expectation by printing a bearish CHoCH which indicates, but not confirms, bullish pullback phase initiation.
Price is currently trading within an established internal range, however, I will continue to monitor price with regards to depth of pullback.
Intraday expectation:
Price to continue bearish, react at either discount of 50% internal EQ, or H4 supply zone before targeting weak internal high priced at 4,380. 990.
Note:
The Federal Reserve’s sustained dovish stance, coupled with ongoing geopolitical uncertainties, is likely to prolong heightened volatility in the gold market. Given this elevated risk environment, traders should exercise caution and recalibrate risk management strategies to navigate potential price fluctuations effectively.
Additionally, gold pricing remains sensitive to broader macroeconomic developments, including policy decisions under President Trump. Shifts in geopolitical strategy and economic directives could further amplify uncertainty, contributing to market repricing dynamics.
H4 Chart:
M15 Analysis:
-> Swing: Bullish.
-> Internal: Bearish.
Analysis and bias remains the same as yesterday's analysis dated 22 October 2025.
Price has printed according to my analysis dated 20 October 2025 where I mention that price is to continue bullish, react at either premium of 50% internal EQ, or M15 demand zone, before targeting weak internal low priced at 4,185.910.
Price has printed a bearish iBOS and subsequently a bullish CHoCH to indicate, but not confirm bullish pullback phase initiation.
Price is now trading within an established internal range.
Intraday expectation:
Price to react at either premium of 50% internal EQ, or M15 demand zone, before targeting weak internal low priced at 4,004.280.
Note:
Gold remains highly volatile amid the Federal Reserve's continued dovish stance, persistent and escalating geopolitical uncertainties. Traders should implement robust risk management strategies and remain vigilant, as price swings may become more pronounced in this elevated volatility environment.
Additionally, President Trump’s tariff announcements, particularly against China, are expected to further amplify market turbulence, potentially triggering sharp price fluctuations and whipsaws.
M15 Chart:

Is the correction over? Bearish resistance levels are expected.Gold's decline intensified during Wednesday's US trading session, partly due to silver's earlier break below $50, which dampened overall sentiment for precious metals. Overall, this decline was primarily driven by profit-taking and a technical correction.
Gold has been fluctuating above the 4,000 mark for the past two days. After these two days of volatile decline, the 4,000 level is crucial for mid-term strategies.
Thursday's Asian session saw slight fluctuations. If the European session sees a rebound, prices could rise again to test 4,130, followed by yesterday's high of 4,161. Therefore, continued strength in the European session is a prerequisite for the US market. Focus on resistance at 4,130 during the Asian session, and watch for resistance at 4,160 after a breakout.
Trading strategy:
Short around 4130, stop loss at 4140, profit range 4060-4050.
If it breaks through, watch for resistance at 4160 and try to trade again.

The trend line is not broken and the medium to long term is bull
Good morning, bros. Gold has fallen from its high of 4380, dropping nearly $380. This significant drop is relatively rare in the past six months. However, judging from the 4H cycle trend, the current gold price is still above the rising trend line. The 4000 mark is a defensive point for bulls. The decline will only continue after successfully breaking through 4000. Yesterday, the lowest point only retreated to around 4015-4005 before it began to rebound. Although it did not provide us with an ideal entry opportunity, it also confirmed the determination of the buyers below to hold on to the 4000 mark. Therefore, until a clear break below the trend line is achieved, our bullish outlook remains unchanged.
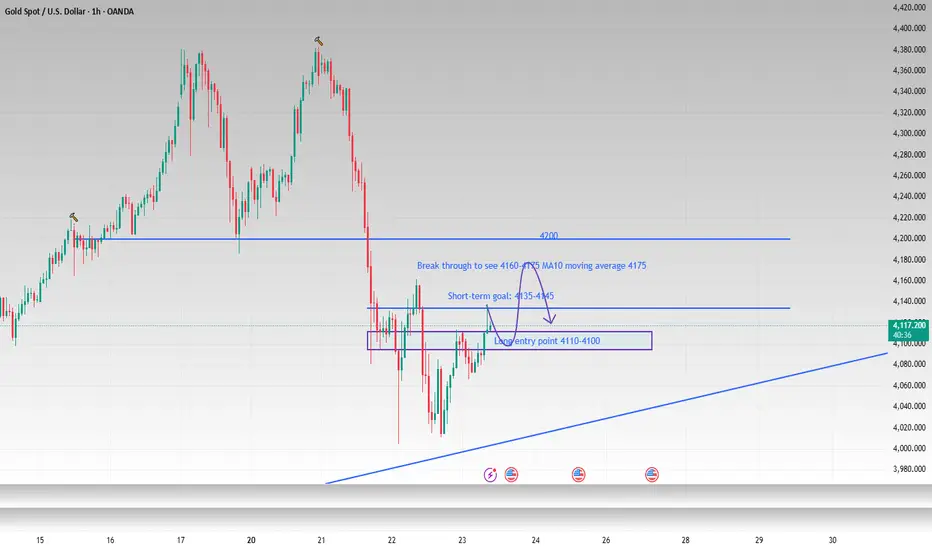
The gold price rebounded to around 4135 during the day and then fell back. As I told you yesterday, this position is a relatively dense trading area. I believe the current decline is the market accumulating strength to hit yesterday's rebound high, and it also provides us with a good opportunity to enter the long market. Pay attention to 4110-4100 below. If it retreats to this range, you can try to go long on gold in batches. The first target can continue to look at 4135-4145.
OANDA:XAUUSD
GOLD PAUSES DECLINE; REBOUND IN PLAY TP: 4398 - 4485 - 4630GOLD Macro Outlook
Gold prices rose to around $4,120 per ounce on Thursday, halting a two-day decline as investors weighed trade developments and geopolitical tensions that lifted the metal’s safe-haven appeal.
Reports indicated that the US is considering export restrictions on China involving American-made software, though President Donald Trump later confirmed plans to meet with Chinese President Xi Jinping.
Gold is setting up for a potential bullish continuation as falling bond yields and anticipated Federal Reserve rate cuts continue to weaken the U.S. dollar and boost demand for safe-haven assets.
The 10-year Treasury yield remains below 4%, and yields across the curve have softened. This reinforces expectations that the Fed will announce rate cuts during its upcoming FOMC meetings on October 29 and December 10.
Looking into 2026, the trend of global monetary easing is likely to persist. Economies in Asia and Northern Europe are showing signs of structural weakness due to aging demographics and declining household formation, leading to prolonged low growth and further pressure on global interest rates.
Gold Technical Structure
On the technical front, Gold is currently trading near $4,137, after correcting from the recent high of $4,398. The chart shows price consolidating along the lower Gann support, with a potential reversal setup forming.
Immediate Support: $4,023–$4,100
Immediate Resistance: $4,175 and $4,225–$4,255 (key breakout zone)
Breakout Targets: $4,318 → $4,398 → $4,485 → $4,631
Stop-Loss: Below $4,025 (closing basis)
A daily close above $4,255 would confirm bullish continuation, opening the path toward $4,400–$4,630 levels in the medium term. A breakdown below $4,050 would invalidate the setup and shift bias back to neutral.
Summary
Bias: Bullish (above $4,225)
Entry Zone: $4,060–$4,150
Confirmation: Close above $4,255
Stop-Loss: $4,025 (closing basis)
Targets: $4,318 → $4,398 → $4,485 → $4,631
Macro Catalyst: Fed easing cycle, weaker USD, global rate decline
Gold remains well-positioned for a renewed upside phase driven by macro tailwinds and technical recovery from support zones. Sustained trade above $4,225–$4,255 could confirm a breakout, aligning both macro fundamentals and technical signals in favor of the bulls.

Gold - Buy around 4065, target 4110-4165Gold Market Analysis:
Yesterday's gold price essentially saw a range-bound correction after a sharp drop. The 4-hour chart saw back-and-forth fluctuations, forming a large range. Today's gold price is expected to continue to fluctuate within this range. Both the 4-hour and daily charts showed very long lower shadows, reducing the likelihood of a direct unilateral move. Gold has already fallen over 300 points in the two days before yesterday and yesterday, and technically, it needs a period of correction and consolidation. Today's gold trading strategy is both buying and selling. Look for patterns of volatility. Note that gold has been extremely volatile over the past two days, making it easy to lose money if you buy and sell based on technical analysis. Try to follow the 30-minute trend to chase orders. A small intraday move can reach 50 points. Don't be too concerned about the profit margin. Gold prices will continue to rise in the morning session. Let's first look at the minor support level of 4065. If this level stabilizes, it could reach a new one-hour high. Today's buying strategy must focus on 4161. If it breaks again, it could trigger a new buying trend. Let's look for buying opportunities in the Asian session.
Support is at 4065 and 4080, with strong support at 4000 and resistance at 4161. The market's strength-weakness dividing line is at 4065.
Fundamental Analysis:
The alarming crude oil inventory data is supporting crude oil buying prices. Furthermore, whether Federal Reserve officials have signaled further interest rate cuts will support gold buying.
Trading Recommendations:
Gold - Buy around 4065, target 4110-4165

Analysis of the latest gold price trends today!Market News:
Spot gold continued its decline in early Asian trading on Thursday (October 23rd), currently trading around $4,070 per ounce. Yesterday, international gold prices experienced significant intraday volatility, with London gold prices plummeting to a near two-week low, indicating investors were taking profits ahead of Friday's key inflation data. However, trade tensions attracted some safe-haven buying, significantly paring the intraday decline by the close. Europe's clear response to Trump's call for a ceasefire between Russia and Ukraine offered hope of an end to the conflict. The prospect of the US government shutdown ending this week also reduced market uncertainty. Severely oversold technical conditions in precious metals triggered widespread profit-taking, with US gold ETFs shedding 125 tons of holdings, a drop of nearly 3%. Coupled with rising expectations of a dual-loan policy following the election of Japanese Prime Minister Sanae Takaichi, the weakening yen has passively strengthened the US dollar. These factors have put the current capital-driven rally in precious metals at risk.
Technical Analysis:
Gold is experiencing a daily correction with consecutive declines. The New York closing price fell below the 7/10 moving averages at 4203/4176 for the first time since August 20th. The RSI indicator has fallen back below the 50-day moving average, pushing the gold price back towards the middle Bollinger Band near the 4000 mark. The short-term four-hour moving average formed a downward crossover, with the price trading within the lower middle Bollinger Band. The RSI indicator is adjusting below the middle axis. The hourly moving averages are converging, with the Bollinger Band closing price adjusting towards the middle axis. In the short term, gold prices are expected to continue to experience weak, wide-ranging fluctuations. Today's trading strategy is primarily to sell high on rebounds, with buying low as a supplement. A friendly reminder: the recent market volatility, accompanied by rapid and chaotic market fluctuations, requires extreme caution when trading. Looking at the current market, the key focus for gold below is the battle for the 4000 mark. This level is currently near the 20-day moving average on the daily chart and the 5-week moving average on the weekly chart. Technically, a break below this level could trigger a mid-term correction. As a round number, if 4000 points holds, it indicates that buying sentiment remains. If this level is supported by fundamental news such as a Fed rate cut, a rebound is possible. If 4000 points holds, the two-day plunge can be viewed as a period of profit-taking, indicating that buying has not completely subsided. If 4000 points falls this week, sentiment could significantly dampen the previously frenzied bullish sentiment, potentially triggering further panic selling and potentially leading to a larger-scale correction. In summary, the focus on the battle for support around 4020-4000 is on the downside, with continued fluctuations likely above this support band.
Gold Intraday Trading Strategy:
Short-term gold buy at 4000-4005, stop loss at 3990, target at 4100-4130;
Short-term gold sell at 4155-4160, stop loss at 4175, target at 4010-4030;
Key Points:
First Support Level: 4032, Second Support Level: 4000, Third Support Level: 3982
First Resistance Level: 4102, Second Resistance Level: 4133, Third Resistance Level: 4158

Gold price analysis October 23GOLD UPDATE – Prioritize SELL strategy in the short term
The downward correction of gold continued to extend in yesterday's session, showing that the sellers are still clearly dominant. In the short term, the downtrend may continue, leading the price to lower support zones.
In today's session, the strategy of waiting for SELL following the downtrend is still prioritized. The 4145 zone – the important resistance level of the previous session – will play a key role. If the price cannot overcome this zone and a price rejection signal appears, the possibility of further decline will be reinforced.
Trading strategy:
🔸 SELL trigger when there is a price rejection at the resistance zone of 4145 – 4227
🎯 Target: 3946

Gold (XAUUSD): possible plan to think to buy goldGold (XAUUSD): possible plan to think to buy gold.
At this moment my strategy tells me to wait. I wont sell until in 1H my structure turns bearish. but 15m timeframe is bearish so I can't buy until LTF turns bullish. I have shown the level that should be broken before buying.
Cheers

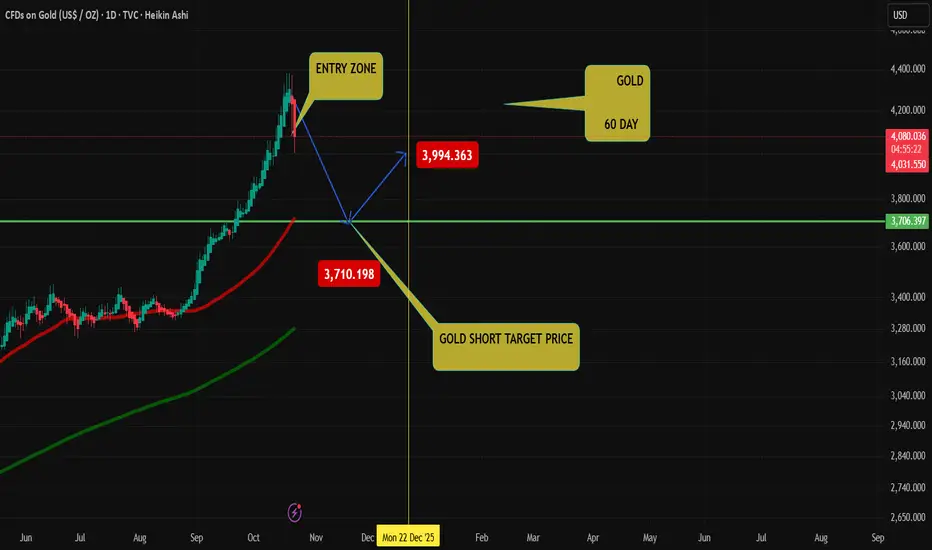
Gold Analysis for 2026My Idea is A huge Down Trend for Gold in 2026
always take your decision in financial markets

When Everyone Was Hyped, We Warned We called the bearish turn on gold right on time:
After we posted the analysis, gold printed one of its sharpest daily drops in years—momentum the market hadn’t seen in a long time. The core view stands: after brief, counter-trend bounces, the primary path remains down. Revisit the previous analysis; the expectation is continued downside after in-trend corrections.
---------------------------------------------------------------------------------------------
🚀 Who am I?
I'm Mahdi, a prop firm trader with 7+ years of experience in technical analysis, mainly focusing on Smart Money Concepts and Elliott Wave theory.
I specialize in delivering high-quality trading signals, market insights, and educational content tailored for serious traders and investors.
📊 My Tools: SMC, Elliott Wave, Fibonacci, Liquidity Grabs, Order Blocks
💼 Prop Challenge Passed: Yes | Funded Account: In Progress
🔗 Follow for consistent updates and trading insights.

GOLD DAILY CHART ROUTE MAP UPDATEHey everyone,
Check out our updated Daily Chart Route Map, now featuring updated levels for tracking Golds movement.
We’ve refined our proprietary Goldturn Channel, our unique method for constructing ascending channels. Price action recently broke out above the channel, with a body close above 4325, leaving a long-term gap open near 4444.
Currently, we’re observing rejection at 4325, and our channel top is now acting as support. The market is range-bound between 4325 (resistance) and 4183 (channel top as support). A decisive break above or below either of these levels will help define the next directional move, keeping in mind the open gap overhead at 4444.
On the downside, 3961 remains the pivotal swing zone, aligning with the channel midline, should we see a confirmed break below 4183.
As always, we will keep you all updated with regular updates throughout the week and how we manage the active ideas and setups. Thank you all for your likes, comments and follows, we really appreciate it!
Mr Gold
GoldViewFX

GOLD US SHORTGOLD 60 DAY Target point
You try! Easy Money,
The gold Only long position after!!!
check my profile gold / play button
XAUUSD is going downGold (XAUUSD) is showing signs of potential downside continuation after a sharp rejection from recent highs. The daily candle formed a long upper wick and closed below the midline of the green band — indicating profit-taking and emerging selling pressure.
Bearish Influences
Rejection Candle: Strong upper wick signals sellers defending resistance near the 4,180–4,200 zone.
Loss of Momentum: Price slipped below the short-term support band, suggesting weakening bullish control.
EMA / Structure Confluence: The current pullback aligns with the lower trendline slope and prior breakout structure — a likely retracement phase forming.
🎯 Fibonacci Bearish Targets
If price fails to reclaim the 4,180 level and bearish momentum persists, look for these downside targets:
Target 1 (0.382 Fib) → $4,047 – $4,050
Minor support and initial retracement level.
Target 2 (0.618 Fib) → $3,943 – $3,950
Key Fibonacci confluence and previous structure support zone.
Target 3 (1.000 Fib) → $3,814 – $3,820
Full retracement target aligning with the lower green volatility band — potential swing low zone.

Gold is still in a downward channel
News:
On Wednesday (October 22nd), spot gold trading saw increased volatility, trading above $4,000 before the US market opened. Previously, the price of gold retreated rapidly from its stage high: it once reached $4,161 in the European session and then came under pressure again; in sharp contrast to the previous stage peak of $4,380, the retreat was significant, and the market became increasingly sensitive to the offensive and defensive switches of the "four thousand mark".
Overall, the market is in a data vacuum. Affected by the government shutdown, the economic schedule on Wednesday was empty, with only a small number of Treasury auctions and repurchase operations supporting liquidity. However, global macro events have quietly amplified the cross-market linkage effect.
Specifically:
Judging from the 4-hour market trend, the current focus is on the short-term suppression of 4090-4080 on the top, and the short-term support of 4000 on the bottom. If the bulls cannot break through, gold will continue to maintain a downward trend. The operation should be mainly high-altitude, and wait patiently for key points to enter the market. I will remind you of the specific operation strategy in the channel, so please pay attention to it in time.
Trading strategy:
Buy: 4090-4080, SL: 4105, TP: 3990-3965

GOLD at current support? holds or not??#GOLD.. market have current supporting area is 4024-25
holdings means again bounce expected..
good luck
trade wisely

Look for a volatile upward correction of 4200-4220Good morning, bros. Although the market did not provide us with suitable trading opportunities last night, this did not prevent the market from confirming Allen's advanced trading vision. Even if the long orders at 4060-4050 were stopped out, the gold price still fell back to around 4000 as expected. Continuing to go long can not only turn losses into profits in one fell swoop, but also ensure substantial profits. how is it? Although we were unable to participate in this transaction, the final trend and results always prove the high accuracy of Allen's advanced trading vision and strategic analysis.
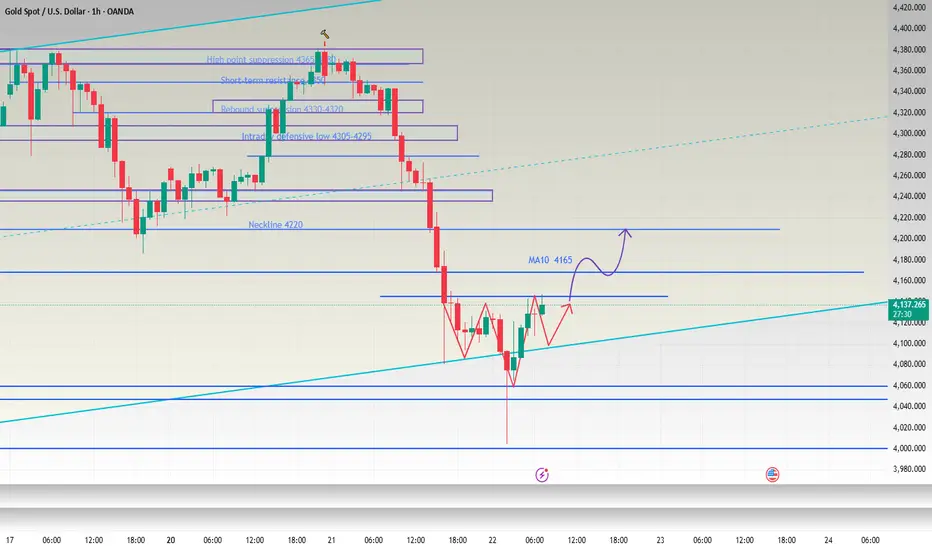
As the candle chart closed with a long lower shadow that was nearly twice the length of the body, the short-term bottom was found near 4000. Therefore, I believe that gold may be in a state of volatile upward repair today. After a rapid decline and rebound this morning, the current price is once again around 4120-4130. Judging from the hourly chart, there is a rudimentary form of a head and shoulders bottom pattern in the short term. If the gold price retreats again, thus prompting the formation of a head and shoulders bottom pattern, then when the gold price falls back to around 4105-4095, we can also try to go long on gold with a light position. If gold continues to rise, we will pay attention to the performance of 4160-4170 above, which is both a short-term resistance and the daily MA10 moving average. If the bulls want to return to the market, they must first stand firm on the MA10 moving average to have greater hope. Therefore, this resistance range is also the focus of our short-term attention. Once it stabilizes above the MA10 moving average, gold will be expected to rebound to 4200-4220.
OANDA:XAUUSD
COULD GOLD (XAU/USD) BOUNCE TO THE UPSIDE OR DROP?GOLD (XAUUSD) is currently being held by a strong support trend line which is is struggling to breakthrough.. however, it is currently in a new downtrend and could continue to fall to the downside.
If The support trendline has been broken, this will be a great sell opportunity.. if it struggles to break, then it will be a great buy opportunity. Keep an eye!

Double Top Confirmed! Is Gold About to Fall Deeper?As expected from my previous idea , Gold touched its target of $4,183 ( the double top pattern’s target(Small) ). Before reaching that target, it had some ups and downs over the past few days, mainly due to the ongoing US-China tensions .
Gold is trading near a Support zone($4,193 – $4,156) .
From a classical technical analysis perspective, it’s forming a clear double top pattern on the 1-hour timeframe . There’s also a regular bearish divergence (RD-) visible between the two peaks of the double top.
From an Elliott Wave theory standpoint, it looks like Gold has started its corrective wave. If the Support zone($4,193 – $4,156) and the double top pattern’s neckline break , we can expect further downside .
I expect that after breaking the Support zone($4,193 – $4,156) and the neckline , Gold could drop at least to around $4,083(First Target) .
Second Target: $4,057
Stop Loss(SL): $4,385(Worst)
Note: Keep in mind that given the ongoing US-China tensions, any news could invalidate this analysis. So it’s more important than ever to manage your risk carefully these days.
Please respect each other's ideas and express them politely if you agree or disagree.
Gold Analyze (XAUUSD), 1-hour time frame.
Be sure to follow the updated ideas.
Do not forget to put a Stop loss for your positions (For every position you want to open).
Please follow your strategy; this is just my idea, and I will gladly see your ideas in this post.
Please do not forget the ✅ ' like ' ✅ button 🙏😊 & Share it with your friends; thanks, and Trade safe.

Gold 1979 vs 2025 — When History Whispers and Markets Listen
🌕 1. The Echo of 1979
In 1979, the world watched Gold do the impossible. The metal surged from $226 to over $850 per ounce in less than a year, a 275% explosion that turned fear into fortune.
The triggers were seismic.
🇮🇷 The Iranian Revolution disrupted global oil flows.
🏛️ The U.S. Embassy hostage crisis fueled geopolitical panic.
⚔️ The Soviet invasion of Afghanistan reignited Cold War fears.
💸 And double-digit inflation in the U.S. shredded faith in the dollar.
By early 1980, panic replaced logic. Every newspaper screamed, “Buy Gold before it’s too late!” Then came Paul Volcker’s shock therapy as interest rates jumped above 15% and COMEX doubled margin requirements. Within eight weeks, Gold fell more than 40%, marking the end of one of the most dramatic speculative manias in modern history.
🔁 2. Fast-Forward to 2025: The Parallels Are Uncanny
The world of 2025 looks hauntingly similar.
🕰️ 1979 🔮 2025
Iranian Revolution and Cold War tensions Gaza war, U.S.–China decoupling, and regional instability
Oil shock and inflation Energy disruptions and persistent post-pandemic inflation
Dollar under pressure Record U.S. debt and fiscal erosion
Panic buying of Gold Central bank accumulation and retail FOMO
Fed under Volcker turns hawkish Fed under Powell trapped between cuts and control
By late August 2025, gold sat quietly near $3,415, then erupted into a seven-week vertical rally above $4,300, a mirror image of 1979’s euphoric climb. But just like back then, euphoria was the prelude to exhaustion.
⚠️ 3. The Anatomy of the Current Crash
On October 17, 2025, Gold plunged $250 in one day, a shocking 5–6% drop that broke its parabolic structure and sent fear rippling across markets.
What triggered it?
🏦 A hawkish shift in the Federal Reserve’s language as officials hinted rate cuts might be delayed.
💰 Real yields surged, breaking the inverse correlation that had fueled gold’s climb.
🏛️ Institutional profit-taking hit record levels, confirmed by rising COMEX open interest and volume.
🗞️ Sentiment flipped overnight as headlines shifted from “Gold to $5000” to “Gold crashes $250.”
The move marked the first true break of structure (CHoCH) since the rally began, historically the signal that smart money is quietly exiting.
🔍 4. Lessons from 1980 — The Signs of a Top
Before gold crashed in 1980, five clear warning signs appeared.
⚙️ 1979–1980 Signal 💡 2025 Equivalent 🧭 Status
Fed turns hawkish Powell signals “pause / higher for longer” ⚠️ Emerging
Rising bond yields vs. flat Gold Real yield divergence ✅ Confirmed
Parabolic candles Daily range above $100 ✅ Seen
Media frenzy “Gold to $5000” hype ✅ Seen
Margin hikes and record OI Record COMEX participation ⚠️ Rising
Four out of five signals are already flashing. History teaches that when everyone believes Gold can only rise, it’s often about to fall.
🧭 5. What Smart Traders Should Do Now
🟡 Phase 1 – Immediate Protection (Next 24 Hours)
If you’re long, secure 50–75% of gains and protect above $3,950.
If you’re short, trail stops to $4,200 and look for targets at $3,950 → $3,800 → $3,600.
If you’re flat, stay patient and wait for at least two daily candles of stabilization before acting.
🟠 Phase 2 – Stabilization (Next 3–5 Days)
Watch for:
🕯️ Long lower wicks on daily candles show buyer absorption.
📉 Shrinking COMEX volume indicates exhaustion of sellers.
📊 Flat or falling real yields confirming support.
🔵 Phase 3 – Re-evaluation (Next 1–2 Weeks)
If gold reclaims $4,000+ with strength and Fed tone softens, a controlled re-rally may begin. If Gold stays below $3,800, the correction likely extends toward $3,500, the same 30–40% retracement seen in 1980.
🧘♀️ 6. Beyond the Chart — Discipline Over Drama
When a $250 candle appears, instincts scream, “Do something!” But professionals know the truth: reaction destroys capital, observation preserves it. The coming days are not about prediction but about posture. Stay liquid, track sentiment, watch real yields, and remember that even in 1980, Gold’s crash didn’t end its story — it simply reset the cycle for the next era of accumulation.
✨ History doesn’t repeat, but it rhymes. In 1979, Gold taught us that fear creates bubbles. In 2025, it’s reminding us that even truth needs a pullback before it shines again.
If this article helped you today and brought you more clarity:
Drop a 🚀 and follow us✅ for more trading ideas and trading psychology. Thank you.

GOLD .. breakout ? whats next??#GOLD... just broke our supporting area of 4025
sustain below means further drop expected..
good luck
trade wisely

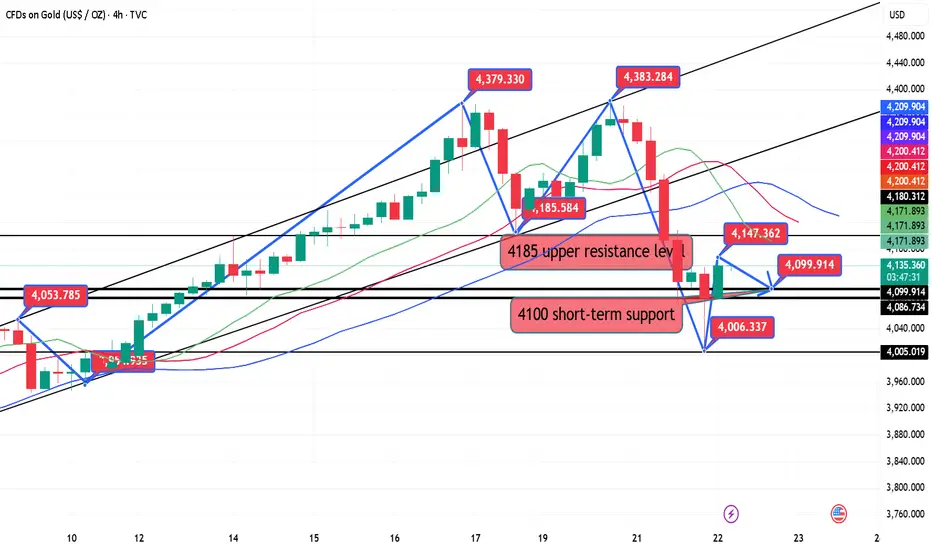
10.22 Gold continues to correctAfter forming a double top early Tuesday morning, gold has been experiencing resistance during Tuesday's Asian session, signaling a potential Waterloo. As of Wednesday's Asian session, gold hit a low of 4004 before rebounding above 4100, a bullish consolidation. Gold is currently trading in a range-bound environment. We continue to monitor the 4147-50 resistance level, which also marked the resistance level at midnight Tuesday. Gold prices retreated after hitting this resistance level several times last night. During the day, we will monitor the upward resistance level. If gold fails to break through, we will maintain a volatile trading strategy. We will prioritize shorting within this resistance level.
From the 4-hour chart, we are currently focusing on the 4147-4150 resistance level for the upside, while the -4085-4100 support level is expected to remain. If bulls fail to break through, gold will likely continue its range-bound correction. Trading strategies should prioritize trading within this range. In the intermediate range, we should be cautious about buying orders and wait patiently for key entry points. I'll provide detailed trading strategies during the trading session, so please stay tuned.
Gold Trading Strategy:
1. Short gold with a light position at 4147-4150, stop loss at 4156, target at 4085-4100. Hold if it breaks through!
2. Go long gold at 4085-4095, stop loss at 4078, target at 4145-50. Hold if it breaks through!
What do you think 4085 gold buys or sellsBased on recent trading ideas for Gold on TradingView, the price level around 4085 is often cited as a key technical level:
Support/Buy Zone: Many analyses view the area around $4085 - $4090 as a critical support level or a demand zone. If the price drops to this level and shows signs of reversing (like a bullish candlestick pattern), it's often seen as a good opportunity to BUY (go long), expecting the price to rebound.
Invalidation/Sell Trigger: Conversely, if the price breaks clearly and holds below $4085 (or the nearby support zone), it is often considered an invalidation point for the bullish view. This breakout below support would typically signal a shift to a bearish bias, leading traders to consider SELL (go short) positions with targets at lower levels.
Decision Zone: In some cases, $4085 is part of a larger "Decision Zone" (e.g., $4085–$4125), where the market's reaction dictates the next short-term trend.
In summary, a "4085 gold buys or sells" TradingView idea is likely suggesting:
BUY (Long) if the price holds above or bounces from $4085.
SELL (Short) if the price breaks and closes convincingly below $4085.
