Gold suffers biggest crash since 2013: What’s next for metal?Gold just experienced its worst single-day crash since 2013, plunging over 8% from record highs after forming a double top.
What’s behind this dramatic move, and what’s next for gold?
After a strong rally driven by fiscal and trade uncertainty and delayed US economic data, gold suddenly tumbled to the $4,000s. This sharp drop comes amid technical overextension and ahead of a crucial US CPI report due Friday, with the government shutdown still adding to market uncertainty.
Overextended : Gold was heavily overbought on multiple timeframes (4-hour, daily, weekly, monthly), with a double top and weakening RSI signalling a correction was due.
Profit-taking ahead of CPI : Many traders secured profits before Friday’s CPI report, with consensus expecting inflation to tick up, potentially impacting Fed rate expectations and the US dollar.
Trade developments : De-escalation between the US and China, with Trump and Xi set to meet at APEC, reduced some risk premium that had supported gold.
Support and scenarios : Strong support levels remain, with a possible further downside to the 38.2% Fibonacci retracement (~$3,945), but a deeper drop to $3,735 is seen as unlikely unless catalysts turn more bearish.
Volatility is back in the gold market! Will this correction turn into a longer consolidation, or is it just a pause before new highs?
Watch the key levels and upcoming CPI data, and remember—trade smart, respect your risk, and cash out when needed!
This content is not directed to residents of the EU or UK. Any opinions, news, research, analyses, prices or other information contained on this website is provided as general market commentary and does not constitute investment advice. ThinkMarkets will not accept liability for any loss or damage including, without limitation, to any loss of profit which may arise directly or indirectly from use of or reliance on such information.
Goldprediction

Gold 1H – Bearish Reaction After Consecutive Gains🟡 XAUUSD – Intraday Trading Plan | by Ryan_TitanTrader
📈 Market Context
After several sessions of steady gains, gold is showing signs of exhaustion as U.S. Treasury yields stabilize and traders reassess the Federal Reserve’s next move.
The market’s focus today is on U.S. housing data and Fed officials’ remarks, which could shape expectations for the December policy outlook.
• A hawkish tone from policymakers may strengthen the dollar and pressure gold lower.
• Conversely, softer remarks could briefly trigger buying around key discount zones, but the overall tone remains corrective after the recent rally.
Market liquidity is concentrated near the $4,230 area — where price may tap into unmitigated supply before continuing its bearish leg.
🔎 Technical Analysis (1H / SMC Style)
• Structure: The overall bias has shifted bearish following consecutive ChoCH and BOS formations.
• Premium Zone: The 4,230–4,228 area aligns with an H1 order block and previous liquidity pool — a prime zone for short re-entry.
• Liquidity Sweep: The recent upside push toward 4,230 may sweep late buyers before the next bearish leg unfolds.
• Discount Zone: Short-term liquidity may rest around 4,080–4,100, which aligns with previous sell-side imbalance (SSI) and acts as an intraday reaction zone.
🔴 Sell Setup
• Entry: 4,230 – 4,228
• Stop-Loss: 4,240
• Take-Profit Targets: 4,100 → 4,080 → 4,050+
🟢 Buy Scalp Setup (Short-Term Countermove)
• Entry: 4,081 – 4,083
• Stop-Loss: 4,074
• Take-Profit Targets: 4,100 → 4,115
(Only valid if liquidity sweep confirms reaction within discount zone)
⚠️ Risk Management Notes
• Confirm M15 BOS/ChoCH before entry — avoid blind orders during news.
• Reduce position size for scalp entries; primary directional bias remains bearish.
• Lock partial profits near first liquidity targets and trail stops as structure confirms continuation.
✅ Summary
Gold faces near-term correction pressure after multiple bullish sessions.
The 4,230–4,228 zone offers a clean premium OB entry for continuation shorts, while reactive buyers may scalp intraday from 4,081 if liquidity sweeps occur.
Stay adaptive — today’s sentiment is short-term bearish within a larger range-bound structure.
FOLLOW RYAN_TITANTRADER for daily SMC setups ⚡

Attractive Bullish Gold SetupHey, it’s Erik!
XAUUSD is currently in a fascinating phase. After a strong pullback from the upper boundary of the ascending channel, gold is now heading toward the lower boundary. This region aligns with a key support zone, and a potential reaction here could propel the price back upward.
If buyers manage to defend this level, the potential for a rise to $4,380 is significant. This level coincides with the middle of the channel and previous resistance, making it a logical short-term target in this bullish market structure.
However, there’s an important caveat. If the market fails to hold this support, the bullish scenario could lose its validity, and we might see a continuation of the downward trend. That’s why it’s crucial to wait for clear confirmation before entering. A rejection wick, increased buying volume, or a bullish engulfing pattern are all key technical signals to watch for the right entry point.
So, what do you think? Ready to seize this opportunity, or do you see other risks? Share your thoughts with us!

OOO GOLD IS THAT A DOUBLE TOP?I feel like I see a double top formed on the daily! The real test will come with the fib pull back in the 4249-4255 price range but only price will show us but I think we are seeing a key area for gold and If I had to choose I would say we may be heading for a minor pullback to let off some steam and also take some par profits!
Let me know yall thoughts tho and what do you think! GD luck tomorrow, I cant wait for the NY session.

Gold - Sell around 4150, target 4120-4080Gold Market Analysis:
Yesterday's gold price plunge marked its largest single-day drop in several years. The previous rally was as exhilarating as the current decline. Markets are like this, and after all, there are always surprises. The 4-hour chart formed a large M-shaped pattern at a high level, signaling a short-term top. At least in the short term, gold will struggle to rally again. The market will essentially undergo a correction and adjustment. If the weekly chart fails to close above this level in the next three days, it will likely signal a significant top. The weekly chart has closed positive for nine consecutive weeks, so a negative close this week is unlikely. We are simply followers, following the trend rather than fighting it. Yesterday's market action provided an unforgettable memory for investors who prefer to speculate on the market without risking losses. Today, we need to wait for a rebound to see if there's an opportunity for correction and adjustment.
Yesterday's hourly rebound reached 4150 at the end of trading. It then plunged in the early Asian session before rebounding again, indicating that the hourly level has bottomed out. Today, the price needs to correct within a range. We are currently unsure of the high point of this correction. Opportunities can be found on the 15-minute and 30-minute charts during the Asian session. For hourly trading, focus on the 4150-4080 range. Gold has been experiencing significant volatility recently, and I've repeatedly reminded everyone to take stop-loss orders.
Resistance levels are 4130 and 4150, while support levels are 4080 and 4050. The dividing line between strength and weakness is 4150.
Fundamental Analysis:
Watch the EIA crude oil inventory data today.
Trading Recommendation:
Gold - Sell around 4150, target 4120-4080.

mrmoney limited XAU/USD swing trading ideaprice approached our 4hours QMR and daily timeframe engulfing candle/trendline

Analysis of the latest gold price trends today!Market News:
Spot gold prices continued their sharp decline in early Asian trading on Wednesday (October 22nd), currently trading around $4,020 per ounce, a drop of nearly $130. Amidst the volatile global financial markets, the London gold price is once again facing a severe test of gold's status as a traditional safe-haven asset. Yesterday, gold prices suffered a sharp drop, plummeting 5.3% in a single day, nearly $300, marking the largest single-day drop since August 2020. This plunge was not an isolated incident, but rather the result of a confluence of factors, including investor profit-taking, weakening safe-haven demand, and subtle shifts in the macroeconomic environment. International gold prices have risen by approximately 60% this year. This "flash crash" not only rattled global investors but also reflected the complex dynamics of international geopolitics, economic policies, and currency markets. In the short term, gold prices may enter a period of consolidation. While this plunge may present a buying opportunity for investors, investors should remain vigilant to potential impacts from inflation data and the Federal Reserve meeting. While gold's safe-haven myth has been temporarily shattered, its core value as a hedge remains unchanged. Amidst continued global uncertainty, rationally allocating gold assets may be a wise choice to weather future storms.
Technical Analysis:
Gold experienced a historic plunge, with a single-day drop of nearly 400 points. After reaching a high of $4,381 per ounce, the price plummeted to $4,000, a move widely interpreted by the market as a sharp correction from its recent rapid rise. The end of Diwali gold buying demand in India, a rebound in the US dollar, and the absence of US futures market data due to the government shutdown all contributed to the sell-off. The market is showing signs of a bubble, and this plunge is an inevitable correction after the rally has peaked. The subsequent trend will focus on the sustainability of this decline and the price struggle around key levels. Assuming the global macroeconomic backdrop remains unchanged, gold still has upward momentum in the medium to long term, but the risk of sharp fluctuations in the short to medium term has significantly increased.
Gold Intraday Trading Strategy:
Short-term gold long at 3950-3955, stop loss at 3940, target at 4050-4080;
Short-term gold short at 4100-4105, stop loss at 4115, target at 4000-4030;
Key Points:
First Support Level: 4000, Second Support Level: 3980, Third Support Level: 3955
First Resistance Level: 4080, Second Resistance Level: 4100, Third Resistance Level: 4130

Gold price analysis October 22GOLD UPDATE – Strong Correction Pressure Appears
After a long rally, gold witnessed a sharp decline yesterday, with a deep correction of up to 300 prices - a rare number in the recent period. This shows that profit-taking pressure from buyers is increasing, and the short-term correction trend may continue today.
In the context of the temporary pause in the uptrend, the resistance zones above will play an important role in observing price behavior. If there is a clear price rejection signal at these zones, the priority strategy will be to SELL according to the correction wave.
📉 SELL trigger: When there is a price rejection at the resistance zone of 4179 - 4226
🎯 Target: 3946
The short-term trend is leaning towards a downward correction, so keep a close eye on the price reaction to avoid missing out on the opportunity to trade in the right direction.

A game for the brave. Please participate.Amidst the surging tides of the trend, every ship appears adept. But the true test isn't speed, but staying at sea. Survival is more important than success. Respect the market. Quaid hopes everyone can maintain a steady pace amidst volatility and reap their own wave of wealth.
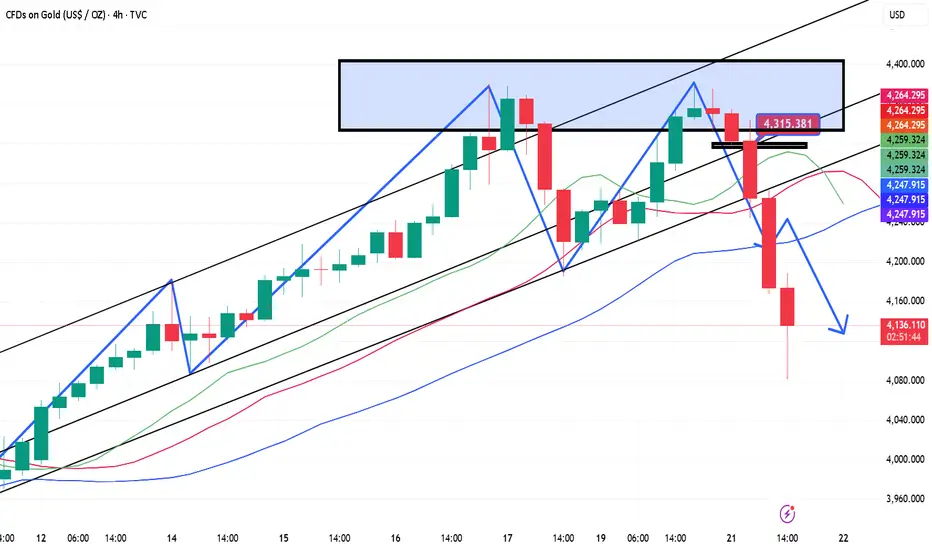
Gold prices retreated after reaching a high of 4381 on Monday. Early analysis indicated a potential "double top" pattern.
Based on the previous daily fluctuations of around $100, initial expectations suggested a range-bound market fluctuation of 4381-4270. However, the actual trend far exceeded expectations. Prices plummeted from the 4381 high, triggering a sell-off, with the largest single-day drop reaching $300. This market action further demonstrates market uncertainty. Quaid advises everyone to maintain a cautious approach and strictly set stop-loss orders, whether long or short.
A sharp decline is always preceded by a rebound. Prices declined in early Asian trading, not incrementally. Irrational declines will eventually reverse. Don't be intimidated by the market at this time. Don't trade with a normal mindset. Position management is paramount. A 10-point stop-loss is completely unbearable right now, so reduce your position size to about one-third of your normal size.
When the market plummets or soars, you can open positions in batches to keep the total transaction loss within the controllable range of the account.
For short-term trading, you can enter short positions around 4130. I'll update specific trading strategies on the channel, so stay tuned.

$GOLD Rally Pause – Will the Golden Fib Hold?TVC:GOLD has seen a strong rally after months of accumulation, but the recent sharp pullback looks like a healthy correction rather than a trend reversal.
Currently, price is approaching the Golden Fib Zone (0.5–0.618), an area that often acts as a strong support during ongoing uptrends. If the price manages to hold this zone and form a solid base, we could see the next leg higher, potentially leading to new highs.
For now, the focus remains on how price reacts at this Fib zone, a bounce here could confirm continuation, while a breakdown below may signal a deeper correction.
DYOR, NFA
THANKS FOR THE READING

Accurately grasp every trading opportunity,do you dare to followGold prices fell sharply in the evening due to the news, with a daily drop of nearly $300. Judging from the daily chart, the large real negative line almost swallowed up all the gains last week, and the bears have absolute control over the market.
Since this morning, Allen has been reminding everyone to pay attention to the M-shaped double-top structure and be alert to the possible sharp market correction. Even if you fail to keep up with our trading rhythm, as long as you refer to my ideas and read them carefully, you can at least effectively avoid being washed out by the market.
As gold continues to fall, various voices have appeared in the market. Bros must keep their eyes open when referring to them. After all, not everyone is as brave as Allen in facing mistakes and losses.
As I said, the bears are currently dominating the market. Although the decline has stagnated slightly in the short term, the downward trend has not completely stopped. It will be difficult for the bulls to recover all their lost ground tonight. The current gold price is hovering around 4110. If it continues to fall, you can pay attention to the short-term support of 4060-4050 below. Try to go long with a light position, set a stop loss, and look for support at the 4000 integer mark if it breaks.
OANDA:XAUUSD

The M top has formed and the bull market has endedDuring the Asian session today, we took profits on our long position in gold and then entered a short position in the European session, both yielding substantial gains (this can be verified on my free channel).
Technically, gold prices are likely forming a short-term "double top" pattern. The current downward trend is quite clear, with the hourly low during the European session around 4168. Recently, gold triggered sharp declines after testing 4381 twice, indicating significant selling pressure above. Additionally, the rapid rebound to 4250 after breaking below 4200 last Friday was more of a buying defense driven by bullish sentiment. However, the probability of a rebound today is extremely low— the impact of last Friday’s plunge has not been fully absorbed, and today’s renewed slump has undoubtedly dealt a second blow to bullish confidence.
Attention should be focused on the 4180 support level below. If it is breached, the bullish trend for gold may come to a complete end.
Gold is currently in a state of panic selling. It is advisable to remain on the sidelines for now, and wait to enter the market until the selling sentiment subsides and the market stabilizes, so as to avoid losses from a market washout that triggers a double wipeout of both long and short positions.

GOLD 1H CHART ROUTE MAP UPDATE & TRADING PLAN FOR THE WEEKHey Everyone,
Please see our updated 1h chart levels and targets for the coming week.
We are seeing price play between two weighted levels with a gap above at 4275 and a gap below at 4229. We will need to see ema5 cross and lock on either weighted level to determine the next range.
We will see levels tested side by side until one of the weighted levels break and lock to confirm direction for the next range.
We will keep the above in mind when taking buys from dips. Our updated levels and weighted levels will allow us to track the movement down and then catch bounces up.
We will continue to buy dips using our support levels taking 20 to 40 pips. As stated before each of our level structures give 20 to 40 pip bounces, which is enough for a nice entry and exit. If you back test the levels we shared every week for the past 24 months, you can see how effectively they were used to trade with or against short/mid term swings and trends.
The swing range give bigger bounces then our weighted levels that's the difference between weighted levels and swing ranges.
BULLISH TARGET
275
EMA5 CROSS AND LOCK ABOVE 4275 WILL OPEN THE FOLLOWING BULLISH TARGETS
4320
EMA5 CROSS AND LOCK ABOVE 4320 WILL OPEN THE FOLLOWING BULLISH TARGET
4360
BEARISH TARGETS
4229
EMA5 CROSS AND LOCK BELOW 4229 WILL OPEN THE FOLLOWING BEARISH TARGET
4194
EMA5 CROSS AND LOCK BELOW 4194 WILL OPEN THE FOLLOWING BEARISH TARGET
4151
EMA5 CROSS AND LOCK BELOW 4151 WILL OPEN THE SWING RANGE
4122
4075
EMA5 CROSS AND LOCK BELOW 4075 WILL OPEN THE SECONDAARY SWING RANGE
4022
3955
As always, we will keep you all updated with regular updates throughout the week and how we manage the active ideas and setups. Thank you all for your likes, comments and follows, we really appreciate it!
Mr Gold
GoldViewFX

GOLD FUTUREs near its resistanceThe unprecedent rally in GOLD nearing its peak as per Elliott WAVE cycle.
Wave 'C' of ABC wave will terminate its golden ratio of expansion 1.62 time of wave A.
IF $4122 is not breached then you may see a great fall in price as there is huge runup in this metal.
Investors; don't do anything
Traders; BOOK PROFITs before the price falls

Is the plunge in gold prices a trend or a correction?
News:
Recent fiscal and political uncertainty in the United States continues to linger, with the recurring risk of a government shutdown and the slow pace of fiscal negotiations disrupting economic data releases and expectations management. On the monetary policy front, market expectations for further Fed rate cuts persist, forming a "mildly dovish" psychological anchor alongside the Fed's forward guidance. This limits the upward potential for real interest rates, favoring gold, a non-yielding asset. Meanwhile, geopolitical tensions remain, reinforcing the value of safe-haven assets. Furthermore, any unexpected surprises in the upcoming US inflation report could trigger a repricing of the interest rate path, potentially significantly increasing short-term volatility.
The dollar's temporary strength is primarily driven by the resilience of the equity market and the stickiness of short-term yields. However, this "strength" reflects more of a short-term suppression than a trend reversal. If inflation and growth weaken marginally, or if the market re-prices its assumption of two rate cuts, the dollar will have room to retreat, and gold could gain additional momentum.
Specifically:
Structural bullish: From a long-term perspective, gold prices have completed a large M-shaped upward trend. If they fail to break below the effective support level of 4100, the theoretical target range could gradually move towards 4200-4300 (corresponding to the linkage between trend continuation and rising risk premiums). This path relies on the macroeconomic combination of continued geopolitical uncertainty, falling inflation, and lower interest rates, which has not been overturned.
Trading strategy:
Buy: 4085-4075, SL: 4060, TP: 4145-4180

10.21 Gold Intraday Short-Term Trading GuideGold currently has a clear double top on its 4-hour chart, with Friday's low of 4186 acting as the neckline. If it falls below 4186, a double top will form, and the downward trend will accelerate. In the short term, it is likely to move further towards the 4100-4080 area. If it does not break through 4186, the market will rebound again.
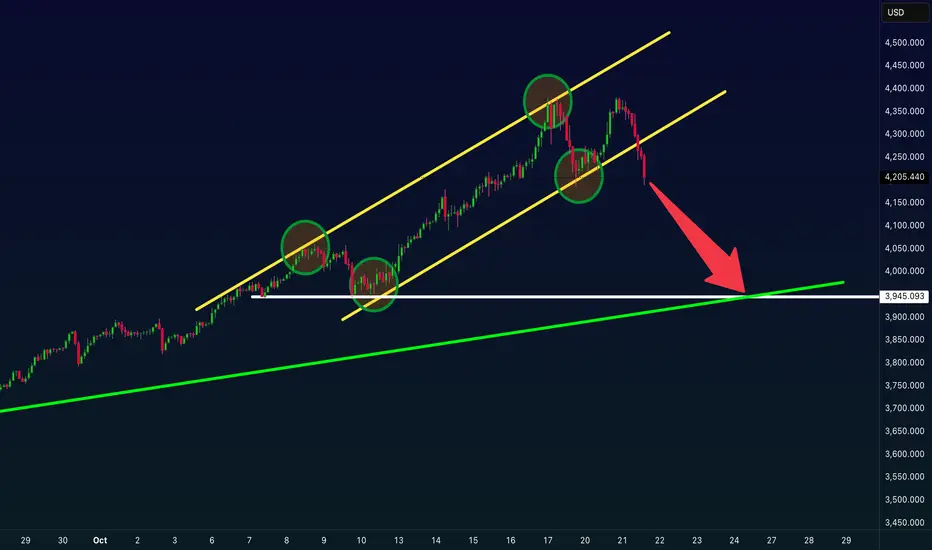
Gold WEEKLY Neowave Analysis (Potential Top Forming)The top in Gold may be forming; however, confirmation requires a larger and faster decline than the strongest counter-trend wave observed within this entire structure. This phase represents one leg of a multi-decade diametric formation. The pattern itself is a newly identified structure within the realm of NeoWave theory, and much of this analysis is based on the Gold chart of Mr. Glenn Neely.
The price is should break below $3,850 before the end of March 2026, and this move could occur much sooner. However, this timeframe represents the maximum limit before the outlook becomes invalid.
I will post an update regarding the future of Gold , once we get a confirmation

GOLD Breakout? Support broke??#GOLD... So market just broke his supporting area that was actually 4186-87
Keep close and sustain below can create further volume for short
Good luck
Trade wisely

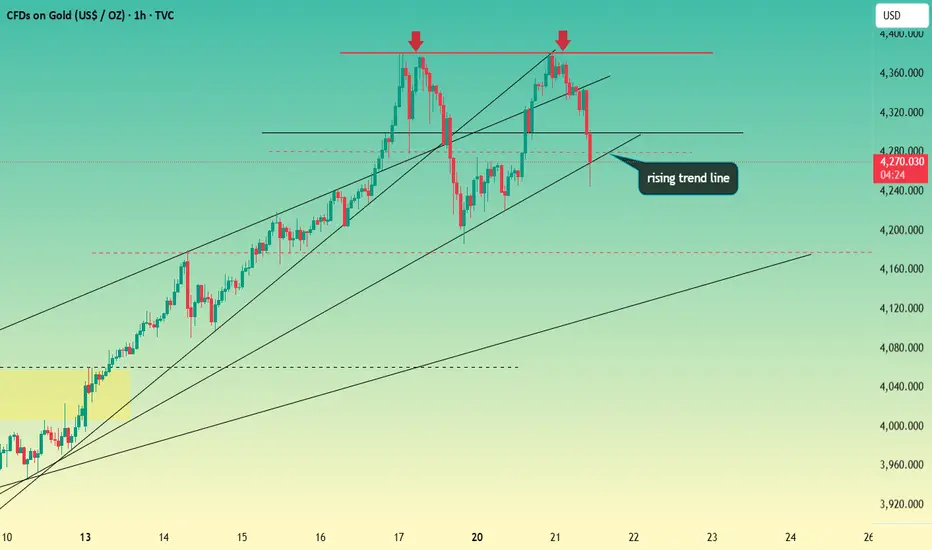
Gold Double Top Forming – Correction Ahead?When an asset hits an All-Time High(ATH) , technical analysis can get a bit tricky because there’s no historical resistance above and the usual technical rules might have less impact. However, right now it seems like some technical principles are still visible on gold’s chart, at least on the 1-hour timeframe , and I’d like to share that with you.
At the moment, Gold has broken below the lower line of its ascending channel, the Support zone($4,320 – $4,279) , and the neckline of a Double Top Pattern . This could indicate the start of a short-term correction. Given how strong gold’s momentum has been in recent weeks, this correction might not last too long since gold remains very attractive globally.
From an Elliott Wave perspective , the formation of a double top pattern might signal the end of an impulsive wave and the beginning of a corrective phase .
I expect that in the next few hours, Gold could at least drop to the Double Top Pattern’s target around $4,183 . If Gold breaks the Support zone($4,193 – $4,156) , we could see a deeper correction .
Second target:$4,143
Stop Loss(SL): $4,385(Worst)
Please respect each other's ideas and express them politely if you agree or disagree.
Gold Analyze (XAUUSD), 1-hour time frame.
Be sure to follow the updated ideas.
Do not forget to put a Stop loss for your positions (For every position you want to open).
Please follow your strategy; this is just my idea, and I will gladly see your ideas in this post.
Please do not forget the ✅ ' like ' ✅ button 🙏😊 & Share it with your friends; thanks, and Trade safe.

Time for GOLD To DROP! (is XAUUSD heading to the downside?)For weeks gold (XAUUSD) has been sky rocketing to the upside, however there have been many new signals indicating that it could be a bearish move to the downside. Nothing keeps going up forever! Gold has broken major support levels + trend line and channel breakout. Time to sell!
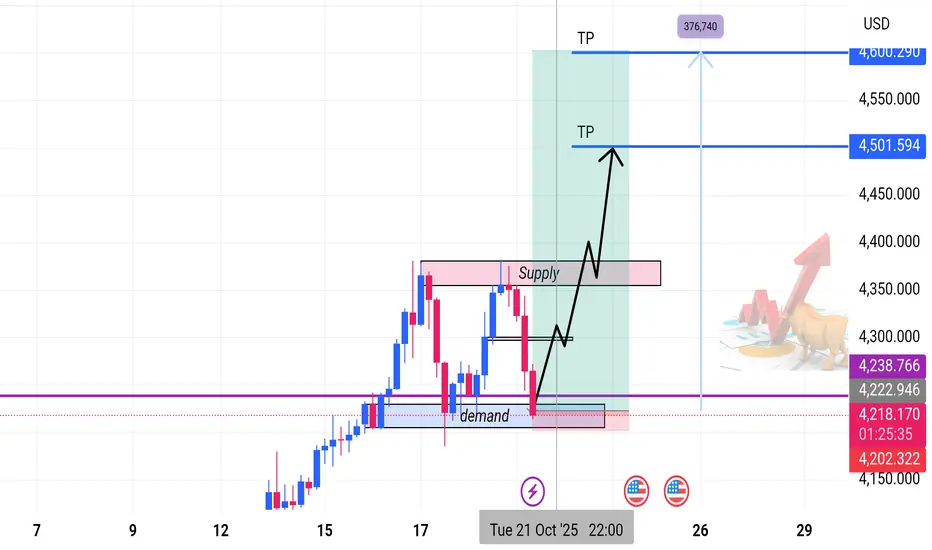
Bullish Continuation from Demand Zone | 4H SetupOverview:
Gold is maintaining a strong bullish structure on the 4-hour timeframe, forming consistent higher highs and higher lows.
Recently, price tapped into a key Demand Zone, showing a clear rejection and early signs of buyer re-entry — signaling a potential continuation of the uptrend.
Technical Outlook
• Trend: Bullish market structure intact.
• Current Price: ~4,230.34
• Demand Zone (Buy Zone): Price has bounced from a major demand area — indicating renewed buying pressure.
• Reversal Confirmation: Rejection wicks and bullish candles confirm demand reaction.
• Supply Zone (Resistance): Overhead supply remains the key obstacle. A break and close above it could trigger a strong rally toward the next resistance.
Trade Setup
Parameter Level (Approx.) Description
Entry (Buy Zone) 4,230.34 Reaction from demand zone
Take Profit 1 (TP1) 4,501.59 Conservative target
Take Profit 2 (TP2) 4,576.74 Extended target
Stop Loss (SL) ~4,200.00 Below demand zone
Market Outlook
As long as the demand zone holds, the bullish structure remains valid.
A confirmed break above the supply zone could invite strong momentum toward higher targets.
Failure to hold the demand base may trigger a corrective move lower — hence, risk management remains crucial.
Bias: 🟢 Bullish
Timeframe: 4H
Strategy: Supply & Demand | Market Structure | Price Action
GOLD Resistance? what's next??#GOLD.. perfect move as per our last idea regarding gold cut n reverse area.
now market just broke his supporting region and if market hold that region than it will convert to resistance area.
that is around 4281-892 to 4287-88
keep close and holding or that region means we can expect a further dip .
NOTE: we will go for cut n reverse above that region on confirmation.
good luck
trade wisely

What to do after the plunge? Strategy has been updatedGold opened higher today, testing the peak at 4381 before coming under pressure and declining. During the session, it pulled back to a low of 4317, rebounded to around the 4345 level, and then started a cascading drop. Currently, it is consolidating with fluctuations near 4266.
We have only executed one successful trade during the Asian session so far today, and all traders who followed the operation have gained good profits. As this wave of gold's decline is relatively rapid, for prudence, we can first observe the market temporarily and will inform everyone when there is an opportunity for operation.
Trading Strategy
Keep an eye on the trend during the European session.
If gold fluctuates weakly in the European session, we will go short when it rebounds in the US session.
If gold rebounds strongly in the European session, we will go long on gold when it pulls back in the US session.
I will update trading signals in real time in the channel. You can follow it if needed.