Gold has not fallen below the $4,000 mark, so what's next?
News:
The Federal Reserve cut interest rates by 25 basis points as expected on Wednesday. However, to the market's surprise, Powell released an extremely hawkish signal, stating that a December rate cut is "far from a certainty," which directly caused a market crash. US stocks fell from their highs, the dollar rose, and gold and silver markets plummeted. The Fed also postponed the pause in its balance sheet reduction program until December.
This has temporarily tightened market expectations for a December rate cut, meaning that the expectation of a rate cut has temporarily failed to materialize. However, there is still more than a month until mid-December, and with fluctuations in data, expectations are likely to rise again.
Specifically:
Gold hourly chart: Today's price action was relatively volatile, with poor continuity and high deceptiveness. For example, the large bearish candle at 11:00 AM led many to believe a breakdown and weakness, following the overnight decline. However, a small W-shaped rally broke through the morning's opening price level.
Trading strategy:
Buy:3965-3960, SL: 3950, TP: 3980-4010-4030
Goldprediction
Gold Under Pressure as USD Recovers📊 Market Overview:
Gold (XAU/USD) trades near $4006/oz, extending its pullback as the U.S. dollar strengthens and Treasury yields rebound.
Traders are cautious ahead of upcoming U.S. PMI and PCE data, which could shape expectations for the Fed’s next rate move.
📉 Technical Analysis:
• Key resistance: $4030 – $4050
• Nearest support: $3990 – $3975
• EMA09 (H1): Price remains below EMA09, confirming short-term bearish bias
• Candle/volume/momentum: Consecutive bearish candles with long upper wicks indicate strong selling pressure; RSI near 40 shows more downside potential.
📌 Outlook:
Gold may extend its short-term decline if USD strength persists and yields stay elevated.
However, $3990 – $3975 remains a potential rebound zone if a bullish rejection candle appears.
💡 Trade Setup:
🔻 SELL XAU/USD at: $4047 – $4050
🎯 TP: 40 / 80 / 200 pips
❌ SL: $4053
🔺 BUY XAU/USD at: $3975 – $3977
🎯 TP: 40 / 80 / 200 pips
❌ SL: $3972

Range trading, opportunities exist for both bulls and bearsGold prices fluctuated throughout yesterday, breaking through the intraday high in the evening and reaching near the previous high again, ultimately closing positive on the daily chart, essentially at the highest price. During the Asian session, prices rose another $30, touching around 4046, before slightly retreating. Judging from the recent trend of gold prices, the price has been fluctuating and neither the bulls nor the bears have been able to sustain their gains. Gold prices have once again reached high levels. After several rounds of fluctuations of 150 points each, the current support and resistance levels are quite clear. Gold prices are oscillating between 3900 and 4050.
This adjustment and reshuffling is a good thing. It gives those who missed the boat a chance to get on board, and it also slaps those who chased the highs in the face. The game between bulls and bears is itself an extension of the consensus of emotions.
Gold prices extended their rebound, returning to $4,050. This rebound was significant, recovering from a drop of about $500 to a gain of approximately $200. Whether this rebound represents a reversal depends on the weekly closing price. If the weekly candlestick closes as a doji, it indicates that the bulls remain strong. If the weekly candlestick continues to close negative, short-term consolidation and profit-taking will continue.
In volatile markets, both bulls and bears have opportunities; the key lies in the price level. If the Asian session rises, the European session retraces and breaks the low, and the US session surges, it's a bull trap. Once the high point appears, go short. Trading strategy: Sell gold on a rebound to 4015-4020, with a stop loss above 4045 USD, and target 3980-3960 USD on the downside. Watch for further downside targets at $3980-$3960.
XAU/USD Intraday Plan|Fed Cut Fails to Lift GoldGold broke above the 3987 resistance yesterday but failed to reach the 4042 resistance level, reversing sharply after the FOMC announcement and dropping back below 3944. The move reflected post-event volatility as markets reacted to the Fed’s cautious tone.
Price is currently trading around 3964, trending just above the MA50 but still below the MA200, suggesting early signs of stabilization while the broader short-term outlook remains uncertain. A confirmed break above 3987 could open the way toward 4042 and 4095, while failure to stay above 3944 may lead to another drop toward 3884–3820, where dip-buyers may look to step in.
📌 Key levels to watch:
Resistance:
3987
4042
4095
4137
Support:
3944
3884
3820
3781
🔎 Fundamental Focus:
The Federal Reserve cut rates by 25bps, bringing the Federal Funds Rate to 4.00%, but Chair Powell’s cautious tone during the press conference dampened market optimism.
Markets reacted with volatility as traders weighed the potential for further easing later this year. Meanwhile, the ongoing U.S. government shutdown and lingering U.S.–China trade tensions continue to cloud sentiment, keeping gold supported on dips as uncertainty remains elevated.

Gold Buy at 4080 and sell at 4240Now gold in consolidation mode and trying to book profits and make the retail traders into the trap so for now we need to be patience and buy at 4080 and close at 4240, after the fed interest cut gold will come down so sell at 4240 and wait for long selling till 3966. This method is Wd Gann inspiration i made and am still learning, this one sharing for study purpose so trade with your own analysis.

GOLD Buy and Sell Zones for the next few weeksLong term bullish gold, short term bearish.
If we break the sell zone then we might see a new bullish momentum short term.

XAUUSD Delivered Excellent profits [ 1500 pips in single Day ]
Today I gave 2 Buy setups on mine in Early EU session and 2nd on N.y session.
As I mentioned in today’s commentary session:
• I took buy trades around 3930 & 3940 area
My Tp was 3990 & 4010 , Both Targets went successfull.
Secondly I gave another setup As always ,My strategy was to buy the dips, I took buy trades from 3967-3972 area and hold it 4010 - 4020.
I’m very happy with the profits so far – .
My medium-term target 4120 is achieved, Alhamdulillah. And I'm looking for new setup now towards ATH.
Thanks to those who followed, trusted me, and made profits.

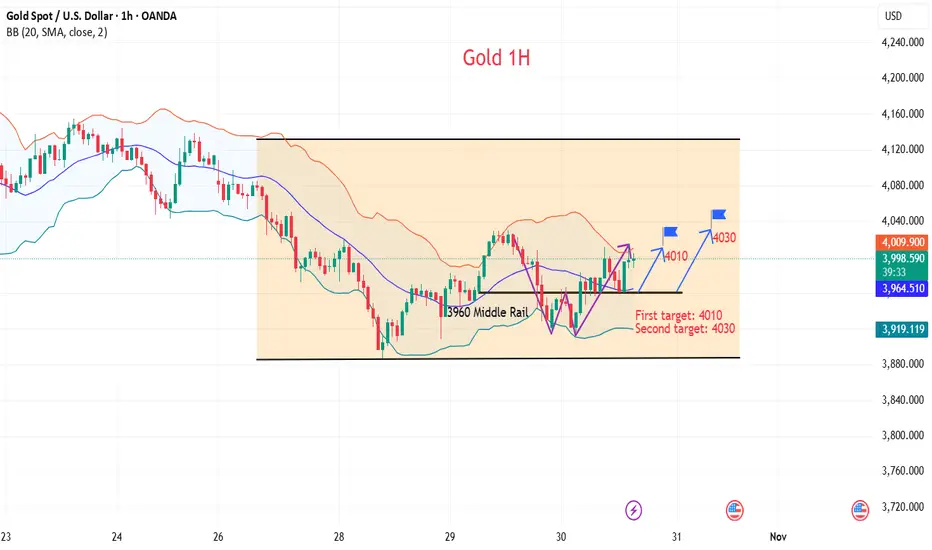
What is the purpose of this back-and-forth market manipulation?#XAUUSD OANDA:XAUUSD TVC:GOLD
Gold prices have broken through short-term resistance due to news, and the hourly and 4-hour charts show prices above the middle Bollinger Bands. Therefore, we need to adjust our strategies accordingly. However, the market is currently fluctuating rapidly, and entering the market rashly in the short term still carries significant risks. Therefore, the wise choice is to wait and see, and enter the market only after the market stabilizes. In the short term, the upside resistance level to watch remains at 4030. If gold breaks through this level strongly during the US session, the price may test 4050. The initial support level to watch is 3980-3960. If the price retraces but does not break through this level, consider taking small long positions in gold in batches, with a target of 4010-4030. Temporary adversity is the best test for traders; setbacks only make us stronger. Success belongs to the confident, opportunity belongs to the pioneers, and miracles belong to the persistent! 💪💪💪

ANFIBO | XAUUSD - Soboring today [10.30.2025]Hi traders, I'm here, Anfibo.
XAUUSD Analysis – Daily Trading Plan
Trading Plan for Today:
>>> SELL ZONE:
ENTRY: 4135 - 4150
SL: 4165
TP: 4045 - 4010 - 4000
>>> BUY ZONE:
ENTRY: around 3935
SL: 3915
TP: 4020 - 4080 - 4135 - ...
Risk Management:
- Prioritize Buy setups following the higher-timeframe trend; Sell only for intraday scalps.
- Maintain a minimum Risk:Reward ratio of 1:2.
- Avoid entries during major geopolitical or economic announcements.
- Monitor the Head & Shoulders pattern closely — confirmation will guide the next major move.
Conclusion:
Gold has completed a healthy correction after its parabolic surge to $4,400, and the market is now regrouping around the $4,000 zone, with early signs of renewed bullish momentum. As long as $3,890 remains intact, the broader trend remains bullish, and I expect a potential rebound toward $4,200 in the near term.
GOODLUCK, LOVE U GUYS!

GOLD | Daily Analysis #2 - 30 October 2025Hello and welcome back to DP,
Review and news:
Yesterday Gold pulled back slightly from recent highs after strong run-up. According to FXTrendo, it had briefly topped the psychological US$4,000/oz level, then traded around ~US$3,995. Expectations that the Federal Reserve might cut interest rates later this year remain a tailwind, which helps non-yielding assets like gold. Geopolitical uncertainties and safe-haven demand continue to underpin gold’s appeal. In summery gold remains structurally bullish, but near-term momentum is under pressure. The market is in a consolidation/correction phase while waiting for the next catalyst (Fed clarity, inflation prints, major geopolitical event).
1H – 4H Technical Analysis:
As you can observe, the major downtrend broke, the upside moving is feuled up. Demand zones are strong and 3914 zone is still irony. So if price pass and break 4024 area, there is potential to uptrend goes continuously. With analyzing the support and resistance zones, these scenarios are possible: Bearish scenario: If gold fails to reclaim the resistance zone (~4,000 +), and breaks below short-term support (~3,940), then a deeper retracement toward ~3,900 or lower becomes more likely. Bullish scenario: If gold holds above ~3,940-3,900 and the Fed or external shock triggers safe-haven flows, a move back toward ~4,050-4,100 is possible. Neutral to caution: Given the mixed signals (strong overall trend but short-term pullback), many traders may prefer to wait for confirmation (e.g., breakout above resistance or a clean bounce off support) rather than aggressively chase.
Disclaimer:
This content is for informational purposes only and does not constitute financial or investment advice. © DIBAPRISM
Amir D.Kohn

GOLD HIGH PROBABILITY SETUP SOON!!!🚨 XAUUSD HIGH PROBABILITY BUY SETUP 🚨
* Here We Can See Clearly The Next Potential Moves For GOLD Coming Hours/Days.
* Keep Your Eyes Close On Your Trading Positions.
* Happy PIP Hunting Traders.
FXKILLA.

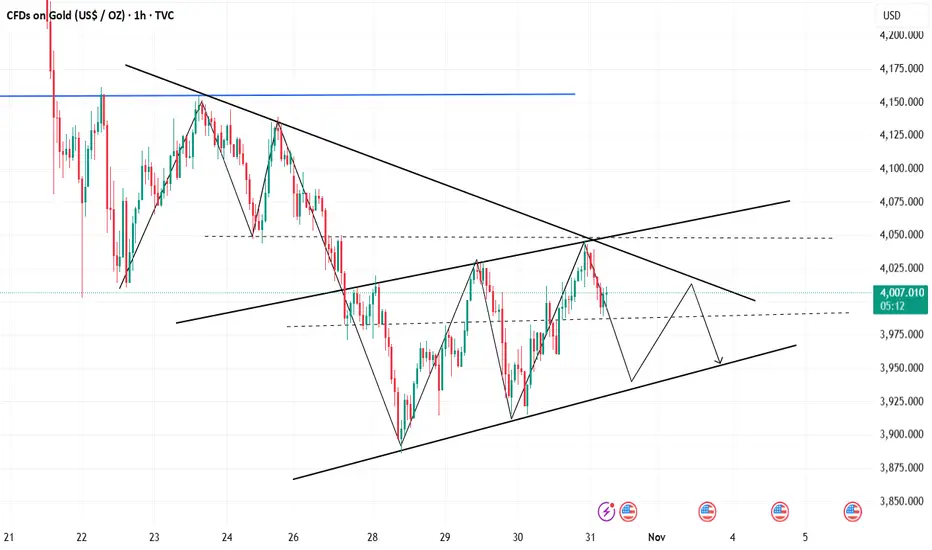
Gold Price Analysis – Will Bears Drag XAUUSD Below 3900?Gold continues to trade within a clear downward structure facing consistent resistance near the 4040–4060 zone while maintaining pressure below key descending trendlines. Price recently confirmed another Change of Character (ChoCH) near the 3972 level suggesting bearish continuation. The projection shows potential short-term pullbacks toward 3980–4000 followed by a deeper drop toward targets at 3901 and 3857.
Unless bulls reclaim the 4063–4128 resistance the overall bias remains bearish with expectations of further downside toward the $3,816–$3,850 support range.
Regarding the Fed meeting tomorrow markets widely expect a 25 bps rate cut which is already priced in. The real impact will come from the Fed speech if the Fed hints at further easing (a dovish stance) gold may bounce higher as the dollar weakens. But if the Fed sounds cautious or signals a pause gold could drop sharply as yields and dollar strength return. Overall trend remains bearish traders should stay alert to post Fed volatility as it could temporarily disrupt or confirm the next major move.
🔴 Sell Zone:
The main sell zone is between 4150-4200 which aligns with the upper resistance range and the top boundary of the descending channel. This area has repeatedly acted as a rejection point where sellers step in aggressively. If price retraces into this zone and forms bearish confirmation candles it becomes a strong region to look for short entries.
⚡ Sell Trigger Area:
The sell trigger area lies around 4000 which is a key psychological and structural level. A confirmed break and candle close below 4000 would likely trigger renewed bearish momentum opening the way toward 3901-3857 as next downside targets. This break would confirm continuation of the bearish wave and strengthen the short bias.
Note
Please risk management in trading is a Key so use your money accordingly. If you like the idea then please like and boost. Thank you and Good Luck!

GOLD ; How far down?Hello friends
Well, after the good rise we had, the price needed a correction, which happened with a double top pattern.
Now the main question is, how far will the fall go?
Well, in the short term, the price can fall to the specified limits, and if the support areas are broken, the fall will continue, and on the other hand, an important resistance has been created, which the price needs to break for the new ATH.
With this decline, it is unlikely that the price will suffer for a while and correct because it has grown a lot and everything will end one day...
Support levels can be good points for buying, of course with capital and risk management.
*Trade safely with us*

GOLD (XAUUSD) is ready to drop again! Gold has broken below a very strong support trendline which held the price for many weeks. It then also tried to test a powerful resistance level (the red trendline) but it failed to break through. It is now very likely to head all the way down to the next major support zone (which is the while line drawn below)

XAUUSD is on hunt [710 pips TP hit in last setup]Today's Buyers were dominant on both Tokyo & EU session hold the Range of 3935-4000.
As we were buy from 3935-3940 zone and our Tps Hit at 4005
What are my conditions For This setup?
Currently 2 buy zones we have
I expecting the market has to rise from 3975-3972 area
H1-H4 candle closing should be above 3975-3980.
Targets: 4005- 4028
✳️Secondly if H4-H1 candle closes below 3970 our buying will be compromised & and market will again retest 3930 for bottom liquidity

Gold's downward trend shows no signs of stopping sell on ralliesGold prices priced in the Fed's rate cut expectations yesterday, and quickly retreated after the data release. The bullish momentum was short-lived. After gold prices broke through $4000, almost everyone in the market believed a rebound was imminent. However, I maintain my view: yesterday's rebound was merely a corrective bounce after a sharp decline, just a sign of market recovery. The market is only rebounding, not reversing. Our short positions bought at 4020 have yielded substantial profits; you can refer to my post yesterday to verify its accuracy. The overall trend for gold remains bearish and volatile. Today, during the Asian session, we recommend selling on any rebounds.
The 1-hour moving averages for gold continue their downward crossover and bearish alignment, and the price has now fallen back below the moving averages, indicating that the bears are still slightly stronger. After the Fed data release, the price quickly retreated after reaching 4007, and the resistance at the 4000 level suggests that selling on rallies is the best strategy. The bulls failed to hold above 4000, and the bears have the upper hand.
Market conditions are constantly changing. Now that the bullish expectations have been priced in, gold has returned to a weak trend, and there is still room for further decline. The gold correction will continue.
Today's trading strategy: Short gold at 3985-3995, with a target of 3930-3920.

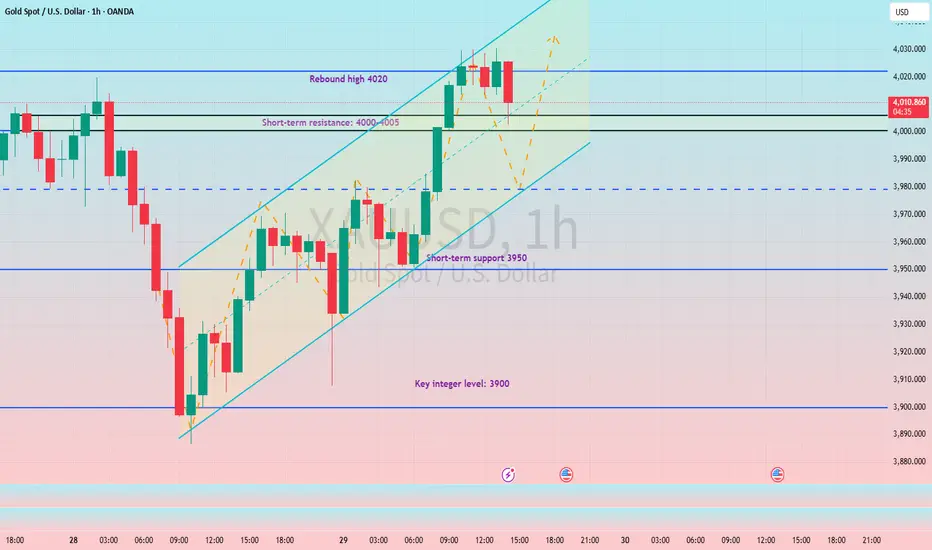
Gold surges strongly after Fed decision – eyes on 4000+ breakout1. Market Movements
After the Federal Reserve cut interest rates by 0.25% and signaled a potential end to quantitative tightening (QT), gold extended its strong upward momentum.
Institutional and ETF buying continues to drive prices higher, with gold now testing the key psychological level at $4000/oz.
2. Technical Analysis
• Near-term Support: $3960 – $3970
• Deeper Support: $3935 – $3940 (pre-Fed accumulation zone & H4 EMA50)
• Immediate Resistance: $3988 – $4000
• Extended Resistance: $4025 – $4040 (mid-October technical high)
• Momentum: Both EMA20 and EMA50 on H1 and H4 are sloping upward, confirming strong bullish momentum. RSI remains elevated (70–75), signaling overbought but still strong trend conditions.
• Volume: Continues to rise steadily, showing sustained institutional inflows. However, short-term correction risks remain near $4000 due to overextension.
3. Outlook
The overall trend remains bullish, but caution is advised as gold approaches the $4000–$4040 resistance zone — a potential area of strong profit-taking.
If gold fails to break above $4040 decisively, a short-term pullback toward $3970 or $3940 is likely.
4. Suggested Trading Plan
🔺 BUY XAU/USD
Entry: $3925 – $3928
🎯 TP: 40 / 80 / 200 pips
🛑 SL: $3922
🔻 SELL XAU/USD
Entry: $4037 – $4040
🎯 TP: 40 / 80 / 200 pips
🛑 SL: $4043

Gold: Trending downwards, 3980 is key.#XAUUSD TVC:GOLD OANDA:XAUUSD
In the short term, gold is still digesting the hawkish impact of Powell's speech, and selling pressure remains heavy.
From a technical perspective, yesterday's daily candlestick closed with a long upper shadow. The 4030 level has proven to be a strong resistance level for gold prices, while the daily MA5 moving average has continued to cross below the MA10 moving average, making 3980-3990 a key short-term resistance level. Only by breaking through this key resistance range can gold prices potentially test higher levels further. Otherwise, the market will remain in a weak and volatile state in the short term.
On the support side, pay close attention to the double bottom support level formed on the hourly chart at 3920-3915.
If this range is breached, gold prices may experience an accelerated decline, further testing 3880 or even 3850.
Therefore, in the short term, European trading can try to short gold with a small position when the price rebounds to 3980-3990. The first target can be 3960-3950, and if the price falls sharply, the next target is 3920-3915.

Gold /XAUUSD long🎯 Idea Summary:
· Direction: Long
· Instrument: XAUUSD (Spot Gold)
· Primary Timeframe: 4H
· Bias: Bullish (Counter-trend bounce)
📊 Technical Rationale:
· Market Structure: The longer-term trend is still bullish, but price has corrected into a major support zone. Looking for a bounce.
· Key Levels:
· Support: $2315** (Previous Resistance), **$2300 (Major Psychological & Swing Low)
· Resistance: $2340** (Recent Swing High), **$2355 (21 EMA)
· Price Action / Pattern: Price is approaching the $2315 support. Watching for a bullish reversal candle (like a hammer or bullish engulfing) for a confirmation signal.
· Confluence:
· The $2315 level coincides with the 61.8% Fibonacci retracement of the last major up-move.
· RSI is entering oversold territory (<30), suggesting selling pressure may be exhausting.
⚙️ Trade Setup:
· Entry Zone: $2315 - $2320 (On a bullish confirmation candle)
· Stop Loss: $2305 (Just below the key $2300 psychological level and the Fib level)
· Take Profit Targets:
· TP1: $2340 (First resistance, take 50% off)
· TP2: $2350 (21 EMA & next resistance)
· Risk-Reward Ratio: ~1:2.5
💡 Narrative / Fundamental Context:
This is a mean-reversion play within a bull market.The confluence of a major Fibonacci level, prior support, and oversold RSI creates a high-probability zone for a technical bounce. A break below $2300 would signal a much deeper correction is likely.
Disclaimer: This is my personal analysis and not financial advice. Trading commodities like gold carries a high level of risk. Always do your own research (DYOR) and manage your risk appropriately.

Gold - Sell around 3960, target 3920-3880Gold Market Analysis:
The long-awaited interest rate cut has finally happened. The Federal Reserve cut interest rates by 0.25 basis points again, in line with market expectations. The market reaction was significant; gold did not surge as expected, but instead plunged. This is typical of the market – it's always right. Today's strategy remains to sell, looking for opportunities to sell on small rebounds. The daily moving averages are starting to diverge downwards. Yesterday's rebound failed to break the daily moving averages, hovering around them before falling further. Moving average resistance has always been a last resort for buyers. The weekly top has already appeared. Our future strategy will be to sell at higher prices, targeting a bearish outlook. Today, I predict a break below 3885. If this level is broken, it will open up new downside potential.
There are two minor resistance levels in the Asian session: one around 3948, and the other a minor high around 3966. If 3966 is broken, it may re-enter a period of consolidation, and a bottom may appear on the hourly chart. For today's Asian session, we expect a weak consolidation. The current position is the first strong support level encountered after the sharp drop in gold prices. Large fluctuations at this level are normal technical corrections and not a bottoming signal.
Resistance: 3966, Strong resistance: 3989; Support: 3900, Strong support: 3885; 3966 is the key level for market strength/weakness.
Fundamental Analysis:
The Federal Reserve cut interest rates by 25 basis points as expected. The Fed lowered the benchmark interest rate by 25 basis points to 3.75%-4.00%, marking the second consecutive rate cut at its meeting, in line with market expectations...
Trading Recommendation:
Gold - Sell around 3960, target 3920-3880.

Gold peaks once the Fed's cutting cycle is over...As the cutting cycle ends and rates remain relatively low, that is when the gold price tends to peak. This suggests that we are not yet near a gold price top, as the cutting cycle has not been ended by Chairman Powell. With poor economy or jobs data, or via a dovish Trump candidate for Fed Chair next year, rates will drop further. History tells us that once the cutting is over, the gold price will stall.

Watch for support at 3990-3980 to consider going long on gold.#XAUUSD TVC:GOLD OANDA:XAUUSD
Gold prices have repeatedly tested the 4030 level without a successful breakout. Gold has now begun to decline, with short-term bears gradually releasing their momentum. Further downside is expected, with support expected in the 3990-3980 range. If gold prices can pull back to this range in the short term, we can consider going long on gold in anticipation of a rebound. Target range: 4030-4050
GOLD at breakout level? What's next ??#GOLD.. market just reached at his current breakout area that is around 3945 .
If market sustain below than we can expect further drop...
Good luck
Trade wisely
