GOLD at Breakout Level? what's next??GOLD -- perfect move as per our last couple of ideas regarding gold and now market again near to his current resistance and upside breakout area that is 4260-61
keep close that area because if market sustain above that level than we can expect further rise in gold prices.
good luck
trade wisely
Goldprediction

XAUUSD extennded Setup [already up 390 pips]XAUUSD holding the Rangebound from 4230-4270. As we mentioned in our morning Setup we took buy from 4225 and 390 pips floating in profits.
What are my conditions For Today's NY session?
Currently if we look for another buy trade we have to wait for closing of m30-H1 candle above 4270 and on retest we can took buy .
Targets: 4305 - 4328-4345.
Additional Tip:
Keep in mind H4 closed below 4230 then stay away from Buy

10.20 Gold short-term resistance looks at 4280Gold prices twice confirmed their all-time high of 4380 before falling, the first time by $100 and the second time by nearly $200.
Last Friday, gold prices were insane, plummeting from 4380 to 4279, leaving $100 of room for further gains, before rising another $100 to find 4380.
After confirming resistance at 4380 for the second time, the price continued to rise, signaling a downward trend. Pressure was placed on the short side at 4380, 4355, 4350, 4321, and 4364. The price continued to move around the established downward trend, gradually shifting between levels, and finally accelerating to 4186 before ending the decline.
The price rebounded in late trading, returning to the 4250 mark to end the week!
Judging from Monday's market action, the market has entered a broad range-bound sweep. Specifically, the bullish rally may have temporarily paused, gathering momentum for a subsequent rebound.
We must clearly understand the positioning of our defensive lines. When these lines are breached, adjustments and changes must be made:
1. Coordination between the two lines on the hourly and 30-minute charts
It has fallen back into the 30-minute chart's two-line range, between 4280 and 4110.
It remains above the upper limit of the two lines on the hourly chart, at 4221. Although it broke briefly last Friday, the closing price quickly recovered. Support is also being sought at 4221 in the European session this afternoon.
The upper limit of the two lines, 4280-4220, is where the support is being sought.
If the price breaks through this range, the nature of the market will begin to change.
2. Top and bottom reversal positions and Within the small channel, pressure is building up in the 4280-4385 area. The lower band is extending and expanding, focusing on the 4180-4200 range.
In the Asian session, prices fluctuated around the 4219-4271 range. In the afternoon, we confirmed that the 4268 area was beginning to bearishly bearish. Based on this strategy, we chose to enter a bearish position from above, targeting the 4220 area. Once the price started to move, we would aggressively chase the price, pursuing the bearish trend until it accelerated to the 4221 area.
Short-term strategies for the European and US sessions
1. Short-term trading in the 4278-4282 area, with the upper pressure at 4286, a stop-loss at 4298, and a target of 4250. The next target is 4225-4215.
2. After completing the $100 sweep, focus on the 4320 area for short selling. The specific target is a bit further out, so stay tuned for real-time alerts.
3. Currently, the price has returned to around 4260, so we will wait for the plan in the first point.

Gold prices fluctuate. Betting on extraordinary rate cuts.Precious metals continued their previous surge last week. Gold set new records for five consecutive days, reaching a high of nearly $4,380, a new all-time high.
The ongoing US government shutdown, the Federal Reserve's renewed interest rate cut cycle, high debt levels, escalating Sino-US trade frictions, and the ongoing Russia-Ukraine conflict continue to fuel demand for gold as a safe haven, de-dollarizing, and asset allocation.
Last Friday, gold also fell sharply by nearly $200 to a high of around 4380, and hit a low of around 4188. Despite the sharp market decline, the price still rose by nearly 6% last week, marking its ninth consecutive week of gains. Mainly due to the bad loan problems of two US banks, global demand for safe-haven assets has surged.
From the daily chart, gold is still maintaining a slight upward trend. Last Friday's pullback coincided with the MA5 support level. This is most likely the maximum extent of gold's pullback. A complete shift from a bullish to a bearish trend is currently difficult. At the very least, it must first fall below the MA5 moving average before there will be further room for retracement. As it remains above the moving average and there is no particularly negative information for gold, the trend may continue to remain at a high level.
From the 1-hour chart, the Bollinger Bands are gradually narrowing, and prices are likely to remain range-bound. Current support lies near the lower Bollinger Band at 4215, while upward pressure is expected in the 4270-4280 range.
Although prices fell below the lower Bollinger Band last Friday, they subsequently rebounded. This trend continued in the Asian session on Monday, reaching near the middle Bollinger Band. Prices are still holding above the lower Bollinger Band and trading at a high level.
Overall, the trend remains relatively strong until the price breaks below 4215. With prices trading above this level, buying on dips in the short term is still a viable option.
More real-time trading strategies are being released in the channel, so stay tuned.

XAUUSD: Has gold made a peak?OANDA:XAUUSD had a strong correction day at the end of last week with strong selling pressure, the rhythm of recovery does not make too much sense when the price is still sideways in the range of 4220 – 4270.
In previous corrections, we have seen that the price has always recovered strongly immediately, however in the current situation, the price has not made any attempt to rise again => Reinforce the fact that the price has made a peak and started a short-term correction.
In the Options market, there has been a large number of Longput contracts and Longcall contracts are gradually being withdrawn from the market , so I think the price will not be able to rise in today's trading session.
Some key levels are important in today's trading session:
Resistance: ,
Strong support:
Daily balance:
Daily balance is the temporary equilibrium level of the market in today's trading session, if the price breaks this balance, the price will look for lower value areas.
Always be patient and wait for the price to reach the support and resistance zones above and get confirmation. Do not place limit orders or enter orders when the price is increasing or decreasing sharply.
Take advantage of the above support and resistance zones and trade short-term when the price reacts at these support and resistance zones and take profit when price moves 10 to 20 prices from support and resistance zones.
Wait for reactions such as Engulfing candles, Doji,... at the support and resistance zones.
Always set stop losses when trading and manage risks closely.
Victor Dan @ ZuperView

Can Gold Still Reach 4400? Focus on the 4280 WatershedGold opened slightly higher at 4251 this morning, but immediately crashed and fell back below 4239. However, this didn't trigger a further sell-off, instead it stalled and saw a strong rally. Gold therefore broke through 4273 before retreating. The pullback was also quite strong, directly reversing gains and heading towards 4220. This aligns with the signal mentioned in yesterday's article, suggesting a short position below 4280.
Gold's 30-minute moving average has begun to turn downward. If it forms a downward death cross, the 30-minute moving average could see further downward movement. Even with the risk-averse approach, gold failed to break through the resistance at 4280 this morning, indicating that 4280 remains the current dividing line between bulls and bears.
Resistance levels: 4260, 4280
Support levels: 4200, 4180
Trading strategy:
1. If gold retreats to the 4200-4180 area, consider going long on gold and setting up a protective position.
2. If gold rebounds to the 4265-4275 resistance area, consider shorting gold.
3. If gold breaks through and holds above 4280, consider going long on gold after a pullback.
If you're feeling lost and unsure about the market, follow my updates and channel. I'll provide daily updates, including details on long- and short-term trade execution. If you're interested, please share your current positions and we can analyze whether it's safer to hold on or adjust and change your positions.

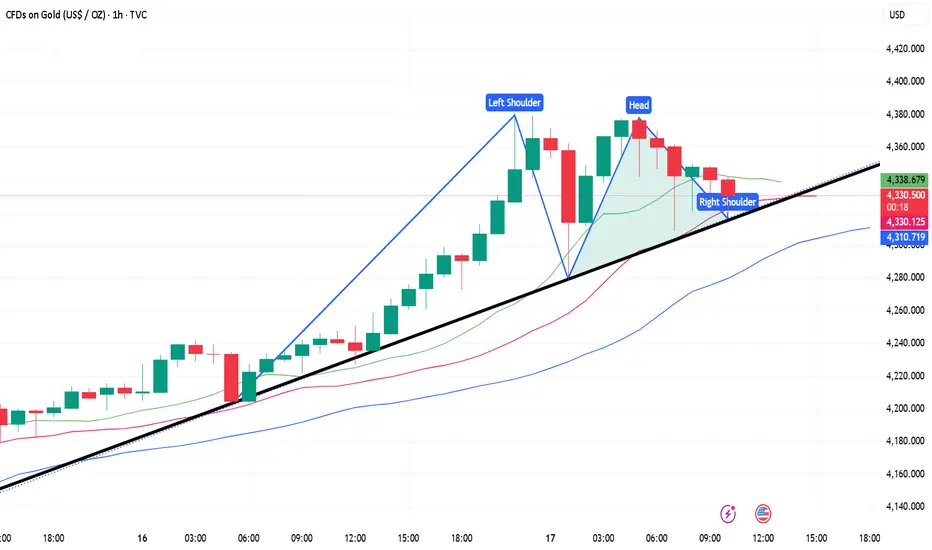
XAUUSD📊 XAUUSD (GOLD) – 1H Timeframe Analysis
Structure Update:
A clear Double Top has formed near the recent highs, signaling potential exhaustion after 9 weeks of continuous bullish momentum.
Price is now consolidating within a Bearish Flag, suggesting a pause before possible continuation to the downside.
📉 Outlook:
Correction looks imminent as buying momentum weakens and sellers begin to show presence near resistance.
Watch for a bearish candle confirmation and breakdown below the flag’s lower boundary to validate a short setup.
🎯 Trading Plan:
Bias: Bearish (short-term correction)
Trigger: Breakdown and close below flag support
Risk–Reward: Follow proper RR discipline
Invalidation: Break and close above flag resistance or double-top high

mrmoney limited XAU/USD swing trading ideaprice has reacted off our 4hour support which gave us a nice bullish momentum to the upside

Gold Steady Above $4,000 — Dips Remain Buying Opportunities1) Macro & Fundamental Drivers
Narrative: Gold remains in a structural bull phase, supported by policy-easing expectations, soft USD/real yields, and persistent safe-haven demand. After the vertical run to—and through—the $4k handle, price is consolidating at elevated levels.
Rates/Yields: Markets still price near-term Fed cuts; real yields have eased from recent highs—historically bullish for gold.
USD: The dollar is mixed but broadly softer on easing expectations and global growth worries—tailwind for XAU.
Growth/Inflation mix: Growth data is uneven, inflation trend is moderating on a 3–6m basis; that reduces the opportunity cost of holding gold.
Risk Premium: Ongoing geopolitical/fiscal headlines (US fiscal noise, US–China tension) keep safe-haven bids alive.
Official & Institutional Demand: Central-bank net buying remains a structural pillar; ETF/retail participation is improving on breakouts.
Supply: Mine output growth is slow; AISC (all-in sustaining costs) are elevated—supportive to longer-term floor.
Bottom line: Macro backdrop remains gold-positive, with the caveat that the pace of the recent rally leaves price vulnerable to tactical pullbacks.
2) Flows & Positioning (what matters for timing)
CTA/Trend followers: Likely max long or near it after the $4k breakout. This magnifies both momentum upswings and the risk of air-pocket pullbacks if key levels break.
Options: Skew is biased to calls (crash-up hedging) but rich—implieds elevated. Fade extreme IV spikes; use options for defined-risk breakout exposure.
ETFs/CBs: Dip buying remains a theme; structural demand reduces the depth/duration of corrections.
3) Technicals (multi-timeframe)
Weekly
Trend: Strong uptrend, higher highs/higher lows; price well above rising 20/50-WMA equivalents.
Momentum: Weekly RSI high but not reversing—trend intact.
Daily
Structure: Post-breakout sideways-to-up range developing above the $4k handle (healthy digestion).
Key Levels:
Support: $4,100 (nearby pivot) → $4,050 (strong base) → $4,000 (psych + breakout retest).
Resistance: $4,180–4,200 (cap) → $4,300 (extension) → $4,400+ (measured move if momentum resumes).
Indicators: RSI cooling from overbought; ADX still firm; 10/20-DMA above 50-DMA—bullish stack.
Volatility: Daily ATR expanded—position size down, wider stops.
Intraday (H1–H4)
Bull channel intact while price makes higher lows above $4,100–4,120.
Intra supports: 4,120 / 4,090–4,100; Intra resistances: 4,175–4,200, then 4,240–4,260.
4) Scenario Map (next 1–2 weeks)
Scenario Catalyst / Sign Market Reaction Gold Plan
Bull Base Case Easing-friendly data; calm USD; steady risk-off tone Grind higher into 4,200 → 4,300 Buy dips 4,090–4,120; trail below 4,050
Bull Acceleration Dovish Fed signaling / softer inflation, risk flare-ups Break & close > 4,200, momentum to 4,300–4,400 Breakout long on daily/15-min close >4,200; add through 4,240
Sideways/Mean Revert Mixed data; USD stabilizes; profit-taking Chop 4,050–4,200 range Range trade: buy 4,070–4,100, fade 4,190–4,210 with tight stops
Bear Risk (tactical) Hawkish surprise / strong USD / hot inflation Flush to 4,000–4,020; if breaks, 3,950 Stand aside into the flush; reload longs on reclaim of 4,050/4,100 or buy 3,950 with reversal signal
5) Trade Plans (levels are live-action guides)
A) Swing – Buy the Dip (core idea)
Entry: 4,090–4,120 (staggered)
Invalidation: Daily close < 4,050
Targets: 4,180 / 4,220; runners 4,300
Notes: Use half size first; add only on strength back above the 4,150 pivot.
B) Breakout – Continuation
Trigger: 15–60min close > 4,200 with expanding volume / breadth
Stop: 4,160–4,170 (below breakout)
Targets: 4,260 / 4,300 / 4,360
Tactics: Trail stop under rising 20-EMA (H1).
C) Tactical Short – Reversion
Setup: Rejection wicks at 4,190–4,210 or parabolic spike >4,240 without breadth
Stop: Above the rejection high (tight)
Targets: 4,150 / 4,120; stretch 4,080
Note: Counter-trend. Keep size small and take profits fast.
Risk & Sizing
Keep risk 1–2% per idea.
ATR-adjust stops; don’t widen stops—cut size instead.
Avoid stacking correlated risk; use time-stops if catalysts disappoint.
6) What Would Change My View?
Bearish shift: A sustained daily close below $4,000, or a sharp rebound in real yields + USD with hawkish Fed tone.
Bullish extension: A clean weekly close > $4,200 with improving breadth; that unlocks 4,300–4,400 roadmap.

GOLD AND WAR NEXT TO 4K$Hello traders
as i can see gold is trading in a Decending Triangle zone and it had tested Fibo 0.61 ratio in month of may dip as we can see gold close monthly candle above 3280 zone which is a clear sign that big players and banks are still prefer Safe haven we can see US econmey in a bad recession zone unemployment and higher inflation is a big problrm for $ and on all these things Mr. Trump Tariffs is a game changer in commodities markets if we see Geopolitical issues around the world it esculating more war in diffrent regions of the world.. Now Israiel & US have a new biggest problem Iran which is showing us a attack on Iran can be happen incoming days as we can see 6 meetings was unsucessful in Oman for a Deal to Stop Iran's Nucler Enrichment Program which is not good... other then fundamental Charts are crystal clear and showing us a clear view for a New ATH on Gold our Risk reward ratio is prefect for us have a proper research before taking any trade its just an trade idea share your thoughts with us it will help many other traders Comments are open we love your comments and support the channel so it can diliver to many other new traders Stay Tuned for new updates ..
Is the sharp drop in gold a sign of a bearish trend?Gold rallied to 4379 after opening on Friday, then rebounded above 4370 after experiencing two crashes. The market generally expected gold to break through the 4400 mark. Although one of the two crashes resulted in a drop of over 100 points, this did not spur a further return of bears. Instead, the strength of the rebound gave the market bullish confidence. The subsequent crash immediately wiped out all the buying. As I mentioned in my previous two articles, everyone expected the price to rise again after falling.
The crash after the surge was actually expected. Whether it was the US government shutdown, rising expectations for an October rate cut, or the trade war and Russia-Ukraine spurring risk aversion, bullish momentum was constantly building. It was primarily driven by capital seeking to push up gold prices. Otherwise, the news had some impact, but not this significant. It's true that the Russia-Ukraine conflict hasn't escalated out of control. While a Fed rate cut is highly likely, the market had already priced in the news. Unless it's a significant rate cut, the impact will be limited. As for the US government shutdown, while it has an impact on the US economy, it's more of a civil war between the two parties, so the impact is also limited. As for tariffs, after all, they haven't been implemented, and there's no question of how much risk aversion they'll generate. Negotiations will happen anyway. Even combined, these various pieces of information wouldn't have spurred gold prices that much. After all, this month's rise from 3819 to 4379 is 560 points, and this week's rise from 4002 to 4379 is nearly 380 points. This is purely a malicious push.
So is this bull market in gold over? This recent correction has been particularly strong, prompting many to question whether gold has peaked. However, it's premature to call it a peak, and we shouldn't blindly dismiss the current strong trend. After all, the news hasn't yet signaled a significant decline, and the aforementioned events haven't been effectively addressed. Looking at the one-hour and four-hour charts, support remains near 4180 and 4160. Only a break below these levels will trigger further downside, two areas we need to watch in the short term. Upward pressure is currently at 4280-4300. If it breaks through these levels again, it's likely to revisit the previous highs. A break below these levels could lead to a push towards 4500.
Next Week's Trading Strategy:
Gold's focus is now on the 4280 area, which is currently the dividing line between bulls and bears. If gold fails to break through 4280 in a rebound next week, continue shorting gold on rallies. If gold ultimately breaks through and stabilizes at 4280 amidst the weekend's risk-averse rally, then bulls will return. Currently, gold is still trading below 4280, so continue shorting on rallies at the beginning of next week while under pressure at 4280.
If you're feeling lost and unsure about where to go in this market, follow my updates and my channel. I'll provide daily updates for your reference, including details on the execution of long- and short-term trades. If you'd like, please share your current positions so we can analyze whether it's safer to hold on or adjust and change positions in a timely manner.
Next week's trading plan is about to begin. If you have any trading questions (wanting to recover losses or increase profits), please feel free to contact me.
Thank you to everyone.
Gold Nears $4500: Is $5000 the Next Magnet?Asset : XAUUSD
Current Price: ~$4254
Timeframe : Daily / Weekly
Analysis Type : Macro + Technical Momentum
🌍 Macro Drivers: Why Gold Is Defying Gravity
• Geopolitical risk premium: Middle East tensions, U.S.–China trade recalibration
• Central bank buying: China, India, and Russia accumulating at record pace
• Real yields: Still negative across major economies
• Dollar weakness: DXY softening amid fiscal uncertainty
• ETF inflows: Rebounding sharply after months of outflows
📈 Technical Structure: Parabolic Rally in Motion
• Breakout zone: $3945 (minor swing low)
• Current price: ~$4254
• Recent high: $4380.99
• Volume: Highest since 2020 pandemic rally
• RSI: Above 75—momentum strong, but nearing overbought
• MACD: Weekly bullish crossover confirmed
🧠 Sentiment Snapshot
• Retail traders chasing momentum
• Options market shows heavy call buying above $4600
• Institutional desks rotating into gold as equities stall
🛡️ Risk Management
• Trailing stop: Use 2x ATR on daily chart
• Invalidation zone: Weekly close below $4100
• Hedge strategy: Consider partial profit booking near $4625
📝 Final Thoughts
Gold isn’t just rallying—it’s repricing. With macro tailwinds, central bank flows, and technical momentum all aligned, the $5000 magnet is now in play.
📌 Follow for updates as we track this historic move.

Gold is Ready for a Selling Retracement Hello Traders
In This Chart GOLD HOURLY Forex Forecast By FOREX PLANET
today Gold analysis 👆
🟢This Chart includes_ (GOLD market update)
🟢What is The Next Opportunity on GOLD Market
🟢how to Enter to the Valid Entry With Assurance Profit
This CHART is For Trader's that Want to Improve Their Technical Analysis Skills and Their Trading By Understanding How To Analyze The Market Using Multiple Timeframes and Understanding The Bigger Picture on the Charts

XAUUSD Weekly expectations Long/Shirt ?! 🧩 Market Overview
Gold is currently trading around $4,253 , after a strong drop of about -1.6% .
Price is moving inside a rising (uptrend) channel, but the recent red candle shows selling pressure.
⚙️ Key Zones
Resistance: $4,378 → Recent high where price was rejected
Support: $4,036 → Previous low / major demand zone
Buffer Zone: $4,200 → Important area to watch for bounce or breakdown
SSL (Sell-Side Liquidity): Below $4,200 → Possible stop-hunt area
📊 Possible Scenarios
🟢 Bullish :
If price bounces from the $4,200 buffer zone, it may continue higher towards $4,300–$4,378.
🔴 Bearish :
If price breaks and closes below $4,200 , it may fall toward $4,100–$4,036 .
My View
Gold is now near a decision zone.
I’ll wait to see if buyers defend $4,200 or if sellers break it down.
No rush — patience brings better entries.
💬 Disclaimer
This is not financial advice. It’s an educational analysis based on technical structure and liquidity levels.

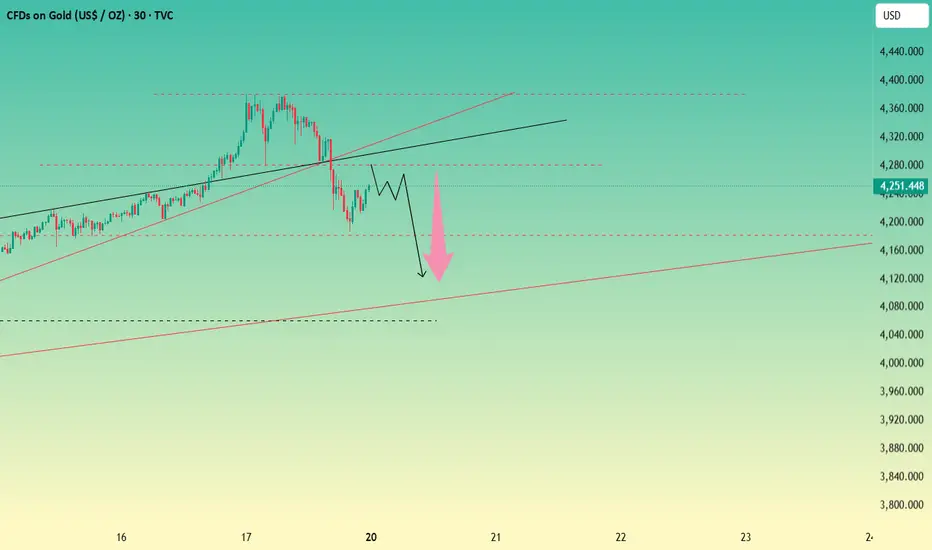
xauusdGold seems to be entering a short-term downtrend after an interesting rally.
If we see signs of selling at 4280-4330, I could sell on the 1-hour timeframe with a stop loss at the previous high.
Targets are 4200-4160-4110-4060-3960

BUY GOLD - XAUUSD- Amazing low risk high reward trade!Based on our deep analysis we can see that GOLD - XAUUSD will head to the upside. Great time to buy - it has broken major resistance levels + trends.

GOLDGOLD next reaction is 4300 and if consolidates then further upside to take 4400 otherwise a break down from 4300 to 4200 and below.
Disclosure: We are part of Trade Nation's Influencer program and receive a monthly fee for using their TradingView charts in our analysis.

10.19 Gold Monday short-term analysis guide!Gold closed near 4247 on Friday. Following five consecutive daily gains, the market closed with a bearish candlestick pattern. Technical analysis suggests that gold prices are poised for a period of volatile correction. Without news stimulus, gold is expected to fluctuate within a range. Given the pullback from Friday's large bearish candlestick, Monday's focus should be on whether the decline can be sustained. If this trend isn't sustained, bulls are poised to launch a counterattack. Otherwise, gold is poised to enter a range of rebound resistance.
From the 4-hour market trend, short-term resistance is currently at 4280-4293, with a focus on 4315-23. Support is at 4185-4193. If bulls fail to achieve a sustained breakout, a period of volatile correction is imminent. Trading strategies should prioritize range-bound trading. In the middle, adopt a cautious approach, cautiously follow orders, and patiently wait for key entry points.

#XAUUSD:$4200 Almost Hit, Our New Target Is $4500! Dear Traders,
Gold has been extremely bullish since our previous analysis. The US has imposed a 100% tariff on China which has caused fear within the global trading community. Our next move is to wait for the price to retest whether minor or major. Once we have confirmation, we can target our next move.
Team Setupsfx

Gold's Record-Breaking Rally: Why $4,000 is Just the StartThe global financial landscape is sending a clear signal that the old rules are broken. On October 17, gold prices shattered all-time records, surging to nearly $4,400 per ounce, just days after breaking the $4,000 barrier for the first time in history.
This isn't a temporary spike; it's a fundamental re-pricing of wealth. Investors are fleeing traditional "safe havens" in search of real security, and they've found it in the one asset that has preserved wealth for 5,000 years.
For those watching from the sidelines, this raises two urgent questions: Why is this happening now, and is it too late to act?
As a 14-year veteran in the gold market, I can tell you this rally is far from over. Here’s a breakdown of what’s driving the surge and why gold remains the most critical investment for the future.
A Perfect Storm: The 10 Drivers Behind Gold's Historic Rise
The current price surge isn't due to one single factor but a powerful convergence of economic, political, and psychological forces.
1. Geopolitical Chaos: From the ongoing war in Ukraine to conflict in the Middle East and the persistent US-China trade tensions, the world is in a state of turmoil. During times of crisis, gold is the ultimate "crisis hedge." Major investment banks note that significant geopolitical events consistently drive gold 10-15% higher as investors seek stability.
2. US Political & Economic Uncertainty: Unpredictable policies, pressure on the Federal Reserve, and mounting political division in the U.S. have eroded global trust in American leadership and its assets. Investors no longer view US bonds with the same confidence, and that capital is flowing directly into gold.
3. Massive Central Bank Buying: This is one of the biggest stories. Central banks around the world—led by China, Russia, India, and Turkey—bought a record 3,200 tonnes of gold between 2022 and 2024. These are not speculators; they are "price-insensitive buyers" seeking long-term security, and they are permanently removing massive amounts of supply from the market.
4. The Rise of De-Dollarization: When Western nations sanctioned Russia and froze $300 billion of its dollar reserves, it sent a shockwave through the global south. Nations realized that holding dollars is a political risk. This has triggered a massive, long-term trend of "de-dollarization," where countries are actively dumping US dollars and replacing them with neutral, sanction-proof gold.
5. A Fundamental Shift in Reserves: For the first time since 1996, central banks' gold reserves have surpassed their holdings of US Treasury bonds. This isn't just diversification; it's a strategic replacement. Gold is being re-throned as the world's primary reserve asset, replacing the US dollar.
6. Expected Interest Rate Cuts: The U.S. Federal Reserve is signaling an end to its rate-hiking cycle, with cuts expected. When interest rates fall, the return (yield) on bonds and savings accounts drops, making non-yielding gold more attractive. Investors are front-running this move.
7. The Crushing Weight of Global Debt: The United States government is now over $37 trillion in debt. This mountain of debt is unpayable. The only way for governments to manage it is to devalue their currencies by printing more money, which causes inflation. Gold is the direct antidote to this currency debasement.
8. The Ultimate Inflation Hedge: While inflation has cooled slightly, the damage is done, and the threat remains. Decades of money printing have destroyed the purchasing power of fiat currencies. Gold is the ultimate "inflation hedge" because its value is intrinsic and cannot be inflated away by a central bank.
9. Surging ETF and Investment Demand: Exchange-Traded Funds (ETFs) have made it simple for average investors to buy gold. This has opened the floodgates to a new class of investor, adding to the demand from central banks and traditional buyers.
10. Market Psychology (FOMO): Success breeds success. As prices hit new records daily, investors who were on the fence are now experiencing a powerful "Fear of Missing Out" (FOMO). This psychological driver creates a feedback loop, pulling more and more money into the market and pushing prices even higher.
Beyond the Headlines: The Hidden Drivers
On top of those 10 reasons, other powerful factors are adding fuel to the fire:
• Physical Supply Constraints: "Peak Gold" is a real concept. The easiest-to-find gold in the world has already been mined. New discoveries are rare, and it is becoming increasingly difficult and expensive to extract new supply from the ground.
• Rising Energy Costs: Gold mining is an incredibly energy-intensive process. As the cost of oil and energy rises, the "all-in-sustaining cost" (the floor price to produce an ounce of gold) also rises, pulling the market price up with it.
• Loss of Faith in Alternatives: After years of extreme volatility, regulatory crackdowns, and high-profile frauds, the cryptocurrency market has failed to prove itself as a reliable "digital gold." Many investors who sought an alternative to the fiat system are now returning to the original, 5,000-year-old decentralized asset.
The Future Forecast: Why $5,000 Gold is the Next Target
The world's top financial institutions believe this rally is just getting started. The core drivers—de-dollarization, central bank buying, and unmanageable debt—are not short-term trends; they are multi-decade structural shifts.
• Goldman Sachs predicts gold will reach $5,000 per ounce by December 2026.
• Bank of America has also released a forecast, stating that a $5,000 target is possible within the same timeframe.
• UBS sees prices remaining elevated above $4,200 throughout 2026.
These forecasts are based on the simple fact that the fundamental problems driving investors to gold are only getting worse.
In an Uncertain Future, Gold is Your Financial Anchor
In the coming years, "safety" will be redefined. A safe asset is not one that is merely stable; it's one that cannot fail.
Gold is the ultimate safe-haven investment for one simple reason: it has zero counterparty risk.
• When you buy a stock, you are trusting a CEO and a management team. The company can go bankrupt.
• When you buy a bond, you are trusting a government or corporation to pay you back, in a currency that is worth less every day.
• When you hold cash, you are trusting a central bank not to devalue it to zero (a promise they have broken time and time again).
When you hold physical gold, you are trusting no one. It is an asset that is not simultaneously someone else's liability. It cannot go bankrupt, and it cannot be printed into oblivion. It has preserved wealth through every war, plague, and financial collapse in human history.
Why Gold is the Only True Asset
We have come to confuse currency with money and digital entries with wealth. Gold is the only true asset.
Fiat currency (USD, EUR, etc.) is a medium of exchange, but it is a liability of the central bank that issues it. It is backed only by faith in a political system—a faith that is clearly eroding.
Real estate is a tangible asset, but it is illiquid, expensive to maintain, and can be taxed or seized by the government.
Gold is different. It is elemental wealth. It is the only asset that is durable, divisible, portable, has intrinsic value, and is recognized as money everywhere on Earth by every culture.
The current price surge is not a "bubble." It is a "Great Re-Pricing"—the market's slow, dawning realization that paper currencies are failing and that gold is the only reliable measure of value. The question is no longer if you should own gold, but how much of your savings you can afford not to protect with it.
Gold Technical Analysis: When Technical Analysis Deviates from Its Conventional Path
The current state of the gold market presents a significant challenge for technical analysts. A look at the charts reveals a clear anomaly. From a technical standpoint, particularly using momentum indicators like the RSI (Relative Strength Index), gold has entered the "overbought" territory on nearly every timeframe, from the 5-minute to the daily chart.
Under normal circumstances, this "overbought" status would signal that a major price correction is imminent. However, the gold market has recently deviated significantly from its long-established behaviors and phenomena.
Why Traditional Technical Analysis is Failing
Despite the market being severely overbought, we are not witnessing any meaningful correction. Traditional "Price Action" signals, such as bearish engulfing candles or divergences, are failing to gain traction against this powerful upward momentum.
The only discernible pullbacks are occurring at the end of the week or month, which can be attributed to short-term traders "profit-taking." These brief sell-offs are now what pass for "corrections." Beyond this, significant price revisions are almost non-existent.
The primary reason for this is that the market is far more influenced by fundamental factors than by technical indicators at this moment.
The One Reliable Tool: The Moving Average
Despite this erratic behavior, one technical tool has remained surprisingly effective: the Moving Average (MA).
It is evident that as gold's price climbs, it is closely respecting various MA periods. On short-term timeframes (like the 5-minute, 15-minute, or 1-hour), different MA lines are acting as robust "dynamic support." Whenever the price dips to touch an MA line, new buyers become active, pushing the price back up.
For the past several months, most popular technical indicators and chart patterns—aside from moving averages—have become largely ineffective in this one-sided market.
What Should the Trading Strategy Be?
Analyzing the current market conditions, a logical trading strategy is to follow the adage, "The trend is your friend."
Since other indicators are failing and the market is in a powerful uptrend, the most prudent approach is to remain in "buy mode," using the moving averages as a guide. Every dip to an MA support level can be viewed as a new buying opportunity. This strategy remains valid until the primary uptrend is decisively broken.
When Could a Major Correction Signal Appear?
However, buying blindly into this rally is also risky. We must be prepared for signs of a major correction. The first sign of weakness in this powerful uptrend—and a signal for a significant price drop—would likely come when gold closes firmly below its long-term 200-period Moving Average (200 MA) or its primary up-trend line on a higher timeframe, such as the 1-hour (H1) or H4 (H4) chart.
Until that happens, any minor declines should be treated merely as "profit-taking" or temporary pullbacks, not as a trend reversal.
Conclusion: Fundamentals Are the Core Driver
We must remember that regardless of what the technical charts say, this historic rise in gold is backed by extremely powerful "fundamental" reasons. Geopolitical instability, the weakening of the dollar, record-breaking purchases by central banks, and the unpredictable policies of the US (Trump) administration have all solidified gold's status as the ultimate "safe haven."
If there is a major change in any of these underlying fundamentals (such as the announcement of a major ceasefire or sudden economic stabilization), gold's fall could be just as rapid and severe as its rise.
Therefore, trading based on technical charts alone is insufficient in this market. To make the right move at the right time, we must stay constantly abreast of global news and economic data. The next major move is unlikely to be signaled by a chart pattern; it will most likely be triggered by a "news headline."

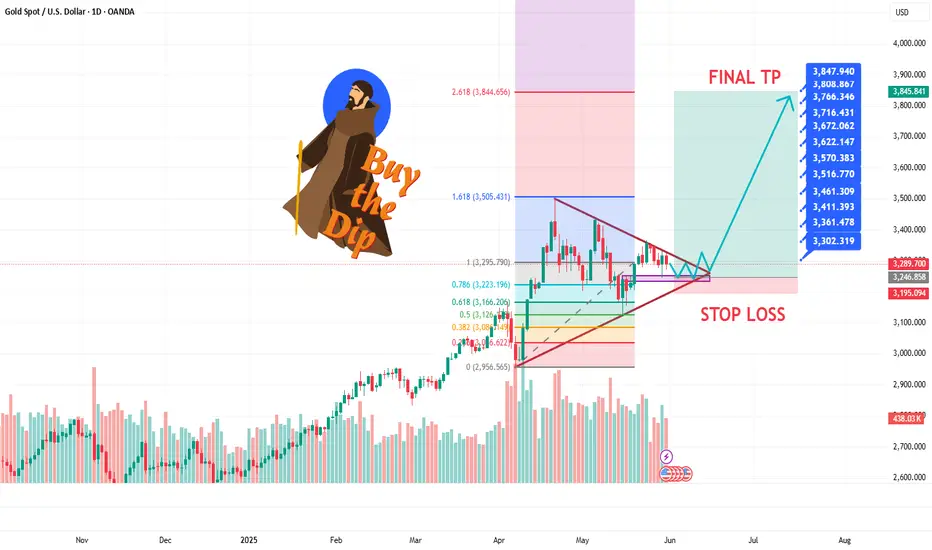
Gold 1day trade idea buy at Fib 0.32 target ATHThis is just a trade idea seperate from my weekly tradeing chart.
We are looking for a retracement to a good support level which is Fibonacci 0.382 and retrace back to the all time high for a 930 pips move.
With these sort of trades be prepared to increase your stop loss so i would advise to use your own risk management.
method trend lines and fibonacci levels.
Ill update this tomorrow AM

Gold (XAU/USD) – Bullish Rebound Expected from Key Support ZoneTechnical Structure
Uptrend Confirmation: Despite the pullback, the overall structure remains bullish — higher highs and higher lows are intact.
Support Zone (Green Box): The area between 4,132 – 4,197 acts as a strong demand region where a reversal is likely.
Target Point: The upside target lies near $4,378 – $4,381, coinciding with previous highs and resistance.
📈 Bullish Scenario
If price tests the support level and shows rejection (bullish candles or wicks), we can expect:
Entry: Around $4,160 – $4,200
Target: $4,380 – $4,381
Stop Loss: Below $4,120
This would confirm a continuation of the uptrend after a healthy correction.
📉 Bearish Scenario
If price breaks below $4,120, it could trigger:
Deeper correction toward $4,060 – $4,000
Momentum shift from bullish to short-term bearish.
🟢 Signal Summary
Direction Entry Zone Stop Loss Take Profit Confidence
BUY (Long) $4,160 – $4,200 $4,120 $4,380 ⭐⭐⭐⭐ (Strong if support holds)
⚠️ Conclusion
Gold is showing signs of retracement within an uptrend.
If the support zone holds, we can expect a bullish reversal toward the $4,380 target point.
However, a break below $4,120 will signal a deeper correction before any new rally.

10.17 Gold Short-Term Operation Technical Guide!!!Recently, as the expectation of the Federal Reserve's interest rate cut has become more and more intense, and there is an expectation of an increase, the loose atmosphere, coupled with the expectation of inflation and the impact of the economic and trade turmoil, gold has once again become the darling of the market. Every day, it witnesses new highs in history, and the trend has become more and more crazy. There is no top in sight, and it is also impossible to say when a dive will come. Today, the Asian session hit a high near 4378 and then fell back quickly to touch around 4278, a range of US$100, and then quickly rebounded to above 4370 again. Subsequently, the European session jumped back and forth. Today, Friday, we need to be wary of the possible profit-taking trend in the market. In terms of operation, the rebound depends on shorting at 4360/70, and pay attention to the gains and losses of 4300. If it falls below 4300, we will see adjustments. Otherwise, we will continue to see bullish fluctuations if it falls back.