AUD/USD Longer term OutlookHey Guys,
This is a follow up the the Short Term outlook I posted to show you the bigger picture of what happening. If you haven't checked out that short term thesis I suggest you do to understand why i think in the near term why there will be a decline possibly down to .50.
As I'm sure most people are aware there is abit of fear on the longer term of the debasement of the USD, as we have massive debts and deficits which are highly unlikely to get any better soon. This is ultimately lead to its decline relative to other assets think current rise in GOLD. If we have a recession from slower growth from tariffs, regional banks and private credit going bad and the consumer becoming too squeezed then this budget with get much worse as they will try and stimulate the economy to ease some of these pressure. But as a consequence this will lead to inflation and more debasement just like the 60s - 80s period. Each time they try and rein in inflation growth will slow so they will simulate resulting in the cycle continuing.
Now if the "debasement" continues this doesn't mean the USD will die get replace but it does mean other assets and currencies that aren't having this systemic problem will rise relative to the dollar again just like the 1960s-1980s. Australia has had long running fiscal conservative budgets and most definitely no debasing its currency. Our debt to Nominal GDP peak during covid and unlike most other economies has decreased since. Although we are projected to runn a deficit of A$10 billion our growth will more then out weigh this and this is such a small fraction to out A$1.752 trillion economy is a non factor really.
looking at some technicals on the charts we can see we have been in a falling wedge since the last "debasement" of the USD happened after the GFC. This will breakout sometime over the next two years as its running out of room. we have gaining strength on the RSI creating a divergence on the monthly also point to a breakout to the upside. we have clear outlined targets to hit on the way up and looking back again at previous debasement events by 2011 we were at $1.10 and by the 1975 we were at $1.49 so a return to these levels isn't without precedence.
I have shown with the green line the general direction of where i think it will be please dont take that as an exact model. This will take years to fully play out but if you understand even the most basic supply and demand , technical analyst and fundamental problem America is facing then it should keep you true.
Please check out the shorter outlook to gain a full picture and do you own research
here are some links to data used
www.ceicdata.com
data.worldbank.org
Goldprediction

XAUUSD Delivered Excellent profits [1320 PIPs]
Thanks to those who followed, trusted me, and made profits.
As I mentioned in today’s commentary session:
• I took buy trades around 4222 - ( 4234×2)& 4245
My strategy was to buy the dips, and I’m very happy with the profits so far – .
My first target 42o0. is achieved, Alhamdulillah. And I'm looking for 4500 now
**Additional Tip:**
Selling against the current bullish bias isn’t advisable and buy the dips only ,wait and watch for new setup

Gold end points!?After a long journey i think we now need a rest Gold appears to be at a potential turning point where short positions may be closing and prices could move higher

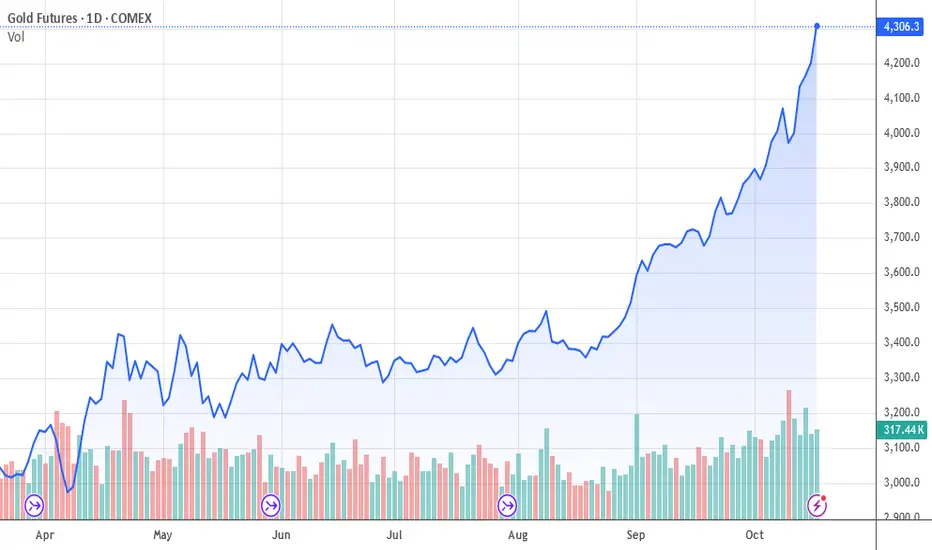
Gold Broke The ceiling of the Bullish Flag to claim $4K Pivot The price of gold has consecutively surge in price for the past 2 months to break the ceiling of the bullish flag pattern formed based on the 4-hour chart.
The asset has gained 35% so far earning almost $1200 prior the surge. With investors sentiment shifting to the asset Gold might claim the 4k resistant this last quarter.
With the RSI at 83, the asset is currently overbought with possible retracement to the $4200 Zone before the next legged up.

GOLDI think this chart is bullish to 6400$ and complete TVC:GOLD 2-leg target.
Best support for pullback 1900$ to 900$ that i think not touch this supports but this rally is very strange.
Please control your money management.

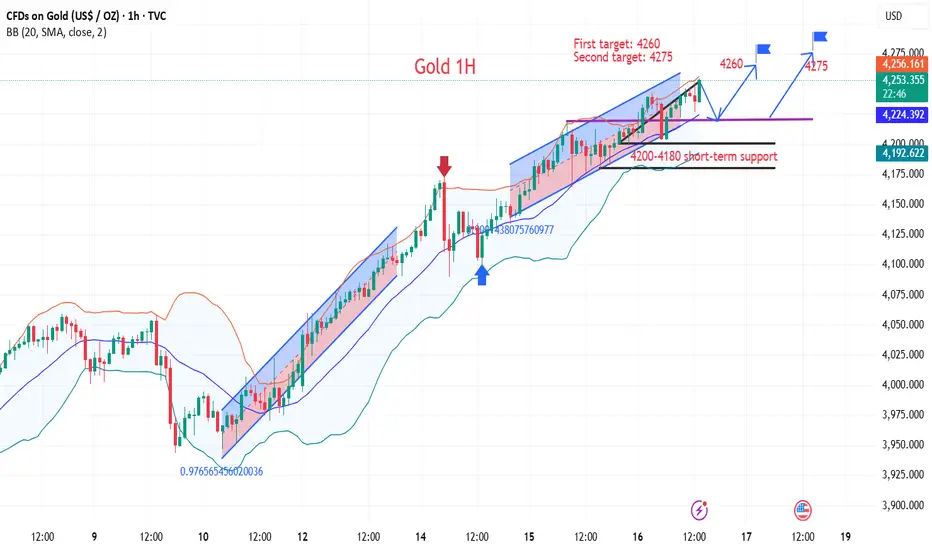
4300 is just the beginning, it is expected to reach 4500Affected by the continued impact of the US government shutdown, gold in the US market rose strongly. After hitting a high of 4292, it quickly fell back and rebounded, setting a new historical high of 4298. But judging from the current trend, this is obviously not the peak of gold prices. If the short-term rise continues, it is expected to test the pressure of the 4,300 integer mark.
As the short-term trend line is broken, the previous resistance is gradually transformed into support. Pay attention to the short-term support range of 4275-4260 below. If this range can be held, gold will set a new high.
OANDA:XAUUSD

Gold (XAU/USD) Breakout Rally Toward New Highs!Analysis:
Gold (XAU/USD) continues its strong bullish momentum on the 4-hour chart, forming a series of higher highs and higher lows, confirming a sustained uptrend. The recent breakout above the resistance zone near $4,150–$4,170 indicates renewed buying interest and momentum buildup.
After a brief retest of the breakout area, price has started climbing again — a sign of trend continuation supported by bullish candle formations and strong market sentiment.
Technical Outlook:
Support Zone: $4,140 – $4,170 (previous resistance turned support)
Bullish Confirmation: Continuation pattern with clean structure and volume support
Momentum Bias: Strongly bullish while above $4,150
🎯 Target: $4,300 – $4,320 zone
🛑 Stop Loss: Below $4,140 to limit downside risk
📈 Summary:
As long as gold stays above the breakout level of $4,170, the market remains bullish, with upside potential toward $4,300–$4,320, aligning with the next major resistance area.

Is There an End to Gold’s Price Surge?The price of gold has already reached $4,300 per ounce. As we have repeatedly mentioned in our analyses, once gold starts moving upward, there’s no stopping it — and this prediction is now being confirmed.
Since mid-August 2025, gold has gained nearly $1,000 per ounce in just two months. Few could have imagined such a move, yet it was entirely foreseeable given today’s global conditions.
The world remains deeply unstable — with the shift toward digital currencies, ongoing wars, and soaring national debts that push governments to borrow endlessly. These factors drive investors and ordinary people alike to seek safety in gold and real estate.
The momentum behind gold is unlikely to end in the coming months. As we’ve projected before, the price trend remains strongly bullish.
At World-Signals, we expect a minor correction just before the $5,000 level, likely a pullback of $400–$500, followed by a continuation of the uptrend throughout 2026.
It’s not impossible that those holding just a few gold bars by 2026 could find themselves millionaires.
Farewell to 4200 — The 4300 Era Begins!Gold has currently reached a high near 4295, just shy of 4300. Given the current upward momentum, it's easy for gold to continue its upward trend and test 4300. Because gold continues to hit new highs and break through the trend channel, there's currently no clear resistance zone above it, making it difficult to enter a short position in gold. Furthermore, a break above 4300 could significantly ignite bullish market sentiment and increase expectations for continued gold gains, pushing the price higher.
Therefore, we're primarily focusing on relatively significant support areas below. As gold's center of gravity continues to shift upward, its lows are gradually rising. Short-term support is concentrated in the 4265-4255 area, while further strong support lies in the 4240-4230 area. These two areas will be the long entry areas that we will focus on next.
Therefore, in short-term trading:
1. If gold first retreats to the 4265-4255 area, we can consider starting a long position in gold.
2. If gold continues to retreat to the 4240-4230 area, we can consider increasing our long position in gold.
3. If you still want to try to profit from the pullback, you can consider shorting gold in the 4298-4308 area. You must set a protection level (SL: 4300-4310) for counter-trend trading.
If you’re following this rally, don’t just watch — prepare your next move.
💬 Like & Follow for real-time updates and in-depth gold insights.
📈 Follow me for real-time gold insights &to my traders' channel for exclusive setups in bio!

A strong market. Timing is crucial.Gold prices continued their upward trend for the fifth consecutive day, reaching a new record high. Concerns about the economic risks posed by the US government shutdown, international trade wars, and escalating geopolitical tensions continue to drive capital flows into gold, a traditional safe-haven asset.
Furthermore, recent speeches by most Federal Reserve officials have paved the way for interest rate cuts, making the market virtually certain that an October rate cut is a foregone conclusion, with even a 100% probability of a December cut. The government shutdown, which has lasted 15 days and is costing approximately $15 billion in lost economic output daily, has also led to a decline in the US dollar index, which has fallen for two consecutive trading days, further bolstering gold's upward momentum.
On the 4-hour chart, prices continue to trade along the upper Bollinger Band. Despite a slight pullback early on, they have rebounded strongly, with current support levels moving up to around 4240-4230. Bullish momentum remains strong in the short term. Quaid believes the trading strategy remains focused on buying on pullbacks. However, caution is advised when following orders mid-trade to prevent sudden price pullbacks from causing losses. Please follow our channel for more real-time trading strategies.
Trading Strategy:
Buy in batches between 4240 and 4230, with a 10-point stop-loss. Profit range: 420-4280-4300.

The Golden Triangle is coming to an end, beware of profit takingGold Hourly Chart: The overnight close was relatively high, and today's Asian session continued its upward trend. The European session saw a sharp drop below the upper channel line at 4242. This trend resistance line is the same one that held pressure at 4218 in yesterday's European session. The market then closed with a large, plump, bearish candlestick pattern at 2:00 PM, reaching the target of 4210. Since it was a large bearish candlestick pattern, not a long lower shadow candlestick pattern, a rebound confirming the 5-day moving average at 4230-34 is sufficient, so a further downward push is warranted.
The European session saw consecutive positive days, testing the bottom and rallying to a new all-time high. However, caution is advised in the US session. On the one hand, the 4250 level is a resistance point in the channel, and on the other hand, it is nearing the end of an ascending converging triangle, leaving little room for further movement and a potential reversal. Therefore, support remains at the middle line at 4230. Only a significant break below this level would trigger a potential for a significant short-term correction. Resistance is at 4265. Be cautious about blindly chasing rallies below this level. Consider the gains and losses at both levels and wait for signals.
At the end of the ascending triangle, go shortToday, gold opened with a volatile climb and then consolidated at elevated levels. The bulls still have lingering momentum, but gold has been trading above its 5-period moving average for three consecutive days now. Since the start of this unilateral rally from 3,311, gold has consistently advanced with support from the 5-period moving average—only once did it find support at the 10-period moving average. When gold deviates from the 5-period moving average for an extended period and keeps rallying nonstop, a pullback correction is likely to occur. Furthermore, gold is trading at the end of an ascending triangle pattern, leaving little room for further movement, and a trend reversal could happen at any time.
Realistically, due to the U.S. government shutdown, it’s nearly impossible to make reliable judgments based on economic data right now—the data is simply too untrustworthy, and any outcome would come as no surprise. That said, I don’t believe inflation will ease at all. In fact, the U.S. government shutdown has dealt a severe blow to the U.S. economy. Additionally, tariff tensions have never truly subsided; on the contrary, they are currently escalating step by step. Under such circumstances, I don’t think U.S. inflation will slow down—in fact, I lean toward the possibility of further inflationary pressures. If that’s the case, the Federal Reserve will likely put rate cuts on hold. Even if a rate cut is forced through in October, it will impact the progress of future rate cuts. Once inflation heats up, gold faces a high risk of a sharp collapse.
In terms of market trading, gold’s rebound after the previous collapse has only fueled more bullish buying. Paradoxically, this has made the market unafraid of another collapse—traders now assume that any drop will be quickly followed by a rally to new highs. Amid the uptrend, chasing highs remains common, and rightly so, given the impressive gains in recent days. However, this could well be a sense of inertia instilled by the market, designed to make traders trust the bullish trend. If gold falls again, the decline will likely exceed 100 points.
Resistance Levels: 4,275, 4,300
Support Levels: 4,235, 4,220
Trading Strategy
While others are cautious, we’ll be greedy. We plan to consider shorting gold around the 4,275 level in the evening, waiting for a trend reversal.
For specific trading decisions, please follow my real-time updates. I post my trading ideas and strategies daily. If you lack a plan or clear direction for gold trading and struggle to achieve consistent, stable profits, you can refer to and follow my updates as a reference and guide to help you avoid mistakes.
10.16 Gold Short-Term Operation Guide!!!Three key points to watch today:
1. Position. Today's target is the 4200 area (previously, it started at 4000, then 4090, and yesterday was 4140).
The 4200 mark is today's early trading low. Using this as a dividing line, we're looking to sweep the $40 range above and below. A breakout will open up further opportunities.
2. Channel. The lower band of the channel overlaps with yesterday's low at 4140, while the upper band currently overlaps at 4220-4225.
Today's Asian session saw continued gains, breaking through the small channel range and extending gains by approximately $20 to 4242. However, after the breakout, the price fell back to 4203, retesting the previous high. If the market falls back into the channel, the support and resistance levels will shift again to the 4220-4225 area.
If it successfully holds above the support level, look for the 4200 area. If it breaks below, look for the 4180 and 4165 areas, with the 4145-4140 area exceeding the range.
Similarly, if it breaks above 4240, and the profit margin is halved according to the principle of equal distance, the next resistance level will be the 4270-4290 area.
3. Although the current result is an upward trend, the process has been characterized by significant ups and downs, with each initial move ranging from approximately $60 to $80.
So, regardless of whether you are long or short, regardless of the direction, at this moment, timing is more important than direction. Once confirmed, To determine a trigger, the first consideration is at least $60-80. Within this range, stick to one direction. If it's right, reap the rewards; if it's wrong, exit. Regardless of whether you're long or short, don't dwell on it.
The current market trend is extremely chaotic. In this chaotic situation, perseverance is more important than choice.
In summary, for gold today, Thursday, focus on the 4200 mark as a spatial boundary. From this boundary, we can see a range of $40 above and below.
Two key resistance levels: the upper limit of the 4220-4225 channel and the equally spaced upper limit of the profit margin at 4240-4242.
Using these two levels as resistance, we can see downward pressure on the price, looking for the 4200 area.
If it falls below 4200, Two key support levels are moving downward:
First, 4180, a support point that was repeatedly consolidated in the US market last night. Second, 4165-4160, the bottom of yesterday's sharp drop in the European market.
Of course, if the price does fall to the second support level, it will be easy to find the lower limit of the small channel at 4140, which is also yesterday's low.
Based on this idea, the European market price met expectations. Under pressure from 4242, a decline to 4203 helped to profit from the short position. The rebound continued, but the price slightly exceeded the range.
If the price exceeds the range, then the second confirmed high of 4242-4245 area is still a short position, with a stop loss at 4253 and a target of 4220-4200. If it falls below, look for 4180 and 4165.
Gold price timing is more important than direction
News:
Spot gold continued its upward trend for the fifth consecutive day in Asian trading on Thursday (October 16), reaching a new record high of $4,255 per ounce as global anxiety persisted.
Investor concerns about the economic risks posed by the US government shutdown, international trade wars, and escalating geopolitical tensions continued to drive flows into gold, a traditional safe-haven asset.
Furthermore, the Federal Reserve's dovish outlook supported demand for non-yielding bullion.
Specifically:
Looking at the 4-hour market trend, the short-term support at 4200-4190 is currently under consideration, with a focus on the key support at 4160-4166. The bulls are rising strongly and there is no end in sight. Trading strategies should focus on buying on pullbacks. In the middle, be cautious in chasing orders and patiently wait for key entry points. I will provide you with specific operation strategies in the channel, please pay attention to it in time.
Trading strategy:
Buy: 4220-4210, SL: 4200, TP: 4260-4275
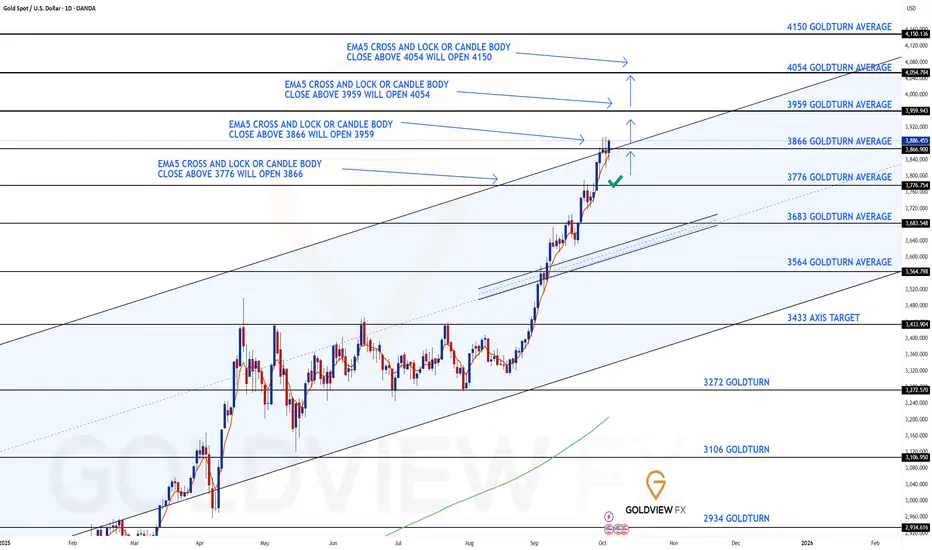
GOLD DAILY CHART ROUTE MAP UPDATEDaily Chart Update – Goldturn Channel Analysis
Hey Traders,
After successfully completing our previous Daily chart projection, we’re excited to share our latest Goldturn Channel update and Daily chart idea, our proprietary method of identifying structural turning points within Golds ascending channel formation.
Price action has now reached the upper boundary of the Goldturn channel, following a precise move to the 3866 target, triggered by the body close above 3776. With a new body close above 3866, we now have the 3959 gap open.
The 3866 channel top area remains a critical inflection point:
A confirmed EMA5 cross and lock above the channel top would strengthen the bullish breakout structure.
Conversely, an EMA5 rejection or close back below this level may indicate a fake out or short-term exhaustion.
On the downside, 3766 now acts as the nearest dynamic support, while 3683 aligns with the channel midline and remains a key structural pivot should deeper correction unfold.
As always, we will keep you all updated with regular updates throughout the week and how we manage the active ideas and setups. Thank you all for your likes, comments and follows, we really appreciate it!
Mr Gold
GoldViewFX
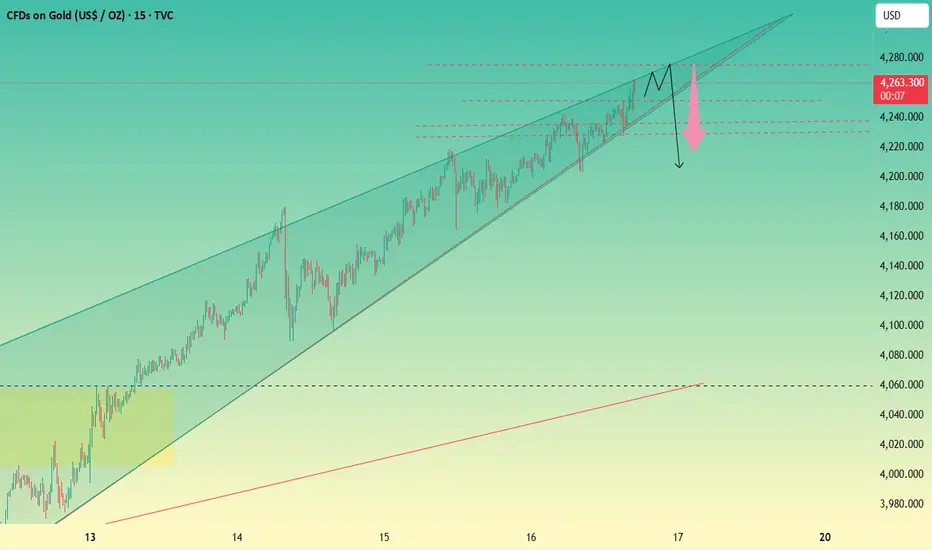
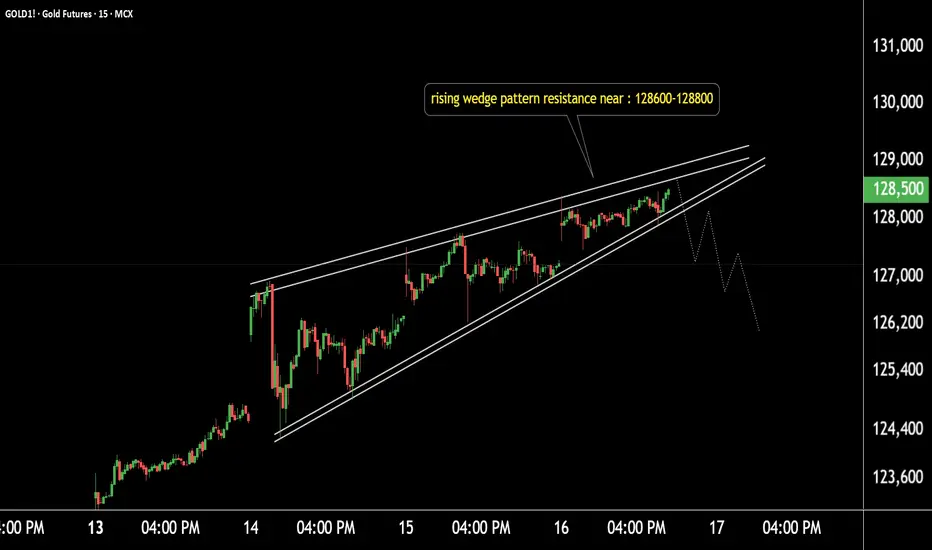
Gold at Risk of Pullback as Rising Wedge Pattern Emerges!Gold Technical Update (15-Min Timeframe)
Gold is forming a Rising Wedge pattern.
Resistance zone: 128600 – 128800.
If the resistance zone holds, selling pressure may increase.
The pattern indicates a potential downside move if price breaks below the lower trendline.
Traders should watch for a breakdown confirmation before taking any fresh positions.
GOLD PENDING SELL - Day 9 WIthdrawal ChallengeGOLD PENDING SELL - Day 9 WIthdrawal Challenge
A+ Setup
same setup as usual breakout of zone waiting for retracement and closure back in to zone
Entry: 4233.50
2 Tps (yellow lines)
1st TP set SL to breakeven and take partials
Once again today could be the last day of the challenge
use proper risk managment as once again gold keeps making ATHs over extending our zones

Mission Complete: 4245-4250:Time to Flip Short on Gold!Gold has already reached a high of around 4246, and its upward momentum has relatively weakened. To be honest, under the current market conditions, I do not advocate aggressively chasing gold above 4240, because as gold continues to rise, more and more callback risks are accumulated! We can also see that each surge in gold is followed by a clear pullback. So even if we choose to short gold, we can still get a good profit margin in the short term!
Although gold is on an overall upward trend, I still divide the rising channel into three areas; the first area: 4250-4220; the second area: 4220-4190, and the third area: 4190-4160. As gold rises, the technical traction of the lower area on the gold price becomes stronger. Therefore, according to the first area division, in the short term, gold has the need to at least retreat to the area near 4220. Even after falling below the area near 4220, it may continue the downward trend to the 4220-4190 area.
Therefore, in terms of short-term trading, I would prioritize trying to short gold in the 4245-4255 area, first targeting the short-term retracement area: 4230-4220 as the target.
If you’re following my trading strategy, don’t just watch — prepare your next move.
💬 Like & Follow for real-time updates and in-depth gold insights.
📈 Follow me for real-time gold insights &to my traders' channel for exclusive setups in bio!

Gold hits a new high. Go long on a pullback to 4180-4190.Gold continued its upward trend for the fifth consecutive day, with the current price approaching 4250 points as global anxiety persists. Investors are concerned about the economic risks posed by the US government shutdown, international trade wars, and escalating geopolitical tensions, which continues to drive flows into the traditional safe-haven asset of gold.
Traders now appear to have almost fully priced in the possibility of two more US Federal Reserve rate cuts this year. This has pushed the US dollar to a one-week low and bolstered the case for further near-term appreciation in gold. Meanwhile, gold bulls appear unfazed by extremely overbought conditions on short-term charts. This further validates the commodity's positive short-term outlook ahead of speeches by several influential Federal Open Market Committee (FOMC) members.
Although the bullish trend is quite obvious, it is difficult to keep track of the entry point in real time. The recent price increases are almost all in a straight line. Trading during the rise is risky but suitable for the current market. However, a more stable transaction is to wait for the price to pull back before going long.
From the current technical perspective, the Asian market rose in the early morning, and rebounded strongly after a slight correction in the European session. The short-term strong support is around 4180. It is relatively stable to go long at this price. The upward point should focus on 4060 and above. Of course, you cannot guess the top.
It should be noted that if there is an unexpectedly large adjustment space, you can pay attention to around 4160 below.

Continue to go long. When to enter?Gold started to rise steadily in the early Asian session on Wednesday, reaching a high of around 4218 but unexpectedly fell back quickly. It reached a low of 4164 and continued to rebound rapidly, and then has been fluctuating around the 4180-4200 range.
It continued to rise after opening on Thursday, setting a new high. The current high has reached around 4242. The strong upward trend is also the basic operation in the near future. However, the sudden and unexpected drop amidst this steady upward trend has left the market feeling somewhat frustrated and has discouraged many traders from chasing the gains.
In the short term, gold's volatility in the US market may be accumulating momentum for the next round of bullish gains. The daily chart remains strong, making it difficult to predict the top. Judging from the recent market performance, all pullbacks are traps set by the bulls, and the bulls are currently continuing to consolidate above 4230. Quaid recommends waiting patiently for the pullback before continuing to go long.
In the short term, buy around 4210-4205, with a profit range of 4240-4250 and a stop loss of 4195.

XAU/USD) Bullish Analysis Read The captionSMC Trading point update
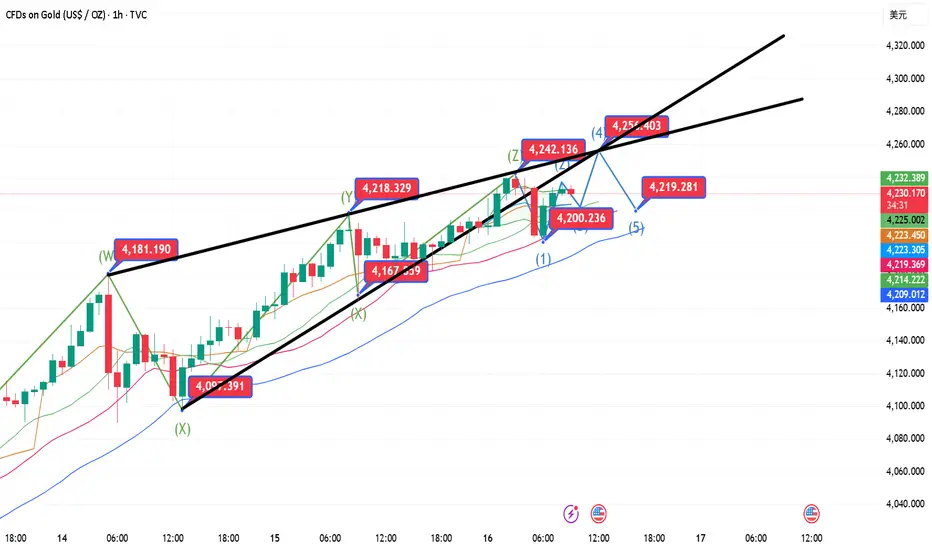
Technical analysis of XAU/USD (Gold) – Bullish Continuation Setup (1H Chart)
Technical Overview:
Instrument: Gold Spot (XAU/USD)
Timeframe: 1 Hour
Current Price: $4,238
Target Price: $4,303
Potential Move: +1.91% (approx. +80 points)
---
Chart Analysis:
1. Key Zone (Yellow Box):
This area represents a bullish order block / demand zone where price previously reacted strongly.
A small Fair Value Gap (FVG) exists within this zone, suggesting that price may retrace to fill it before continuing higher.
2. Price Action:
After a strong bullish impulsive move, price is currently showing a retracement back toward the order block zone.
The expectation is for price to retest this support zone and form a higher low, confirming continuation of the uptrend.
3. Moving Averages:
EMA 50 (Red) is above EMA 200 (Blue) → indicates a bullish trend structure.
Both EMAs are pointing upward, supporting bullish momentum.
4. Projected Move:
Once the retracement completes, a bullish push toward the target level at 4,303 is expected.
This level aligns with previous structure highs and potential liquidity targets.
---
Trading Outlook:
Bias: Bullish
Entry Zone: Within the highlighted yellow order block / FVG area
Target Point: 4,303
Invalidation: A 1-hour candle close below the order block would weaken the bullish scenario
Mr SMC Trading point
---
Summary:
Gold remains in a strong bullish structure, with momentum favoring further upside after a short retracement. Watching for confirmation signals (bullish engulfing, market structure shift) within the order block zone could provide a high-probability long setup.
---
please support boost 🚀 this analysis

XAU/USD) Bullish trend analysis Read The captionSMC Trading point update
Technical analysis of XAU/USD (Gold), 4H timeframe — here’s the detailed breakdown 👇
---
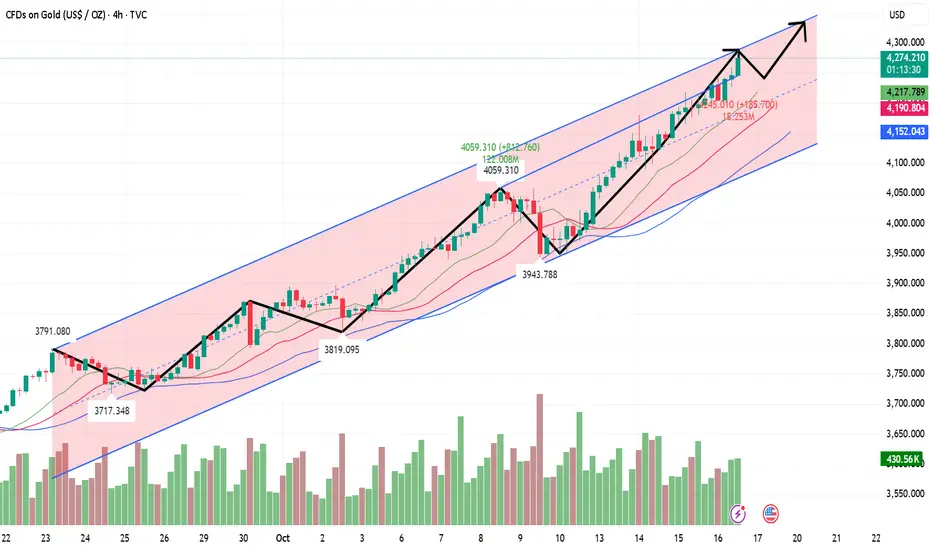
Trade Idea: Bullish Continuation Setup — XAU/USD
Market Context
Gold has been in a strong uptrend, forming higher highs and higher lows.
Price has recently broken above the previous resistance zone, signaling bullish continuation.
---
Key Technical Points
1. FVG (Fair Value Gap) Zone
The chart highlights an FVG area around 4,060–4,080, which now acts as a potential retracement zone.
Smart money often drives price back into these imbalances to mitigate orders before continuing the move up.
2. Retest Opportunity
Expect a pullback into the FVG zone, followed by bullish confirmation (rejection candle or structure shift).
This creates a high-probability long entry zone aligned with the prevailing bullish order flow.
3. Key Support Level
The 3,940–3,970 zone below acts as a major support / demand area, reinforcing the overall bullish bias.
4. Target Point
The projected target point is around 4,250, based on the measured move from the FVG breakout structure.
This aligns with liquidity resting above previous highs — a likely take-profit zone for institutional traders.
---
Trade Plan
Entry: Wait for price to retrace and show bullish confirmation inside the 4,060–4,080 (FVG zone).
Stop Loss: Below 4,040 (beneath imbalance / last swing low).
Take Profit: 4,250 target zone — completion of the bullish leg.
---
Market Logic
This idea follows Smart Money flow principles:
Break of structure (BOS) confirms bullish control.
Retracement to FVG provides a discounted entry.
Target liquidity above prior highs for exit.
--- Mr SMC Trading point
Summary:
Gold remains in a strong bullish phase — look for retracement entries into the FVG for continuation toward 4,250.
Please support boost 🚀 this analysis

Gold Holding Strong Above $4,100 — Bulls Eye $4,300 Next🌍 Market Update & Key Drivers
Gold is holding above $4,100/oz, after a strong run.
Safe-haven demand is still a major driver given global uncertainties (trade tensions, risk in U.S. fiscal policy).
The U.S. dollar remains soft, which is favorable for gold.
Fed rate-cut expectations are still elevated; major central banks and ETFs continue to accumulate gold positions.
Some caution emerges: central banks and institutional funds may take partial profits, leading to short-term volatility.
📈 Technical Structure & Levels
Support Zones
First: ~$4,100
Then: ~$4,050
Deeper: ~$4,000
Resistance / Target Zones
$4,200 → $4,300
If momentum is strong: $4,400+
The trend is strongly bullish, but momentum indicators suggest overextension. A cooling-off or sideways phase is possible before new highs.
🎯 Bias & Trade Strategy
Directional Bias: Bullish overall, but expect short-term consolidation.
Trade ideas:
Buy on dips into recent support zones (e.g. $4,050–$4,100).
Breakout trade: If gold convincingly breaks above $4,200 with strong volume, engage for a move to $4,300+.
Scalp / Short pullback: If you see reversal signals near recent highs, play short-term moves back to support.
Key risk factors include: hawkish surprises from the Fed, USD strength, or large profit-taking at extremes.
