XAU/USD Intraday Plan | Support & Resistance to WatchGold continues its powerful ascent, extending gains and printing new all-time highs in nearly every session.
Price is currently trending near 4,235 — an intraday resistance level — while momentum remains firm, showing sustained buyer dominance.
If price reclaims and holds above 4,235, the next resistance sits at 4,257, followed by 4,280 as an extended upside target.
Immediate support is seen at 4,205, and if a deeper pullback develops, watch the First Reaction Zone (4,176–4,150) for potential re-entry opportunities.
The broader bias remains bullish with MA50 and MA200 continuing to provide dynamic trend support.
📌Key levels to watch:
Resistance:
4235
4264
4280
Support:
4205
4176
4150
4112
4082
🔎Fundamental Focus:
Markets are increasingly betting that the Federal Reserve will cut interest rates sooner rather than later, boosting gold’s appeal as lower yields reduce the cost of holding the metal. At the same time, the U.S. government shutdown is adding another layer of uncertainty, freezing data releases and shaking confidence in fiscal management.
Tensions between the U.S. and China, along with political instability in parts of Europe and Asia, continue to weigh on global risk sentiment. Meanwhile, central banks and large funds keep accumulating gold as a hedge against debt, inflation, and a weakening dollar.
Together, these forces have created an environment with no clear ceiling for gold, as every dip is met with strong buying and momentum keeps pushing prices to new record highs.
Goldprediction

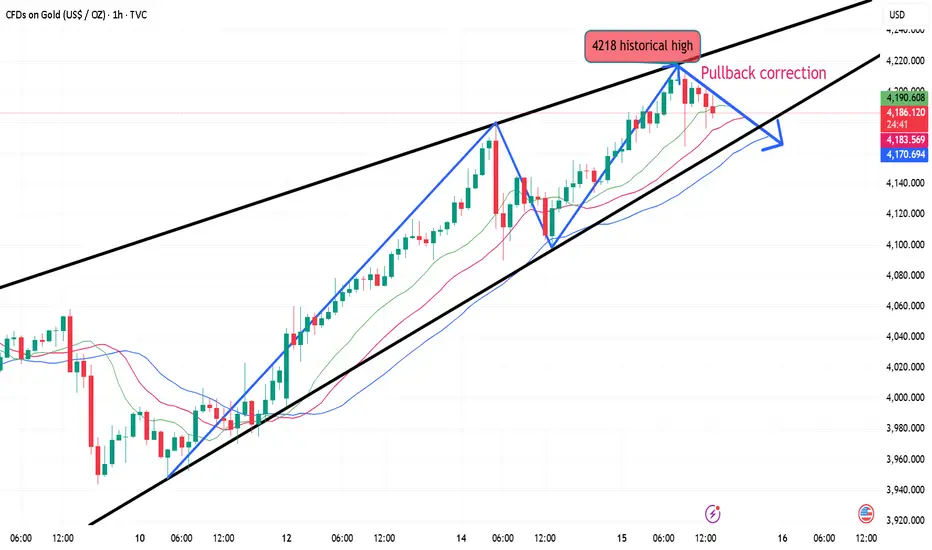
XAUUSD: Intraday trading plan and key levelsOANDA:XAUUSD continues to recover strongly after a 50+ point pullback from 4218 → 4165, bullish momentum remains sustained. However, for today’s session we should be cautious, as a sharp correction may occur now that price has achieved the 4250 target on Futures, which corresponds to 4240 on CFDs.
On the Options market, long put contracts are being executed in notable size—something that was rare in prior sessions.
⇒ Therefore, I assess that we should be cautious today because prices may be preparing for a sharp decline either today or in the coming sessions.
That said, we must also account for the possibility of one final push higher before the downside begins.
Key levels to monitor for price action and potential scalp trade setups:
Resistance:
Resistance:
Margin zone resistance:
Strong resistance:
Support:
Support: ,
Margin zone support:
Strong support:
Always be patient and wait for the price to reach the support and resistance zones above and get confirmation. Do not place limit orders or enter orders when the price is increasing or decreasing sharply.
Take advantage of the above support and resistance zones and trade short-term when the price reacts at these support and resistance zones.
Wait for reactions such as Engulfing candles, Doji,... at the support and resistance zones.
Always set stop losses when trading and manage risks closely.
Victor Dan @ ZuperView

Don't miss any opportunity to go long on a pullbackAfter we gave our trading ideas last night, gold touched the upper pressure level as expected. After we tried to arrange short orders as planned, we left the market safely in the early morning.
At present, gold continues its strong upward trend, with daily lines closing positively for consecutive days, and the bull-dominated pattern is further consolidated. I have pointed out many times before that the current gold price deviates greatly from the moving average, and the indicators show overbought divergence characteristics. We need to be vigilant about possible short-term correction needs, which has also been verified many times. In the short term, gold continues to rise again. The upper pressure can be focused on 4260-4270, which is also the channel suppression level. When it is touched for the first time, you can try to short with a light position.
But remember, our core trading ideas remain unchanged and we remain bullish in the medium to long term. Short selling is only an auxiliary trading strategy. Any downward adjustment before effectively breaking through the key support point can be regarded as a short-term technical correction, thus providing a better entry opportunity for bulls.
Pay attention to the support of 4205-4190 below. If it retreats to here, you can continue to go long on gold. The important strong support is still 4140.
OANDA:XAUUSD

XAUUSD Delivered Excellent profits [600 PIPS]
Thanks to those who followed, trusted me, and made profits.
As I mentioned in today’s commentary session:
• I took buy trades around 4190-4180, and I’m expecting the market to test the 4240 benchmark, with an extension towards 4275.
My strategy was to buy the dips, and I’m very happy with the profits so far – .
My first target (4240) is achieved, Alhamdulillah.
**Additional Tip:**
Selling against the current bullish bias isn’t advisable, I will buy the dips and wait for the new Setup

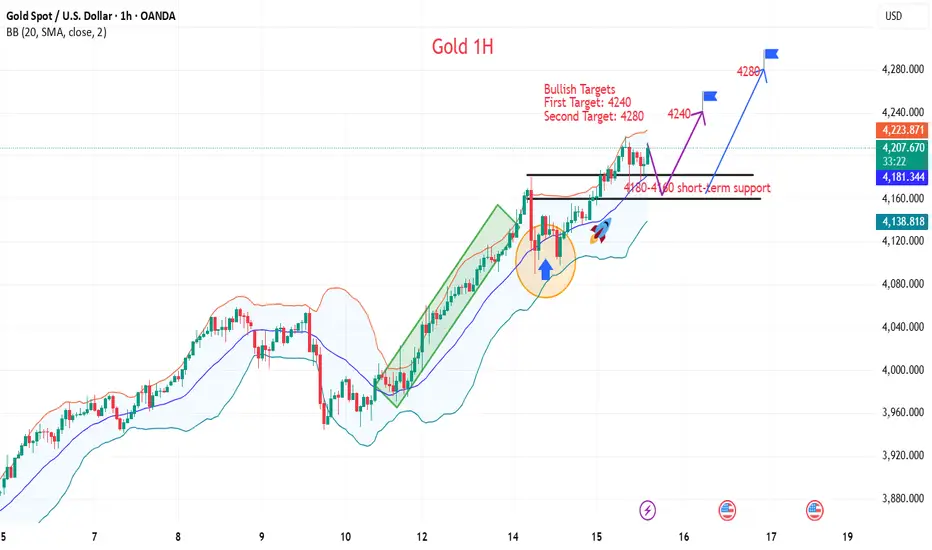
Gold Analysis - Can Buyers Push the Price to $4,250?OANDA:XAUUSD is currently moving within a clearly defined upward channel, with prices consistently adhering to both the upper and lower boundaries of the channel. The recent bullish momentum indicates that the buyers are in control, creating a strong possibility for the uptrend to continue in the near future.
Recently, the price broke through a key resistance level and is now retracing to test it again. If this level holds as support, it will further reinforce the bullish structure, and the next target of 4,250 will become attainable, aligning with the upper boundary of the channel.
As long as the price remains above this support zone, the bullish outlook will remain intact. However, if the support is broken, the bullish scenario could be invalidated, increasing the likelihood of a deeper pullback.
Remember, before making any trading decisions, always confirm your setups and ensure you are managing risk effectively.

Gold Price Outlook – Trade Setup (XAU/USD)🔹 Technical Structure
TVC:GOLD Gold has extended its rally above the $4,200 handle, testing the $4,240–$4,246 resistance zone highlighted on the chart. Momentum remains bullish in the short term, but price is facing rejection near the upper boundary.
Support Zone: $4,204 – $4,210 (marked in red/purple)
Resistance Zone: $4,240 – $4,246 (marked in yellow)
Current bias shows a potential pullback from resistance before another attempt higher.
The drawn projection suggests a corrective dip back into the support zone, followed by a renewed bullish wave toward resistance.
🔹 Trade Setup
Entry: $4,204 – $4,210 (on pullback into support zone)
Stop Loss: $4,202 (below key support structure)
Take Profit 1: $4,240 (resistance re-test)
Take Profit 2: $4,246+ (extension above resistance)
Risk–Reward (R:R): ≈ 1 : 3.92
🔹 Macro Background
Gold continues to trade at elevated levels, supported by strong safe-haven demand amid U.S.–China trade tensions and expectations of further Fed rate cuts. Market participants anticipate a 25bps cut at the October FOMC, with an additional cut in December and more in 2026. Fed Chair Powell’s comments on slower job growth reinforced dovish bets, lowering yields and boosting gold.
Additionally, the newly imposed U.S.–China port fees have increased geopolitical risk, pushing investors to hedge with gold.
🔹 Key Technical Levels
Resistance: $4,240 / $4,246
Support: $4,210 / $4,204 / $4,200
🔹 Trade Summary
Gold remains in a bullish trend but faces heavy resistance near $4,246. A pullback to the $4,210 support zone offers a potential buy-the-dip opportunity, targeting resistance re-tests. Macro fundamentals continue to favor gold’s upside, but near-term corrections are possible before another breakout attempt.
⚠️ Disclaimer
This analysis is for reference only and does not constitute trading advice. Trading involves significant risk, and proper risk management is essential.

Is the bull market over? Here's the strategy.Information Summary:
Gold continued its upward trend in early Asian trading Thursday, reaching a new all-time high near $4,226. This was primarily due to growing bets on a Fed rate cut and geopolitical concerns, which led investors to flock to the safe haven of gold.
In addition, Fed Chairman Powell's dovish stance and the Beige Book, which revealed concerns about stagflation, boosted demand for safe assets. So far this year, gold prices have risen by over 60% due to geopolitical uncertainty, expectations of a Fed rate cut, central bank purchases, and strong inflows into ETFs.
Market Analysis:
Gold maintained its bullish trend, reaching a new all-time high on Wednesday, breaking through the 4,200 mark. The daily chart shows continued bullish momentum with strong volume. The 10-day moving average (MA) and 7-day moving average (MA) continue to form a golden cross, with the 5-day moving average moving upwards towards 4,140. The RSI indicator remains in the overbought zone, above 80.
Bollinger Bands on the 4-hour and 1-hour charts are opening upwards, indicating that the price is trading within the upper mid-range range. The current gold bull market isn't over yet. Each sharp drop is merely a correction. Until the bullish trend ends, the top pattern remains undetermined, so avoid blindly guessing the top.
It's important to note that recent trends have all been new highs in the Asian session, declines in the European session, and sideways fluctuations in the US session. The trading strategy remains to buy on dips.
Key Points:
First Support Level: 4190, Second Support Level: 4175, Third Support Level: 4160
First Resistance Level: 4235, Second Resistance Level: 4240, Third Resistance Level: 4250

Profit Both Ways — Double the Trades, Double the Thrill !After gold hit above 4210, it showed obvious signs of stagflation. First, after gold touched around 4218, it retreated to around 4164; secondly, after gold touched around 4212 during the rebound, it retreated again to around 4179.While the two pullbacks were limited, they also indicate that after gold's strong rally, the market is beginning to diverge and diverge.
We can use the ABC rule to determine the position of D. Based on the chart composition, D is around 4160. That is to say, in the short term, gold has the need to retreat to around 4160 again, and this area is also a strong defense line for bulls. If this defense area is broken, gold may continue its downward trend and test the bull-bear dividing line of 4140-4130.
So after a clear rejection signal appears, I think we can continue to try to short gold in the 4205-4215 area. The retracement target area is first located in the 4180-4160 area; and once gold retreats to the 4160-4150 area, we can wait for an opportunity to rejoin the gold long trade!

GOLD Breakout area? What's next??#GOLD ... Now market have upside breakout and current resistance is is 4207-08
Keep close that area because sustain above means further rise expected.
SteroidsFX
Trade wisely

10.15 Gold continues to rise, beware of a pullbackGold 4-hour chart level: Asian session directly pulled up strongly. The overnight closing itself was not at a relatively high level, and it was still 40 meters away from the previous high. After a short squeeze and strong pull, it did not stop until the European session reached the upper track of the yellow channel 4218 in the figure, and then there was a sharp drop, with the lowest point at 4165. The high point of this wave of suppression was predicted in place (4215 was prompted in advance to pay attention to the resistance pressure), but the low of 4165 was only touched for a few seconds, so only 4180-4190 can be chosen; Judging from the current trend, the US session tends to see a strong consolidation at a high level. The resistance is still the derivative of the upper track of the yellow channel, which will move up to 4220-25. The support is the middle track 4170, which is also the retracement point of the previous red channel line; after approaching both sides, we will look for pressure or support signals to try to make a shock;
Prices remain high. The bullish trend remains intact.The overall market remains bullish, and pullbacks present opportunities for buying. Gold, as expected, broke through the 4200 level today before quickly falling and rebounding.
From a technical perspective, gold has risen strongly and quickly corrected its price after setting a new high, but it still received support from buyers at low levels, and the price rebounded quickly after hitting a low of 4164.
The 1-hour chart shows that it is in a flag-shaped consolidation pattern, and the support level is moving steadily upward. Key support has now risen to $4180. As long as gold prices hold above this level, the uptrend remains intact. The moving average system continues to form a golden cross and diverge in an upward bullish arrangement. The bullish momentum of gold still exists and continues to maintain a strong pattern.
The 4-hour chart has effectively broken through the previous range of resistance, with the next key target near $4230. Quaid recommends placing long positions above 4180, with targets potentially moving towards 4230-4250.

Gold surged and then retreated. Latest Analysis.On Wednesday, gold continued its recent record-breaking run, finding buying support for the fourth consecutive trading day. Against a backdrop of favorable fundamentals, gold prices hit a new all-time high of $4,218.19.
Persistent geopolitical tensions, escalating trade frictions, and market concerns about a prolonged US government shutdown have all contributed to the key factors supporting this surge in safe-haven assets. It is important to note that despite technical indicators indicating overbought conditions, gold bullish momentum has not weakened, suggesting that the path of least resistance remains upward and the recently established upward trend is likely to continue.
In early Asian trading, gold bulls stabilized in the 4,140 area and re-energized, breaking through the record high of $4,200. Until there is a clear signal of a peak, do not blindly guess the top location. In the short term, a buy-on-low approach is recommended, with key support focused on the intraday low and the short-term uptrend support from 4,090.
The first resistance level to watch is around 4210-4215, followed by 4240. Support is expected to be around 4180-4160. For gold, a short-term strategy is to buy on pullbacks.
Trading strategy:
Buy gold in batches on pullbacks between 4180-4160, with a stop-loss of $10. Profits are expected to be above 4200.

Gold → Every step up, the risk of a crash increasesAs I said in my previous article, the momentum of gold bulls has been weakened to a certain extent. Now, with every step up in gold prices, the possibility of a collapse increases. The current emotional value is driving gold prices up. We can clearly see today that after breaking through 4200, the momentum of gold has weakened significantly. We clearly saw today that after breaking through 4200, gold's momentum has weakened significantly. We shorted gold at 4199 and 4216, and have both taken profits at 4180. We will monitor the resistance levels of 4218-4223 tonight and take action when the time is right.
For specific trading decisions, please follow my real-time updates. I post my trading ideas and strategies daily. If you lack a plan or clear direction for gold trading and struggle to achieve consistent, stable profits, you can refer to and follow my updates as a reference and guide to help you avoid mistakes.
Bull Gold Pullback As per market structure, gold might be going through a pullback before it continues it's bullish run

Is the Gold Rally Fading? How does a short position start?
News:
Spot gold prices continued their upward trend in early Asian trading on Wednesday (October 15th), surging by over $20 to $4,165.89 per ounce as of 7:42 AM. Renewed concerns about the international trade situation are providing upward momentum for gold prices.
International trade concerns, the US government shutdown, geopolitical tensions, and shifting monetary policies are expected to fuel further price increases.
Conclusion: In the short term, the international trade situation may become a key variable. If signals of reconciliation are released, gold prices may fall back; but if friction escalates, the $4,280 mark will be easily surpassed.
Specifically:
On the downside, a pullback towards $4,100 could attract buying, potentially finding support in the $4,060-4,055 range. However, a break below this support level could trigger a technical sell-off, pushing gold prices towards the psychologically important $4,000 level – a level that coincides with the rising trendline support and the 50-period simple moving average (4018.08) on the 4-hour chart. Therefore, a confirmed break below this key area could be the first sign of bullish momentum exhaustion and pave the way for a deeper correction.
On the upside, a sustained hold above $4,200 could trigger a retest of the intraday high, pushing bulls towards $4,250 and, subsequently, the $4,300-4,280 range.
Trading strategy:
Buy: 4180-4170, SL: 4160, TP: 4240-4280
Short positions will be reminded in time according to the trend
Markets Brace for U.S. Retail Sales & Fed VolatilityXAUUSD – Intraday Trading Plan | by Ryan_TitanTrader
📈 Market Context
Gold prices hover near $4,190 after an early-week rally as traders brace for U.S. Retail Sales data and a new round of Federal Reserve speeches later today.
Recent gains were fueled by softer inflation readings, yet the dollar remains resilient amid hawkish undertones from Fed officials. Markets are now balancing between expectations of slower growth and persistent rate-cut caution.
A stronger-than-expected Retail Sales print could pressure gold temporarily, but any dovish signal from Fed speakers may quickly restore bullish momentum. Expect liquidity hunts on both sides before a confirmed direction forms.
🔎 Technical Analysis (1H / SMC Style)
• Structure remains bullish after multiple Breaks of Structure (BOS) and a recent Change of Character (ChoCH) confirmation.
• Price is approaching the Premium Zone (4211–4209) — a potential liquidity sweep area where short-term sellers may react.
• Below, the H1 FVG Buy Zone (4145–4149) offers a discount entry aligned with recent BOS support and previous mitigation points.
• Maintaining a bullish bias while awaiting clean reaction within the FVG zone is key for continuation toward new highs.
🔴 Sell Setup: 4211 – 4209
SL: 4218
TP targets: 4190 → 4175 → 4155
🟢 Buy Setup: 4145 – 4147
SL: 4138
TP targets: 4170 → 4190 → 4220+
⚠️ Risk Management Tips
• Wait for M15 ChoCH/BOS confirmation before entry to avoid false breaks.
• Expect high volatility around Retail Sales and Fed remarks — spread widening is likely.
• Partial take-profits near intra-day liquidity points are recommended.
✅ Summary
XAUUSD remains bullish on structure but faces a potential liquidity grab around 4211–4209 before retracing into the H1 FVG buy zone (4145–4149).
Smart money may seek to accumulate long positions after a controlled pullback, especially if Fed commentary echoes a slower policy tightening path.
Intraday bias leans Buy the Dip, with caution around macro-driven volatility spikes.

How far does gold grow?Hello friends
Well, you see that after almost 4 years of suffering, gold has broken its suffering and has had a good rise.
Now, the support areas have been identified, which I obtained with Fibonacci. You can see the resistances of gold, which are currently at important resistance, but in this strong upward trend, it is not logical and principled to think about selling, and we should try to enter the price pullbacks.
Numbers that can be good support in order.
3800
3500
3300
.
Now what do we do if the resistance breaks?
Well, the same resistance becomes our support and we can use it.
Given the great growth that the price has had, it is expected that we will have a correction or that the price will rest.
*Trade safely with us*


BUY GOLD Gold will be buying and I’ve set a buy limit to make sure I’ll be able to catch it at the right time join in with me but keep it all professional and not too risky as we are following the trend

Gold buy above 117815 tgt 120000 positonalGold buy above 117815 tgt 120000 positonal
Gold buy above 117815 tgt 120000 positonal
Gold buy above 117815 tgt 120000 positonalGold buy above 117815 tgt 120000 positonalGold buy above 117815 tgt 120000 positonalGold buy above 117815 tgt 120000 positonalGold buy above 117815 tgt 120000 positonalGold buy above 117815 tgt 120000 positonalGold buy above 117815 tgt 120000 positonalGold buy above 117815 tgt 120000 positonalGold buy above 117815 tgt 120000 positonalGold buy above 117815 tgt 120000 positonalGold buy above 117815 tgt 120000 positonalGold buy above 117815 tgt 120000 positonalGold buy above 117815 tgt 120000 positonal

XAUUSD on Retracement overall bullish trend XAUUSD is still on bullish Bias and holding rising wedge pattern but retracement can be on strike.
What will I do Today?
✳️ currently market is bit tricky for scalpers and retailers let's assume a scanario or condition of mine .
- I'm on buy from 4190 and expecting H4 candle remains above the mentioned upper zone then hold for targets.
My target will be $4235 & 4260 In extension !!
✳️ Secondly
if any candle closes below 4180 then our buying will be postpond and we'll have retracement towards 4135 then 4110 in extension ,
Additional Tip:
-BUY the Dips
OR

XAUUSD Delivered Excellent profits [ 1570 pips straight]Thanks to those traders who followed us and made profits 📈🙏 keep grinding 💪.
I booked profits on buying orders during overnight session, entering around 4142 & 4132 and exiting near 4105 while my shorter-term longs hit the 4098 target on yesterday Ny session drop.
Next I bought XAUUSD 4102 which I hold overnight and it's 1200 pips floating in profits.
Going forward, I’ll continue buying dips from my key entry zones as long as Gold holds above the bullish trend till 4170.

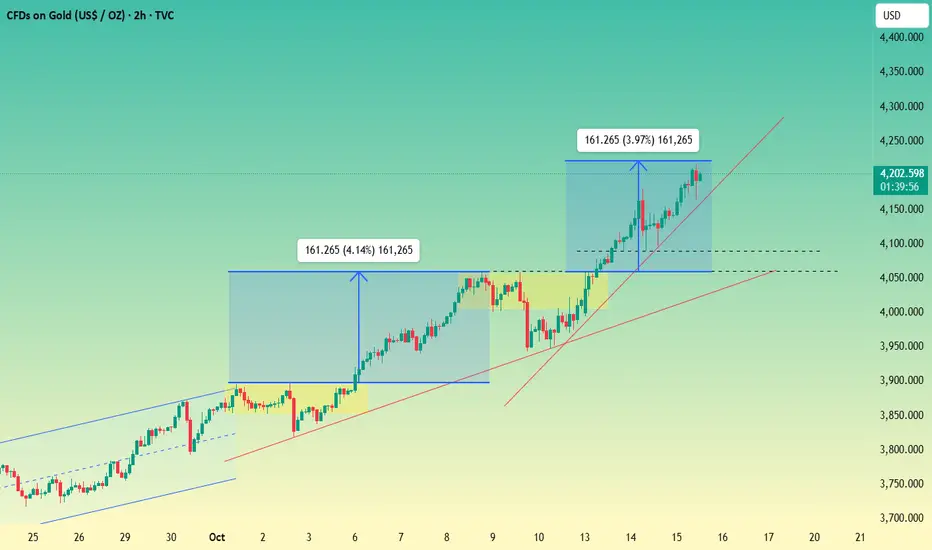
XAUUSD: Key levels to watch in today's trading sessionAfter a correction from 4180 → 4090, OANDA:XAUUSD rebounded strongly immediately and continued to rise to new ATH levels in today's trading session. With a strong uptrend and high volatility at the moment, we will look for intraday scalps as prices head towards support and resistance zones.
In the Options market, gold is being accepted for trading in the high value zone after the price surpassed the 4200 USD/Ounce mark with more than 320 Longcall contracts being filled at 4200 USD/Ounce.
At 4250 on the Futures market, there are more than 250 Longcall contracts being filled right now, so this will be the target that prices can aim for in today's trading session.
Update: More than 100 contracts at 4260 and 4275.
Some other support and resistance levels that we can monitor for trading in today's session:
Resistance:
Margin zone resistance:
Resistance:
Support:
Margin zone support:
Support: ,
Strong support:
Take advantage of the above support and resistance zones and trade short-term when the price reacts at these support and resistance zones.
Wait for reactions such as Engulfing candles, Doji,... at the support and resistance zones.
Always set stop losses when trading and manage risks closely.
Victor Dan @ ZuperView
