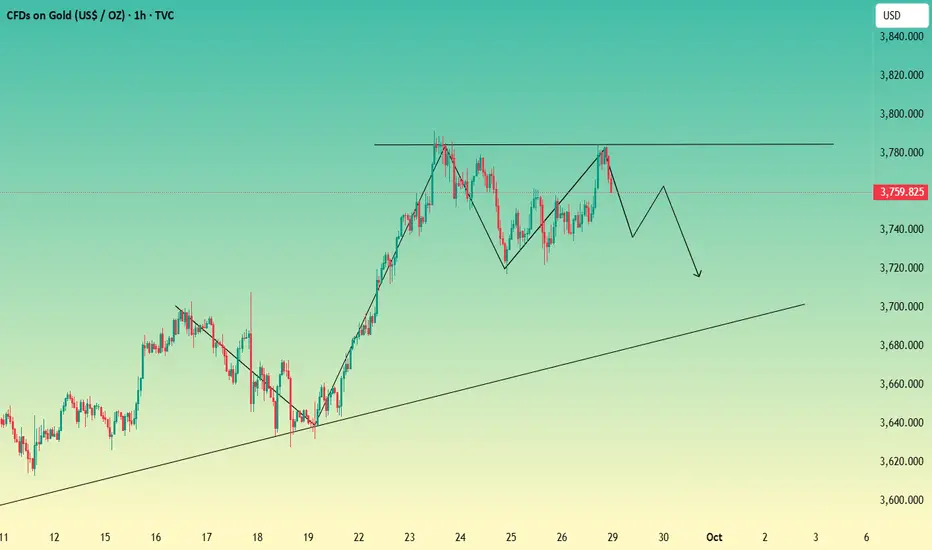
Double top expected, short at the beginning of the weekLast week, after a brief sideways consolidation following the opening, gold surged steadily and hit a new all-time high around 3,791. However, after a pullback correction on Wednesday, its upward momentum weakened relatively. During Friday’s U.S. trading session, gold rallied to around 3,783 before pulling back, closing near the 3,759 level.
Technically, the daily chart shows a single bearish candlestick for the pullback, while Friday formed a small bullish candlestick with an upper wick—once again standing above the moving average system. This suggests gold is relatively in the early stage of preparing for a second rally. The weekly chart also closed as a medium bullish candlestick, indicating the overall broad market sentiment remains bullish. Driven by a series of bullish patterns, gold may see a trend reversal (breakout) move next week. After all, the pullback from Friday’s U.S. session high could very well be a short-term "washout" by bears.
For gold to refresh its highs next week, Friday’s secondary high must be broken in a timely manner. Meanwhile, during pullbacks, the 3,770 level—now a top-bottom conversion zone—will act as a key short-term resistance. If gold opens under pressure below this level on Monday, it may break lower again later. On the 1-hour chart, if gold fails to extend its upward move, a "double top" pattern could form.
A series of major economic data releases are scheduled for next week. Gold will likely trade in a consolidation range early next week, given the lack of significant news triggers initially. Focus on the resistance at 3,790 first—we expect a pullback initially, with support to watch around the 3,720 zone. If Monday’s rebound lacks strength, prioritize short positions on rallies.
As market conditions change rapidly, please follow my channel for specific trading key points, including execution details for both long-term and short-term trades. If you are willing, feel free to share your current position status—we can analyze together whether it is safer to hold patiently or adjust and rebalance your positions in a timely manner.
Goldprediction
Short Term Market Outlook XAU/USDWhat goes up must come down!
🎯15m chart analysis 🎯
As most experienced gold traders are already aware of its aggressive ranging behaviour many new retail gold traders fail to understand this causing them to get chewed up and spit out in this power house of a pair.
Having an edge against this aggressive range is the key to being able to trade gold successfully long term.
I have highlighted some important areas for you guys to keep an eye out for pull backs, look for rejections and candle closures above and below these zones. Overall market sentiment remains bullish so take sells with extra caution and lighten your positions up. I will keep you guys updated with further levels throughout the week, subscribe and turn notifications on 👁️👁️
Good luck to everybody, let’s make some money this week 💥

GOLD High placed? What's next??#GOLD.. market placed a very reasonable high so far and now going to break his supporting area.
Kep close upside region that can play major role in next move.
Don't be lazy here.
NOTE: we will go for cut n reverse above region not before that.
Good luck
Trade wisely
GOLD OUTLOOKGold has been floating around record highs. I see further gains ahead, driven by artificial intelligence, earnings, and resilient consumption.
A break above $3791 would see further long for buyers while a break below $3628 would trigger sellers for short term positions.

Gold opening operation strategy
News:
The core PCE price index, the Federal Reserve's preferred core inflation indicator, rose 0.2% month-over-month in August, in line with market expectations and down from the 0.3% initially reported in July (a figure that was revised downward to 0.2%). Year-over-year, the core PCE price index remained stable at 2.9%, indicating that inflation, while declining, remains above the Fed's 2% target.
The overall PCE price index rose 0.3% month-over-month in August, in line with expectations and higher than the 0.2% increase in July. The year-over-year increase also edged up slightly from 2.6% in July to 2.7% in August.
Specifically:
Friday's US market hit near 3784 before retreating, which is also our expected target.
The market closed at 3760, with the 4-hour chart showing a bearish pullback pattern. The daily chart formed a small bullish candlestick with an upper shadow on Friday, once again crossing above the moving average, indicating a potential for a secondary rally. The weekly chart also closed with a medium-sized bullish candlestick, indicating an overall bullish trend.
From the 4-hour analysis, short-term support below is around 3735-3740, with important support remaining around 3720. Short-term pressure above is around 3770-3780. Trading strategies should focus on buying on pullbacks. In the intermediate range, be cautious in chasing orders and patiently wait for key entry points. I will provide detailed trading strategies in the channel, so please pay attention.
Strategy:
Long Position3740-3735,SL:3720,Target:3770-3790

Trend changes? Outlook for next week.Gold rose strongly on Friday, hitting a high of around 3783. It began to fall before the closing of the US market and did not break through the new high. So, will gold hit a historical high or start to correct?
Gold has broken through the recent consolidation range on the 4-hour chart, and the upward trend extends to the historical high of $3,791. If the gold price continues to fall below $3,750, short-term trend will be more bears, and may return to the previous consolidation range. The downward target will focus on 3720-3700. On the upside, if the gold price clearly breaks through the suppression position of 3780-3790, it will release new bullish momentum and pave the way for gold prices to move towards a new price range.
The gold 1-hour trend temporarily remains in a narrow range oscillation, but after continuous oscillation, there are signs of upward movement in the short-term moving average. If the 1-hour moving average cannot continue to run upward, then gold may be in a state of reaching its peak.
Some major data will appear next week, and there is a high probability that the golden week will still remain fluctuating at the beginning of the golden week. If there is no stimulating news, please pay attention to the first support of 3750, followed by the support of 3720 area. In terms of short-term operation ideas in Asia on Monday, Quaid recommended that rebounds should be the main focus, and pullbacks should be the supplement. The short-term focus on the suppression position of 3780-3790, and the lower focus on the first-line support of 3740-3730.
The happy weekend is approaching, I wish you all a happy transaction next week.

GOLDGOLD if started correcting here then it will give us some more upside above 3800 before any major pullback.
Disclosure: We are part of Trade Nation's Influencer program and receive a monthly fee for using their TradingView charts in our analysis.

GOLD 1H CHART ROUTE MAP UPDATE & TRADING PLAN FOR THE WEEKHey Everyone,
Please see our updated 1h chart levels and targets for the coming week.
We are seeing price play between two weighted levels with a gap above at 3780 and a gap below at 3753. We will need to see ema5 cross and lock on either weighted level to determine the next range.
We will see levels tested side by side until one of the weighted levels break and lock to confirm direction for the next range.
We will keep the above in mind when taking buys from dips. Our updated levels and weighted levels will allow us to track the movement down and then catch bounces up.
We will continue to buy dips using our support levels taking 20 to 40 pips. As stated before each of our level structures give 20 to 40 pip bounces, which is enough for a nice entry and exit. If you back test the levels we shared every week for the past 24 months, you can see how effectively they were used to trade with or against short/mid term swings and trends.
The swing range give bigger bounces then our weighted levels that's the difference between weighted levels and swing ranges.
BULLISH TARGET
3780
EMA5 CROSS AND LOCK ABOVE 3780 WILL OPEN THE FOLLOWING BULLISH TARGETS
3802
EMA5 CROSS AND LOCK ABOVE 3802 WILL OPEN THE FOLLOWING BULLISH TARGET
3825
BEARISH TARGETS
3753
EMA5 CROSS AND LOCK BELOW 3753 WILL OPEN THE FOLLOWING BEARISH TARGET
3734
EMA5 CROSS AND LOCK BELOW 3734 WILL OPEN THE FOLLOWING BEARISH TARGET
3705
EMA5 CROSS AND LOCK BELOW 3705 WILL OPEN THE SWING RANGE
3683
3654
EMA5 CROSS AND LOCK BELOW 3654 WILL OPEN THE SECONDARY SWING RANGE
3622
3592
As always, we will keep you all updated with regular updates throughout the week and how we manage the active ideas and setups. Thank you all for your likes, comments and follows, we really appreciate it!
Mr Gold
GoldViewFX

GOLD 4H CHART ROUTE MAP UPDATE & TRADING PLAN FOR THE WEEKHey Everyone,
Please see update on our 4H chart idea from last week, which is playing out as analysed and still valid to continue to track for the coming week.
After completing our Bullish targets last week with ema5 cross and lock confirmation, we are now seeing price play between 3738 and 3778. . We will need to see ema5 cross and lock on either of these two weighted level to determine the next range.
We will also now use lower Goldturns for support and Bounce until we see further cross and lock above for a continuation.
We will keep the above in mind when taking buys from dips. Our updated levels and weighted levels will allow us to track the movement down and then catch bounces up.
We will continue to buy dips using our support levels taking 20 to 40 pips. As stated before each of our level structures give 20 to 40 pip bounces, which is enough for a nice entry and exit. If you back test the levels we shared every week for the past 24 months, you can see how effectively they were used to trade with or against short/mid term swings and trends.
The swing range give bigger bounces then our weighted levels that's the difference between weighted levels and swing ranges.
BULLISH TARGET
3696 - DONE
EMA5 CROSS AND LOCK ABOVE 3696 WILL OPEN THE FOLLOWING BULLISH TARGETS
3738 - DONE
EMA5 CROSS AND LOCK ABOVE 3738 WILL OPEN THE FOLLOWING BULLISH TARGET
3778 - DONE
EMA5 CROSS AND LOCK ABOVE 3778 WILL OPEN THE FOLLOWING BULLISH TARGET
3811 -
EMA5 CROSS AND LOCK ABOVE 3811 WILL OPEN THE FOLLOWING BULLISH TARGET
3845
BEARISH TARGETS
3655
EMA5 CROSS AND LOCK BELOW 3655 WILL OPEN THE FOLLOWING BEARISH TARGET
3615
EMA5 CROSS AND LOCK BELOW 3615 WILL OPEN THE FOLLOWING BEARISH TARGET
3583
EMA5 CROSS AND LOCK BELOW 3583 WILL OPEN THE SWING RANGE
3546
3509
EMA5 CROSS AND LOCK BELOW 3509 WILL OPEN THE SECONDARY SWING RANGE
3458
3409
As always, we will keep you all updated with regular updates throughout the week and how we manage the active ideas and setups. Thank you all for your likes, comments and follows, we really appreciate it!
Mr Gold
GoldViewFX

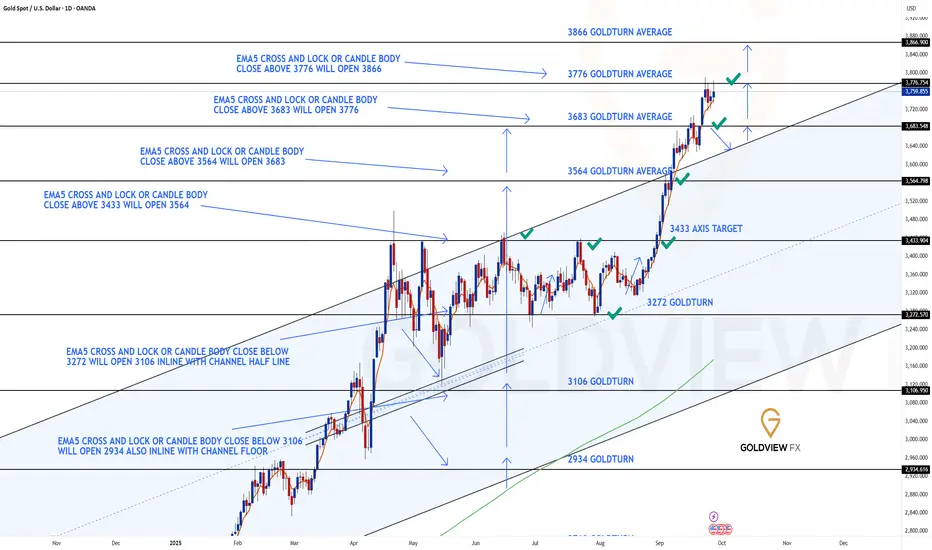
GOLD DAILY CHART ROUTE MAP UPDATEDaily Chart Update – Follow Up
3776 Target Achieved!!
Previously, we highlighted the importance of a candle body close above 3683, which opened the gap toward 3776. That target has now been hit with precision last week.
With 3776 now achieved, the key focus shifts to the daily close:
A sustained candle body close above 3776 will confirm the breakout and open the path toward 3866, especially if we see the EMA5 cross and lock in alignment.
For now, any rejection at this level would ideally see the channel top act as support, allowing room for a healthy correction while maintaining the broader bullish structure.
However, if price rejects and slips back into the channel, then range-bound play resumes within the channel zone.
Current Outlook
🔹 3683 Target Reached
Our breakout sequence played out with precision, starting from the EMA5 lock above 3564 and extending to complete the 3683 objective.
🔹 3776 Target Completed
Last weeks price action delivered the full upside completion into 3776. Now, new daily close will decide whether the breakout extends further into new ranges.
🔹 Key Inflection – 3776
Close above = breakout expansion toward 3866.
Rejection = retest of 3683 and channel top as support, or deeper channel play if momentum fades.
Updated Key Levels
📉 Support – 3683 & Channel Top
📉 Deeper Support – 3564 & 3433
📉 Pivotal Floor – 3272
📈 Resistance / Next Upside Objective – 3866 (on confirmed close and EMA5 lock above 3776)
As always, we will keep you all updated with regular updates throughout the week and how we manage the active ideas and setups. Thank you all for your likes, comments and follows, we really appreciate it!
Mr Gold
GoldViewFX
GOLD WEEKLY CHART MID/LONG TERM ROUTE MAPWeekly Chart Update – Follow Up
3732 Hit & Closed Above, 3806 Gap Opens
Previously we saw 3659 tested again with a weekly candle body close above the level, officially opening and completing 3732 last week.
Now, we’re closing above 3732, which leaves a long-range gap open at 3806 for the week ahead. This sets the stage for continued bullish progression but with correction risks still in play.
We must also keep in mind the possibility of a detachment correction back to 3659. Should momentum pick up during any such pullback, the channel top could align with the 3576 Goldturn to provide an additional zone of support and a potential springboard for continuation higher.
Current Outlook
🔹 3659 Retest & Close Above
Weekly close above 3659 confirmed strength and cleared the path higher.
🔹 3732 Objective Achieved
Target reached precisely after last week’s breakout, validating the continuation sequence.
🔹 3806 Range Gap Active
With a close above 3732, focus now shifts toward 3806 as the next upside range expansion.
🔹 Correctional Supports – 3659 & 3576
Detachment below highlights correctional risk. Both 3659 and 3576 (Goldturn) provide critical support zones, with the channel top acting as a confluence level for potential bounce.
Updated Levels to Watch
📉 Supports – 3659 & 3576 (correctional zones), deeper floor at 3482
📈 Resistance / Next Upside Objective – 3806
Plan
The bullish structure remains intact with upside potential toward 3806. A healthy correction into support zones (3659 / 3576) would help reset momentum while preserving the overall trend.
As always, staying flexible with structure and levels will be key heading into the week ahead.
Mr Gold
GoldViewFX

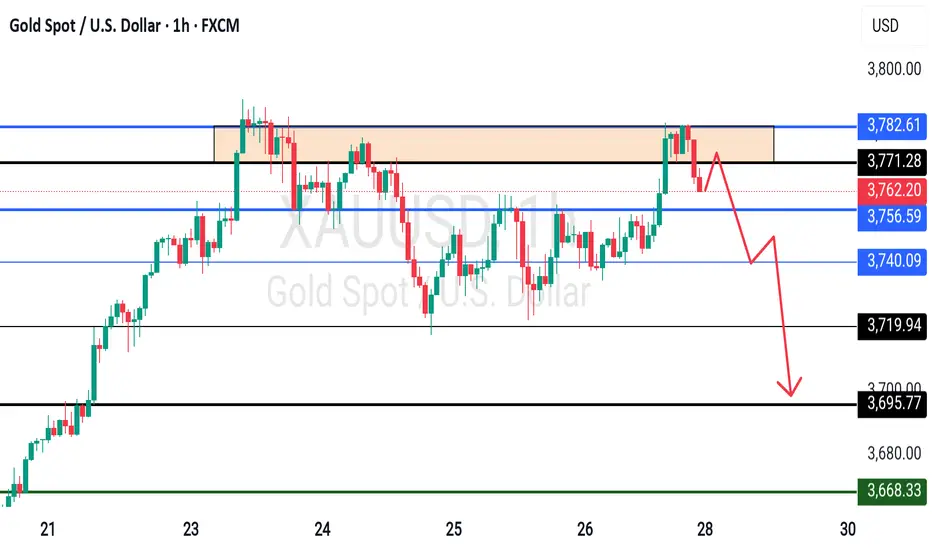
Gold XAUUSD Weekly Analysis 28 Sept to 2 Oct 2025Gold is currently trading at a decisive level where the weekly structure is hinting at a potential shift. After a strong bullish run, price tested the 3785–3800 zone but failed to sustain, forming a double top/M pattern and rejecting strongly from this supply area. The rejection has now pushed gold back into the crucial support zone of 3725–3733, which is a make-or-break level for the next swing move. If this support holds firm and we get a strong H4 close above it, buyers could regain momentum, opening the door for a bullish continuation towards 3780–3800, where the previous rejection zone lies. This would keep the broader bullish structure intact. On the flip side, if the market fails to hold this level and breaks below 3725 decisively, we can expect further downside towards the next demand zone at 3650–3660, which served as an earlier accumulation area. Overall, swing traders should treat 3725/33 as the key inflection point: above it, gold looks poised to retest the highs, while a breakdown could trigger a deeper correction into lower support levels.

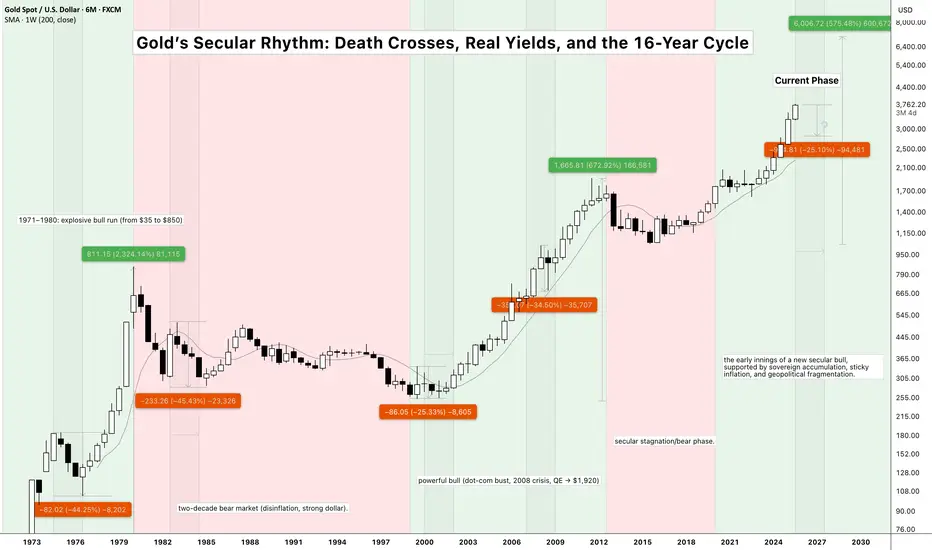
Gold’s Hidden Trigger: Why the Death Cross Matters CAPITALCOM:GOLD Hidden Trigger: Why Death Crosses Still Matter in a Secular Bull
Historically, when U.S. interest rates ECONOMICS:USINTR cross below the unemployment rate ECONOMICS:USUR - a kind of macro “death cross” - gold has often suffered sharp corrections even within a secular bull. We saw this in 1974–76, 1980–82, and 2008, where liquidity stress forced gold lower before the long‑term uptrend resumed. It’s a reminder that even in a secular bull, secondary corrections can be brutal when macro conditions tighten.
The difference today is the sovereign bid. Since 2022, central banks have been buying over 1,000 tonnes annually, creating a structural floor that didn’t exist in past cycles. Any weakness is likely to be bought aggressively, producing a V‑shaped recovery rather than a drawn‑out bear market.
Meanwhile, the 10‑Year Real Interest Rate is hovering around 1.5–1.7%, still artificially high. History shows that when real yields inevitably turn negative (likely by 2026), gold tends to explode higher regardless of crisis timing.
Layer this onto the 16‑year secular cycle thesis and the central bank accumulation story, and the setup is compelling: gold may still face sharp but temporary corrections, yet the long‑term trajectory remains firmly higher. The key question is whether sovereign demand can fully absorb potential Western ETF liquidation during the next bout of financial stress.
Disclaimer: This analysis is for educational purposes only and should not be considered financial advice. Past performance does not guarantee future results. Always conduct your own research and consult with financial professionals before making investment decisions.
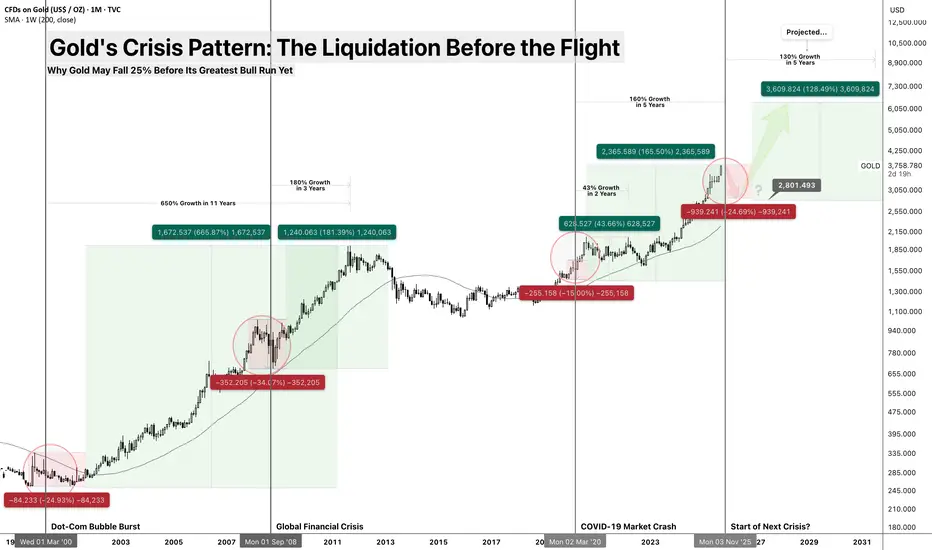
Gold's Crisis Pattern: The Liquidation Before the Flight TVC:GOLD Crisis Pattern: The Liquidation Before the Flight
Why Gold May Fall 25% Before Its Greatest Bull Run Yet
While everyone expects gold to rally during the next crisis, history suggests something different: gold gets sold first, bought later. At $3,790, FX:XAUUSD may be setting up for its most painful - and ultimately profitable - cycle yet.
Think of TVC:GOLD like a life preserver on a sinking ship. When panic first strikes, people throw everything overboard to stay afloat - even their life preservers. Only when they're drowning do they realize what they really need.
The Crisis Liquidation Pattern
2000 Dot-Com Crisis:
Pre-crisis peak: $326
Initial drop: -21%
Crisis bottom: $255
Ultimate recovery: +650% over 11 years
2008 Financial Crisis:
Pre-crisis peak: $1,033
Initial drop: -34%
Crisis bottom: $680
Ultimate recovery: +180% over 3 years
2020 COVID Pandemic:
Pre-pandemic peak: $1,696
Initial drop: -15%
Bottom-to-recovery: +43% over 2 years, +160% over 5 years
Key Distinction: Some will point to 2020, when TVC:GOLD rallied during the COVID crash. But that was a unique exogenous shock - the selloff lasted only weeks before unprecedented stimulus and collapsing real yields drove gold to new highs. In contrast, financial-system crises like 2000 and 2008 forced TVC:GOLD into year-long corrections before its hedge role reasserted. The 2025 setup looks far closer to those financial crises than to 2020's pandemic shock.
2025 Projection:
Current peak: $3,790 (I think top already - might be wrong ) ✓
Expected initial drop: -20 to -25%
Target bottom: $2,800-3,000
Long-term recovery target: $6,500+ by 2030
Why VELOCITY:GOLD Falls During Liquidity Crises?
The Margin Call Cascade
When leveraged positions blow up, investors sell what they can, not what they want to. TVC:GOLD , being liquid and unencumbered, becomes emergency cash.
The Three-Phase Liquidation:
Phase 1: "This is just a correction" - Hold everything
Phase 2: "I need cash now" - Sell winners (including gold)
Phase 3: "The system is broken" - Buy gold as currency hedge
Think of it like a house fire: you don't grab the fire extinguisher first, you grab your wallet. Only after you're safe do you wish you'd saved the fire extinguisher.
What Makes 2025 Different?
Unprecedented Starting Point
CAPITALCOM:GOLD at all-time highs vs. GDP ✓
Central bank buying at record levels
Retail ownership through ETFs at maximum
More holders means more potential sellers
The AI Deflation/Monetary Inflation Paradox
AI driving productivity gains (deflationary)
Debt levels requiring monetary expansion (inflationary)
Gold benefits from the monetary side, but falls in initial deflationary shock
Geopolitical MCX:GOLD1! Demand vs. Financial Selling
Central banks want VELOCITY:GOLD for de-dollarization
But financial stress forces private selling first
Result: Temporary oversupply before structural shortage
The Crisis Timeline for Gold
Stage 1: The Setup (Now - Q4 2025)
CMCMARKETS:GOLDZ2025 Price Action: Sideways to slight decline
Strong dollar pressure
Real yields rising with Fed cuts
Still viewed as "risk asset" by algorithms
Target Range: $3,400-3,600
Stage 2: The Liquidation (Q4 2025 - Q2 2026) TVC:GOLD Action: Sharp 20-25% decline
Forced selling from leveraged funds
ETF redemptions as retail panics
Dollar TVC:DXY strength peaks
Target Bottom: $2,800-3,000
Stage 3: The Recognition (Q2 2026 - Beyond) TVC:GOLD Action: New bull market begins
Currency debasement fears return
Physical shortage becomes apparent
Central bank buying accelerates
Ultimate Target: $6,500+ by 2030
Key Indicators to Watch
Immediate Danger Signals:
TVC:GOLDSILVER ratio above 90(April 2025 100+) (currently 84 - expect further decline) ✓
Dollar Index TVC:DXY climbs higher towards 110
TVC:US10Y 10-year real yields above 4% (currently 4.17%)✓
Crisis Confirmation:
TVC:GOLD falls below $3,200 on volume
Mining stocks crash 40%+
Central bank buying announcements increase
Physical premiums start expanding
Recovery Signals:
Dollar TVC:DXY weakening below 105
Fed pivots to QE
Inflation expectations rising
TVC:GOLDSILVER Gold/Silver ratio normalizing
The Bigger Picture: Why This Sets Up Gold's Greatest Run
Structural Drivers Post-Crisis:
Debt Monetization: $30+ trillion deficits requiring QE
Currency Competition: Digital currencies vs. physical gold
Supply Constraints: Peak gold production reached
Generational Shift: Millennials discovering gold after getting burned in "everything bubble"
Historical Precedent:
After every major financial crisis, gold enters its strongest bull market:
Post-1971: +2,300% over 9 years
Post-1999: +650% over 11 years
Post-2008: +180% over 3 years
Post-2025: Targeting +150-200% over 5-7 years
Risk Management
This Analysis Fails If:
Fed pivots to massive QE immediately (before crisis)
Fiscal stimulus exceeds $3 trillion rapidly
Dollar collapses before financial crisis hits
War/geopolitical crisis becomes primary driver
Probability Assessment:
65%: VELOCITY:GOLD falls to $2,800-3,200 range before rallying
25%: TVC:GOLD holds above $3,400 and rallies immediately
10%: CMCMARKETS:GOLDZ2025 crashes below $2,500 in systemic crisis
Conclusion: The Pain Before the Gain
TVC:GOLD 's crisis pattern is counterintuitive but consistent: liquidation before allocation. The coming correction may be the last chance to accumulate gold before its transition from investment to monetary asset.
Like Warren Buffett said: "Be greedy when others are fearful." When gold is getting panic-sold alongside everything else, that's when the foundation for the next great bull market gets built.
The fire sale is coming. Are you prepared to buy?
Disclaimer: This analysis is for educational purposes only and should not be considered financial advice. Past performance does not guarantee future results. Always conduct your own research and consult with financial professionals before making investment decisions.
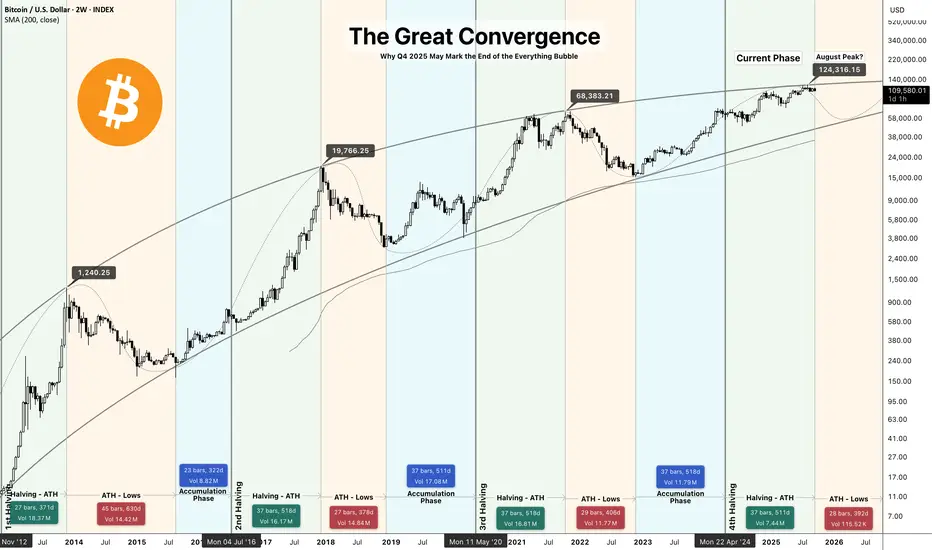
The Great Convergence: End of the Everything BubbleThe Great Convergence: Why Q4 2025 May Mark the End of the Everything Bubble
A Multi-Asset Analysis of Bitcoin, S&P 500, and Gold at Critical Junctures
Hello Traders, After analyzing 25 years of market data across three major financial crises, I've identified a dangerous convergence of signals suggesting we're approaching a significant market inflection point. The simultaneous peaks in IG:BITCOIN (~$124K), SP:SPX (6,700), and TVC:GOLD ($3,790) combined with deteriorating macroeconomic indicators mirror patterns that preceded both the 2000 and 2008 crises.
Key Thesis: We are potentially entering a liquidity crisis that could result in a 30-50% correction across risk assets by Q4 2026.
Part I: The Bitcoin Halving Cycle - End of the Fourth Epoch
Historical Pattern Recognition
CRYPTO:BTCUSD price action has followed a remarkably consistent 4-year cycle tied to its halving events:
2012 Halving → 2013 Peak (1 year delay): +8,000% rise, -85% crash
2016 Halving → 2017 Peak (1.5 years delay): +2,800% rise, -84% crash
2020 Halving → 2021 Peak (1.5 years delay): +700% rise, -77% crash
2024 Halving → 2025 Peak (1.5 years delay): +450% rise, -75% crash projected
Current Technical Indicators
RSI Divergence: Weekly RSI showing lower highs while price makes higher highs - classic exhaustion signal present at 2013, 2021 previous cycle tops.
Volume Profile: Declining volume on recent rallies indicates weakening conviction
On-chain Metrics: Long-term holder distribution accelerating, similar to previous cycle tops
Price Targets
Current Level: $109,498
Proposed Peak: $124,000 (By halving cycle theory this was fulfilled last month August)
Initial Support: $69,000 (previous cycle ATH)
Crisis Target: $25,000-30,000 (75% drawdown from peak by Q6 2026)
Part II: The Macro Crisis Trigger - SPX SP:SPX / Unemployment Rate ECONOMICS:USUR / Fed Rate Correlation ECONOMICS:USINTR
The Historical Precedent
Every major crisis follows a predictable sequence:
2000 Dot-Com Bubble:
CBOE:SPX at ATH (1,550) ✓
Unemployment begins rising from 3.9% ✓
Fed initiates rate cuts ✓
→ 49% crash over 2.5 years
2008 Financial Crisis:
TVC:SPX at ATH (1,576) ✓
Unemployment rises from 4.4% ✓
Fed cuts rates aggressively ✓
→ 57% crash over 1.5 years
2025 AI/Everything Bubble:
TVC:SPX at ATH (6,700) ✓
Unemployment rising from 3.4% ✓
Fed just initiated cuts (Sept 2025) ✓
→ Projected 35-45% correction over 1.5 years
The Unemployment-Rate Cut Death Cross
Since 1970, whenever the Fed has cut rates while unemployment is rising from cycle lows:
12/12 times resulted in recession within 12 months
Average equity drawdown: 35%
Average duration: 18 months
Current Labor Market Dynamics - The AI Disruption Factor
Unlike previous cycles, we face structural unemployment pressure from AI adoption:
Customer service: 2M jobs at risk
Software development: 500K jobs transitioning
Logistics/Transport: 3M jobs being automated
Administrative: 4M jobs under pressure
This isn't temporary cyclical unemployment - it's structural displacement requiring economic reorganization.
Part III: Gold's Crisis Pattern - The Liquidation Before the Flight
Historical TVC:GOLD Behavior in Crisis
Contrary to popular belief, FX:XAUUSD can and does suffer fast flushes during systemic liquidity panics despite its long-term hedge role; with gold near ATH, combined liquidity and profit-taking risk could produce a 15–25% correction ahead of any later safe-haven rally:
2000 Crisis:
Pre-crisis peak: $326
Initial drop: -21%
Bottom-to-recovery: +650% over 11 years
2008 Crisis:
Pre-crisis peak: $1,033
Initial drop: -34%
Bottom-to-recovery: +180% over 3 years
Covid-19 Pandemic:
Pre-pandemic peak: $1,696
Initial drop: -15%
Bottom-to-recovery: +43% over 2 years and 160% over 5 years
Some will point to 2020, when gold rallied during the COVID crash. But that was a unique exogenous shock: the selloff lasted only weeks before unprecedented stimulus and collapsing real yields drove gold to new highs. In contrast, financial‑system crises like 2000 and 2008 forced gold into a year‑long correction before its hedge role reasserted. The 2025 setup looks far closer to those financial crises than to 2020’s pandemic shock.
2025 Projection:
Current peak: $3,790
Expected initial drop: -20 to -25%
Target bottom: $3,000-$2,800
Long-term recovery target: $6,500+ by 2030
Why Gold Falls Initially
During liquidity crises, investors sell everything to meet margin calls and raise cash - even safe havens. Only after the acute phase does gold fulfill its hedge role.
Part IV: The Convergence - Why This Time Is Particularly Dangerous
Unique Risk Factors in 2025
1. Unprecedented Valuations Across All Assets
Total global asset values: $450 trillion (4.5x global GDP)
Buffett Indicator: 195% (highest ever)
Shiller CAPE: 38 (higher than 1929)
2. Leverage and Derivatives
Total derivatives notional: $700 trillion
Margin debt: $935 billion (record high)
Corporate debt/GDP: 85% (record high)
3. Geopolitical Tensions
Active conflicts affecting supply chains
De-dollarization accelerating
Energy market fragmentation
4. Cryptocurrency Systemic Risk
$2.5 trillion COINBASE:BTCUSD and over $4T gross crypto CRYPTOCAP:TOTAL asset class that didn't exist in 2008
Interconnected with traditional finance via ETFs
Untested in true liquidity crisis
Part V: The Three-Stage Crisis Model
Stage 1: The Warning Shot (Now - Q4 2025)
Timeline: Next 1-3 months
Characteristics:
Deteriorating breadth (fewer stocks making highs)
Defensive rotation begins
TVC:VIX creeping higher
First 10% correction dismissed as "healthy"
Stage 2: The Liquidity Cascade (Q4 2025 - Q2 2026)
Timeline: 6-9 months
Characteristics:
Multiple failed rallies
"Buy the dip" mentality breaks
Margin calls cascade
All correlations go to 1
Targets:
TVC:SPX : 5,000-5,500
CRYPTO:BTCUSD : $50,000-70,000
TVC:GOLD : $2,200-2,400
Stage 3: Capitulation and Reset (Q2 2026 - Q4 2026)
Timeline: 6-12 months
Characteristics:
Forced selling exhaustion
Government intervention
Market clearing prices reached
Final Targets:
TVC:SPX : 3,700-4,500
CRYPTO:BTCUSD : $25,000-35,000
TVC:GOLD : Begins new bull market from $2,800
My Risk Management Framework
Position Sizing
Current Risk Asset Exposure: Reduce to 30% of portfolio
Cash: 50%
Precious Metals (Physical): 10%
Strategic Shorts: 10% (via puts and/or inverse ETFs)
Key Indicators to Monitor
Weekly Unemployment Claims: ECONOMICS:USUR Sustained moves above 250K
Credit Spreads: HYG/TLT ratio breaking below 4.5
Dollar Strength: TVC:DXY above 110 signals global stress
IG:BITCOIN Dominance: Below 45% indicates alt-coin capitulation
TVC:VIX Term Structure: Inversion signals immediate stress
Invalidation Scenarios
This bearish thesis would be invalidated if:
Unemployment reverses below 4%
Fed pivots to QE without crisis
Fiscal stimulus exceeds $2 trillion
AI productivity gains offset job losses faster than expected
Conclusion: Probability-Weighted Scenarios
Based on historical precedent and current conditions, I assign the following probabilities:
60% Probability: Significant correction (20-30% drawdown) beginning Q4 2025
25% Probability: Major crisis (40-50% drawdown) rivaling 2008
15% Probability: Continued melt-up through 2026 (Fed intervention success)
The risk/reward severely favors defensive positioning. After a 15-year bull market across all assets, the convergence of deteriorating fundamentals, extreme valuations, and historical crisis patterns suggests we're approaching a critical inflection point.
Remember: Markets can remain irrational longer than you can remain solvent. This analysis presents probabilities , not certainties. Always manage risk appropriately and never invest more than you can afford to lose.
Disclaimer: This analysis is for educational purposes only and should not be considered financial advice. Past performance does not guarantee future results. Always conduct your own research and consult with financial professionals before making investment decisions.
Follow for updates as this thesis develops. Key milestones to watch:
October NFP report
November FOMC meeting
Q4 earnings season
Year-end positioning
Gold Trade Setup - 27/Sep/2025Hi Traders,
I am biased for further upside in Gold.
The first trade that I will be looking for is from the highlighted zone and the price is already testing it.
If price corrects here , then I will expect it to drop further to the next marked POI.
Please follow me and like if you agree or this idea helps you out in your trading plan.
Disclaimer : This is just an idea. Please do your own analysis before opening a position. Always use SL & proper risk management.
Market can evolve anytime, hence, always do your analysis and learn trade management before following any idea.

Reaching the High Point. Price Retracement?After a period of consolidation this week, gold surged upwards, reaching a new all-time high near $3791. However, following the retracement on Wednesday, the upward momentum weakened. On Friday, during the US session, gold briefly touched $3783 before retracing, closing near $3759. It remains above the moving average, suggesting a potential second wave of upward movement.
Overall, the market sentiment remains bullish, and a series of bullish patterns suggest that gold may continue its upward trend next week. The Friday pullback could be seen as a consolidation by the bulls. The resistance level around $3770, where the previous high and low were formed, will be an important short-term resistance level.
If the Asian market opens at 3770 under downward pressure on Monday, it is very likely to break down again in the later period, and the low point of 3717 generated last week may also be broken.
The current unilateral trend is not clear. Try to short near 3770 when the Asian market opens next Monday. Focus on the profit range near 3730 and set a stop loss at 3780. If there is no sign of decline in the European session, adjust the strategy in time in the US session.

XAUUSD H1 OUTLOOK FOR NEXT WEEKI’ve Setup My Sniper Shot For A Sell From The Premium IFVG
Who’s With Me ?
Selling on IFVG And FVG Zones
Target Is Sell Side Liquidity
Good Luck Guys

XAUUSD H1 OUTLOOK I’ve Setup My Sniper Shot For A Sell From The Premium IFVG
Who’s With Me ?
Selling on IFVG And FVG Zones
Target Is Sell Side Liquidity
Good Luck Guys

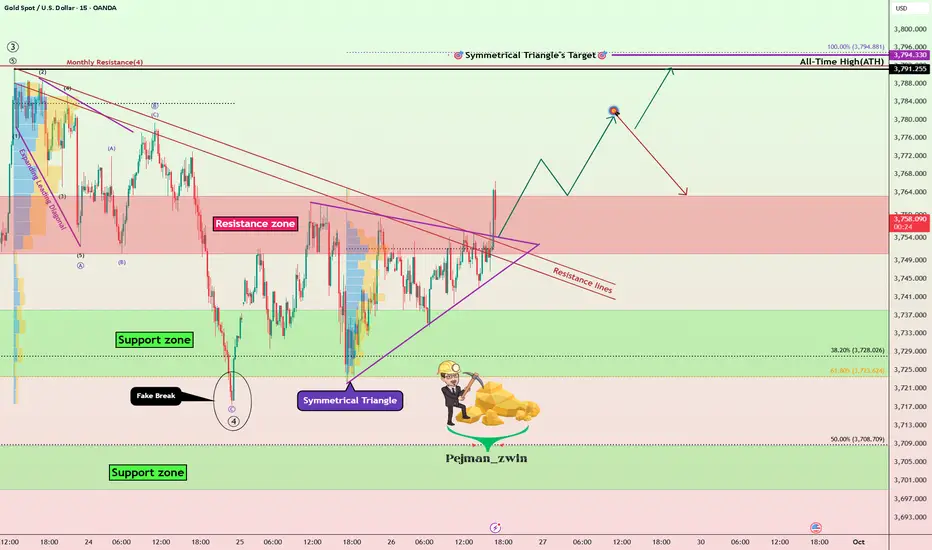
Gold Roadmap: Breakout Confirmed –New ATH or Another Correction?Gold ( OANDA:XAUUSD ) as I expected in the previous idea (Short and Long positions hit the target).
First of all, I should say that this analysis is for the short term and on a 15-minute time frame.
Gold seems to have managed to break the Resistance lines, Resistance zone($3,763-$3,750), and the upper line of the symmetrical triangle in the past few minutes.
I expect Gold to rise to at least $3,779, and then there are two scenarios for Gold: creating a new All-Time High, OR re-correcting.
Stop Loss(SL): $3,741.7
Please respect each other's ideas and express them politely if you agree or disagree.
Gold Analyze (XAUUSD), 15-minute time frame.
Be sure to follow the updated ideas.
Do not forget to put a Stop loss for your positions (For every position you want to open).
Please follow your strategy; this is just my idea, and I will gladly see your ideas in this post.
Please do not forget the ✅ ' like ' ✅ button 🙏😊 & Share it with your friends; thanks, and Trade safe.
Back to 4H Frame – Fed & Inflation Shape Gold PathGold on the 4H timeframe is consolidating near premium supply after multiple liquidity sweeps. Recent U.S. inflation data kept the dollar resilient, while traders anticipate upcoming Fed commentary for clearer policy direction. Price rejected from the 3,795 supply pocket and is now retracing toward discount demand zones. Market structure suggests engineered sweeps below support before bullish continuation into Q4.
________________________________________
📌 Key Structure & Liquidity Zones (4H):
• 🔼 Buy Zone 3,692 – 3,694 (SL 3,685): Discount demand aligned with liquidity grab, ideal for continuation longs.
• 🔽 Sell Zone 3,795 – 3,797 (SL 3,804): Premium supply pocket where liquidity sweeps may trigger short-term rejections.
________________________________________
📊 Trading Ideas (Scenario-Based):
🔺 Buy Setup – Discount Demand Reaction
• Entry: 3,692 – 3,694
• Stop Loss: 3,685
• Take Profits:
TP1: 3,715
TP2: 3,740
TP3: 3,760+
👉 Smart money may engineer a sweep below 3,694 before reversing higher. Watch for bullish rejection patterns at demand.
🔻 Sell Setup – Premium Supply Reaction
• Entry: 3,795 – 3,797
• Stop Loss: 3,804
• Take Profits:
TP1: 3,780
TP2: 3,765
TP3: 3,750
👉 Short-term liquidity scalp opportunity against trend. Valid if price fails to break above breakout point.
________________________________________
🔑 Strategy Note
Bias remains bullish medium-term, but intraday sweeps into demand zones are expected as Fed officials continue to push cautious monetary guidance. Liquidity hunts around 3,795 supply and 3,694 demand will likely define the week’s volatility before a decisive breakout.

Silver buy above 137520 tgt 139621 intrday stop loss ??Silver buy above 137520 tgt 139621 intrday stop loss 137330
Silver buy above 137520 tgt 139621 intrday stop loss 137330
Silver buy above 137520 tgt 139621 intrday stop loss 137330
Silver buy above 137520 tgt 139621 intrday stop loss 137330
Silver buy above 137520 tgt 139621 intrday stop loss 137330
Silver buy above 137520 tgt 139621 intrday stop loss 137330Silver buy above 137520 tgt 139621 intrday stop loss 137330Silver buy above 137520 tgt 139621 intrday stop loss 137330Silver buy above 137520 tgt 139621 intrday stop loss 137330Silver buy above 137520 tgt 139621 intrday stop loss 137330Silver buy above 137520 tgt 139621 intrday stop loss 137330Silver buy above 137520 tgt 139621 intrday stop loss 137330Silver buy above 137520 tgt 139621 intrday stop loss 137330Silver buy above 137520 tgt 139621 intrday stop loss 137330Silver buy above 137520 tgt 139621 intrday stop loss 137330

XAUUSD Delivered Excellent profits Thanks to those who followed, trusted me, and made profits 210 pips delivered
As I mentioned in today’s commentary session:
• I took buy trades if H4 candle closes above 3760., and I’m expecting the market to test the 3785 benchmark with an extension towards 3830.
My strategy was to buy the dips, and I’m very happy with the profits so far – .
My first target (3782) is achieved, Alhamdulillah.
