Bullish momentum strengthens. Trend change?Gold remained volatile before the release of the PCE data, touching around $3761 before retracing to around $3722, consistent with short-term range-bound trading. Recent significant price gains and continuous new highs have boosted bullish sentiment in the market.
However, these continuous new highs have also instilled fear and caution among many traders. Each pullback has served to build momentum for further upward breakouts. With these new highs, short-term bullish sentiment has rebounded.
Looking at the 1-hour chart, the moving average system is running upward. The early price correction touched the lower track of the Bollinger band, and then rebounded to maintain volatility. After the PCE data release, bullish momentum surged, pushing the price sharply higher, currently trading near the upper Bollinger Band. Indicators suggest that bullish strength is gradually recovering.
On the last trading day of this week, the market is likely to maintain a high-level fluctuation trend, but be wary of sudden black swan events. If the price retraces to around $3740, Quaid recommends establishing a long position at that level and waiting for a rebound.
Goldprediction

Traders Watch Gold Surge Ahead of Fed’s Next MoveGold 1H – Consolidation Before Fed Clarity
Gold on the 1H timeframe is currently trading around 3,746, moving within a well-defined consolidation range. Price action highlights a premium supply zone at 3,775–3,773 and a discount demand zone at 3,723–3,725. The market structure shows earlier signs of BOS and ChoCH, with engineered liquidity sweeps becoming evident. A potential Mitigation → Expansion sequence is in play, where a liquidity grab near discount demand could fuel a bullish leg toward premium supply.
From a macro perspective, today’s headlines underscore the cautious stance across financial markets as investors await the Federal Reserve’s upcoming guidance. Lingering inflationary concerns, coupled with speculation around the timing of future rate cuts, have kept volatility elevated. Meanwhile, geopolitical risks continue to underpin safe-haven demand for gold, adding an extra layer of support at discount levels.
This combination of technical liquidity zones and macro uncertainty sets the stage for tactical plays: fading moves into the supply zone while remaining prepared for dip-buying opportunities at defined demand areas.
________________________________________
📌 Key Structure & Liquidity Zones (1H):
• 🔴 SELL GOLD 3,775–3,773 (SL 3,782): Supply zone coinciding with a buy-side liquidity pool above 3,780, offering downside targets at 3,760 → 3,745 → 3,730.
• 🟢 BUY GOLD 3,723–3,725 (SL 3,718): Discount demand aligned with liquidity grab potential, with upside targets at 3,745 → 3,760 → 3,775+.
________________________________________
📊 Trading Ideas (Scenario-Based):
🔻 Sell Setup – Supply Rejection (3,775–3,773)
• Entry: 3,775–3,773
• Stop Loss: 3,782
• Take Profits:
TP1: 3,760
TP2: 3,745
TP3: 3,730
🔺 Buy Setup – Demand Mitigation (3,723–3,725)
• Entry: 3,723–3,725
• Stop Loss: 3,718
• Take Profits:
TP1: 3,745
TP2: 3,760
TP3: 3,775+
________________________________________
🔑 Strategy Note
With the Fed’s next move looming, traders should anticipate engineered sweeps into both premium and discount liquidity pools before the market establishes clearer direction. The tactical edge comes from aligning intraday setups with liquidity hunts:
• Fade supply at 3,775–3,773 if rejection confirms.
• Buy dips into 3,723–3,725 if liquidity is swept cleanly.
The broader narrative of inflation concerns, dollar sensitivity, and safe-haven flows reinforces the case for two-sided opportunities. Expect gold to remain volatile within this consolidation range, with sharp moves likely as liquidity is targeted ahead of Fed clarity.

GOLD DAILY CHART ROUTE MAP UPDATEDaily Chart Update
3776 Target Achieved!!
A beautifully strong finish to the week, with our 1H and 4H chart ideas playing out, and now the daily chart projection completing perfectly.
Last week, we highlighted the importance of a candle body close above 3683, which opened the gap toward 3776. That target has now been hit with precision today – an awesome way to close the sequence.
With 3776 now achieved, the key focus shifts to the daily close:
A sustained close above this level would open the higher range above, confirming continued bullish strength.
A rejection here, however, would put support levels back into play at 3683 and the channel top.
Current Outlook
🔹 3683 Target Reached
Our breakout sequence played out with precision, starting from the EMA5 lock above 3564 and extending to complete the 3683 objective.
🔹 3776 Target Completed
Today’s price action delivered the full upside completion into 3776. Now, the daily close will decide whether the breakout extends further into new ranges.
🔹 Key Inflection – 3776
Close above = breakout range expansion.
Rejection = retest of 3683 and channel top support.
Updated Key Levels
📉 Support – 3683 & Channel Top
📉 Deeper Support – 3564 & 3433
📉 Pivotal Floor – 3272
📈 Resistance / Next Upside Objective – Sustained break above 3776 opens the range higher
🔥 What’s Next?
We’ll be back on Sunday with a fresh Daily chart idea, updated targets, and a full multi-timeframe analysis to guide the next leg of the journey. Stay tuned – momentum is only heating up from here!
Thank you for the continued support, and congratulations to everyone who rode this move with us.
Mr Gold
GoldViewFX

1 hour TF Gold Level -DroidTradingWait for Strong Resistance Breakout 3765-70
Strong Buying 3710-15, if Tapped, Also Entry if Retest On Trendline.
Keep SL ,Book your Daily Target
Comment on our Analysis

Gold PCE data follows the trend
News:
Powell's speech was rather conservative, exacerbating the market's cautious sentiment, and the easing of geopolitical situation suppressed the demand for safe-haven assets, which led to the resistance of gold's rise and the adjustment of high-level fluctuations. However, the expectation of further interest rate cuts by the Federal Reserve provided important bottom support for gold prices, which limited the short-term decline space and created opportunities for bargain hunting. In terms of operations, we suggest that everyone pay attention to the support at $3,740, followed by $3,730, and the upper pressure at $3,780, followed by $3,800.
Specifically:
During Thursday's European session, gold rebounded to $3,760 before encountering resistance and falling in a volatile manner. After the US market opened, gold continued its decline, falling to a low of $3,720. After stabilizing, it rebounded and rebounded, reaching $3,758 before encountering resistance.
At the opening of Friday's session, gold fell back to $3,735 before stabilizing. It rebounded to $3,750 before encountering resistance and is currently trading at $3,750. Overall, despite the resistance to gold's rebound, its short-term decline is limited, and gold prices continue to fluctuate and consolidate at a high level.
On the daily chart, gold has stabilized above $3,700, maintaining a high and volatile range. For downward support, consider the lower limit of the 4-hour Bollinger Band at $3,720, which is also near the low point of gold's decline on Wednesday and Thursday. Secondly, consider the $3,700 level. If gold prices hold steady here, there's still a chance for further gains. For upward pressure, consider Thursday's rebound high of $3,760, followed by Wednesday's rebound high of $3,780.
The 5-day moving average maintains an upward golden cross, but the MACD indicator has slightly crossed downward, and the KDJ and RSI indicators have formed a small bearish cross. Short-term technical indicators suggest that gold needs a correction after its continuous rise.
Strategy:
Long Position3740-3750,SL:3725,Target:3780-3800

Gold – Technical Outlook
Gold – Technical Outlook
🔴 Bearish Scenario (Downtrend)
* Pivot Level: 3759
* If price trades below 3759, continuation to the downside is expected.
* 🎯 First target: 3736 (strong support)
* If 3736 breaks → full bearish extension towards:
* 🎯 Next target: 3720
🟢 **Bullish Scenario (Uptrend)**
* If price breaks and holds above 3759, upside momentum will strengthen.
* 🎯 First target: 3770 (resistance)
* If 3770 breaks and holds on the 1H or 4H timeframe → strong bullish continuation towards:
* 🎯 Next target: 3791
---
📌 Note: At 3:30PM, a key market event may create high volatility in gold, potentially pushing price sharply depending on the reaction.

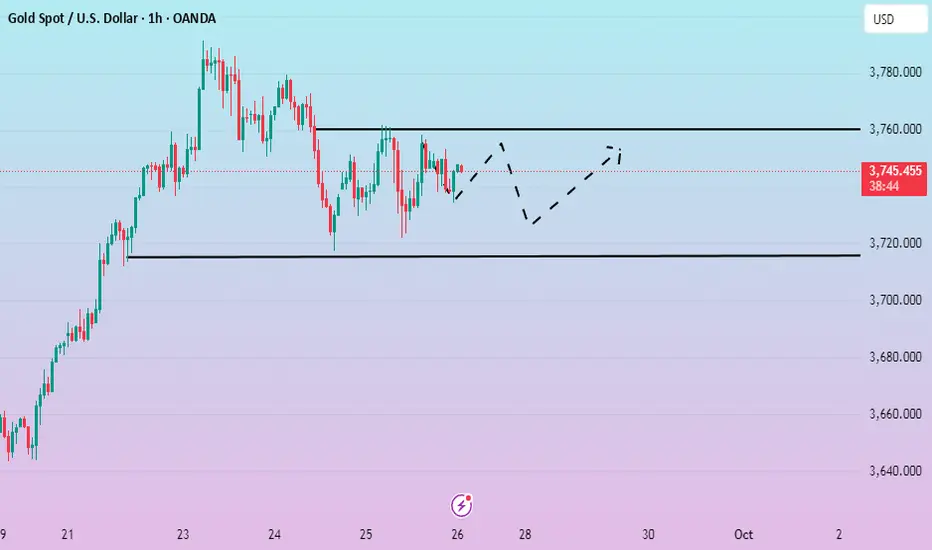
XAUUSD on range aiming 3930 on mark!!XAUUSD in Accumulation zone 3730-3760 area.
My stance on XAUUSD?
-First point of buying will be 3730-3725 area , H1 -H4 candle closes above it , my target will be 3785.
- Secondly if H4 candle closes above 3760 then I will took buy as well and target Target will be 3830.
Additional Tip :
On the otherhand, the 3690–3700 supply zone is the perfect buyying opportunity aiming target 3830.
On long term I'm watching gold at 3930!!

Gold Trade SetupI will risk!!!
It seems we are near at the end of correction wave...
The first target R/R is 2 and the second is 4...

Bullish Pennant in Gold* Gold is showing off a Bullish Pennant on the 4H chart – a classic continuation pattern formed after a strong rally (the flagpole).
* That means, after a short consolidation, Gold could be gearing up for another breakout toward new all-time highs
- For me, it's the "calm before the next storm" – and if the pattern successfully carries out, then we may see bulls pushing prices above $3,791+.
Keep an eye on the breakout zone, currently testing by gold – the next move could be BIG
What is a Bullish Pennant?
It’s a continuation pattern that forms after a sharp upward move (the “flagpole”). Price then consolidates in a small triangle-like structure (the “pennant”), before often breaking out higher.
Gold recently rallied nearly $180 (from $3,610 to $3,790) before pausing into a pennant-shaped consolidation on the 4H chart.
Why it matters here?
The flagpole in Gold is approx. $180.
If the pattern breaks above $3,791–$3,800, the typical projection is another $150–$180 upside.
That sets a potential target around $3,950–$3,980.
Note: While this is a textbook pattern, breakouts are not guaranteed. Traders watch for confirmation with volume and momentum indicators.

XAU/USD 26 September 2025 Intraday AnalysisH4 Analysis:
-> Swing: Bullish.
-> Internal: Bullish.
Analysis and bias remains the same as analysis dated 24 September 2025.
As mentioned in analysis dated 04 September 2025, with respect to alternative scenario, price could potentially continue higher, is how price printed, price continued its bullish trajectory printing all-time-highs. This is continuing.
As per my analysis of yesterday, dated 22 September 2025, whereby I mentioned price could potentially continue to print higher-highs. This is how price printed, showing little to no signs of pullback phase initiation.
Price is currently trading within an internal low and fractal high. CHoCH positioning is denoted with a horizontal blue dotted line.
Intraday Expectation:
Price to print bearish CHoCH to indicate bearish pullback phase initiation, price to then trade down to either discount of internal 50% EQ, or H4 supply zone before targeting weak internal high priced at 3,791,255.
Alternative scenario: Price could potentially print higher-highs.
Note:
The Federal Reserve’s sustained dovish stance, coupled with ongoing geopolitical uncertainties, is likely to prolong heightened volatility in the gold market. Given this elevated risk environment, traders should exercise caution and recalibrate risk management strategies to navigate potential price fluctuations effectively.
Additionally, gold pricing remains sensitive to broader macroeconomic developments, including policy decisions under President Trump. Shifts in geopolitical strategy and economic directives could further amplify uncertainty, contributing to market repricing dynamics.
H4 Chart:
M15 Analysis:
-> Swing: Bullish.
-> Internal: Bullish.
Analysis and bias remains the same as analysis dated 24 September 2025.
As per analysis and intraday expectation of previous analysis, price has printed a bearish CHoCH, which is the first indication, but not confirmation, of bearish pullback phase initiation
Price is currently trading within an internal low and internal high.
Intraday Expectation:
Price to trade down to either M15 supply zone, or discount of 50% EQ before targeting weak internal high priced at 3,791.255.
Alternative Scenario: Price could potentially continue to print higher.
Note:
Gold remains highly volatile amid the Federal Reserve's continued dovish stance, persistent and escalating geopolitical uncertainties. Traders should implement robust risk management strategies and remain vigilant, as price swings may become more pronounced in this elevated volatility environment.
Additionally, President Trump’s recent tariff announcements are expected to further amplify market turbulence, potentially triggering sharp price fluctuations and whipsaws.
M15 Chart:

XAUUSD || GOLD ANALYSIS BASED ON SMART MONEY ORDERS (REAL TIME )🤖 GOLD ANALYSIS What’s Moving the Market Today? (September 26, 2025)
🚀 Welcome to Trade with DECRYPTERS
We break the charts down into clean levels so you can spot where smart money is buying 🟢 and selling 🔴.
Keep it simple, stick to the plan, and let the levels guide your moves.
🟡 Gold Slips to $3,747 — Dollar’s Flexing Its Muscles!
A stronger US dollar and mixed economic signals are pushing gold prices down.
When the dollar gains, gold gets less attractive as it’s priced in dollars.
Investors are watching closely!
🏦 Fed Says “No Rush” on Rate Cuts — Gold Feels the Heat!
Strong US jobs data makes the Fed cautious about cutting rates soon.
Lower rates usually boost gold, so this hesitation is bad news for prices.
🌍 Middle East Tensions Flare — Gold’s Safe-Haven Glow Shines!
Rising conflicts and US-China trade worries make investors nervous, driving them to gold.
As a safe-haven asset, gold prices get a lift when global risks spike.
📊 Jobs Report Looms — Will Gold Get a Break?
Next week’s US jobs data could shake things up.
If the report shows weakness, it might spark hopes for rate cuts, pushing gold prices higher.
🚀 US Economy Roars at 2.8% — Gold’s Not Impressed!
Solid US GDP growth eases recession fears, making gold less appealing.
Strong economies often reduce demand for safe-haven assets like gold.
⚡ Trump’s Tariff Threats Stir Chaos — Gold Loves It!
Talk of new tariffs and global uncertainty keeps gold in demand.
Investors turn to gold as a hedge when trade wars heat up.
🏛️ Central Banks Hoard 900 Tonnes — Gold’s Got Backup!
Central banks are buying tons of gold to diversify reserves.
This steady demand supports higher gold prices over time.
⚡⚡So what we are Expecting .. ? ⚡⚡ Current Price around 3744.
🟢 Buy Zone (3717–3698)
Buyers waiting to load up.
3705 is the key bounce point 🔑.
🔴 Sell Zone (3777–3790)
Sellers may step in hard here.
Watch for a sharp push ⚡ into this zone before any drop.
📊 Todays possible Daily Range:-
High of the day: 3792 ⬆️
Low of the day: 3703 ⬇️
CONCLUSION :-
With today’s range between 3703–3792, price action near 3744 sits right in the middle.
Key levels: Buy Zone 3717–3698 (bounce at 3705) and Sell Zone 3777–3790.
Bias is slightly bullish 🟢, but confirmation will come only from reactions at these zones.

Waiting for the data to be released. Continue to fluctuate?Gold is experiencing a volatile downward trend. On the 4-hour chart, prices are currently under pressure at $3,765. The short-term rebound has completed its technical pattern repair, suggesting further downward movement. The 1-hour chart shows prices trading near short-term support, while the short-term moving average has flattened downward, indicating weakening short-term momentum. Focus on the resistance area around 3,750-3,755 in the short term, while support remains around 3,715.
Gold is currently experiencing small fluctuations. Quaid recommends maintaining trading within the 3,755-3,715 range pending the release of the PCE data.
New analysis and trading strategies will be provided after the data is released.
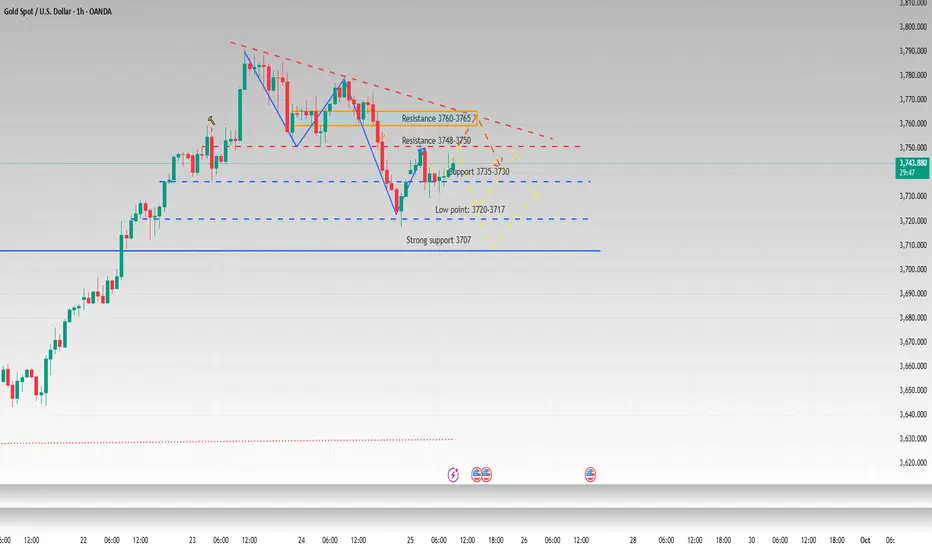
Gold - Sell near 3753, target 3740-3722Gold Market Analysis:
Yesterday, gold saw both buying and selling, and the market began a period of volatile correction, fluctuating up and down. This is a sign that markets can never rise continuously. When prices tire of rising, they need a break and a pause to recover. This is a normal technical correction after a significant surge. Today's strategy is for short-term volatility, with the broader trend bullish. The range of this correction is a bit unclear, so we can target the upper and lower highs of the 1-hour chart. The daily and weekly charts are closing today. Barring any major surprises, the weekly chart will close with a positive candlestick pattern. Next week, gold will continue to rise, and buying will continue to push prices higher. 3791 isn't the high point of this wave; a break above 3800 is just around the corner. The hourly chart shows gold forming a triangle consolidation pattern. Today, we'll focus on a breakout of this correction. The hourly correction range is 3722-3762. Until this range is broken, we'll maintain a short-term volatile trend. If it does, we can follow the trend. Once the volatility ends, there will undoubtedly be a significant move, whether it's a decline or a breakout. If the Asian session rebounds first, we'll consider selling near 3753.
Support at 3732 and 3722, strong support at 3717, resistance at 3753 and 3758, strong resistance at 3762, and the dividing line between strength and weakness at 3753.
Fundamental Analysis:
This week's fundamentals have limited impact on the market. The US dollar has also begun to fluctuate. The market awaits new data to drive it. The Federal Reserve's interest rate cuts in October remain a key focus.
Trading Recommendations:
Gold - Sell near 3753, target 3740-3722

Analysis of gold price intraday trend!Market News:
Spot gold fluctuated narrowly in early Asian trading on Friday (September 26), currently trading around $3,750/oz. Following the unexpected decline in US initial jobless claims last week, investors awaited key inflation data that could influence the Federal Reserve's next interest rate move. Following the release of the initial claims data, gold prices plummeted to $3,722/oz. The market logic is clear: the better the economic performance, the more confident the Fed will be in slowing or even pausing its rate cuts, and the higher the opportunity cost of holding non-interest-bearing gold. Currently, all market participants are focused on the upcoming release of the US Core PCE Price Index for August. This is the Fed's preferred inflation indicator, and its performance will directly provide the most critical basis for the Fed's next move. Investors will also need to monitor speeches by other Fed officials and news related to geopolitical developments.
Technical Analysis:
The US dollar index rose sharply, reaching a nearly two-week high, closing up 0.58%. Spot gold prices fluctuated, repeatedly testing the $3,760 mark during the session before facing pressure. Gold is currently fluctuating within a broad range, with intense buying and selling activity. Key support is forming below 3718/22, while resistance is forming above 3758/62. Continue to monitor this range for the day. Technically, the daily chart is trading above and below the 5-day moving average, with the RSI indicator trading above 70. The short-term hourly and four-hour moving averages are converging, and the Bollinger Bands are gradually closing. Prices are converging within the mid-range, with the RSI consolidating towards 50. Gold is expected to continue its broad range-bound trading on Friday. The day's trading strategy remains to sell high and buy low, with short-term participation.
Trading Strategy:
Short-term gold buy at 3722-3725, stop loss at 3714, target at 3760-3780;
Short-term gold sell at 3762-3765, stop loss at 3774, target at 3730-3710;
Key Points:
First support level: 3737, second support level: 3722, third support level: 3704
First resistance level: 3762, second resistance level: 3788, third resistance level: 3805

Gold price analysis September 26#XAUUSD Technical Analysis
In the New York session, selling pressure is dominating as gold is continuously restrained by the falling trendline. This suggests that the market may enter a short-term correction. The nearest target of the decline is determined around the 3705 area today.
However, the 3750 area is still an important key level. If the price has a confirmation candle closing above this area, the uptrend will likely return, opening up opportunities for the uptrend to continue.
📉 Reference strategy
SELL: When the price reacts and rejects at the 3750 area
Target: 3705

Gold is trading sideways. Focus on PCE data.Gold's 1-hour moving average continues to trend downward, and gold bears may continue to exert their strength. Although it remains volatile, the overall trend has begun to fluctuate downward, and each rebound in the 1-hour gold price has been under pressure.
On Thursday, the price briefly dipped below the 5-day moving average in Asian trading before stabilizing and rebounding. However, it broke below it again during the US trading session. Although it closed above the moving average, it failed to reverse the weak trend.
Currently, 3715 below has become the core support level. If it breaks through this position downward, the adjustment space may open further. The upper resistance will primarily focus on the pressure near 3760. If this position cannot be broken through strongly, the weak and volatile tone will continue.
Trading strategy:
Short around 3760, stop loss at 3770, profit range 3730-3720.
Short around 3760, stop loss at 3770, profit range 3730-3720.
Maintain this strategy before the release of the US PCE data. After the data is released, observe market trends and adjust the strategy.

Gold 1H – Will Gold Correction Extend Toward Discount Zones?Gold on the 1H timeframe is trading near 3,745 after repeated bearish pushes, with premium resistance clustered at 3,780–3,778 and a secondary resistance zone at 3,748–3,746. Discount demand remains positioned lower at 3,713–3,706 and deeper near 3,665. Recent CHoCH signals confirm short-term bearish pressure, suggesting engineered liquidity sweeps into resistance before potential retracements toward discount levels.
Today’s headlines on renewed U.S. inflation worries and expectations of a slower Fed pivot are weighing on sentiment, while ongoing Middle East geopolitical tensions keep safe-haven demand alive. This dynamic may fuel intraday volatility, with liquidity hunts at resistance zones likely before directional clarity develops.
________________________________________
📌 Key Structure & Liquidity Zones (1H):
• 🔴 SELL GOLD LIQUIDITY 3,780–3,778 (SL 3,787): Premium resistance where sweeps may trigger rejection toward 3,760 → 3,740 → 3,730.
• 🔴 SELL GOLD 3,748–3,746 (SL 3,755): Intraday resistance zone aligned with 0.5–0.618 retracement, offering downside targets at 3,730 → 3,720 → 3,715.
• 🟢 BUY ZONE 3,697–3,699 (SL 3,692): Discount demand in line with liquidity magnets, with upside targets at 3,715 → 3,730 → 3,745+.
________________________________________
📊 Trading Ideas (Scenario-Based):
🔻 Sell Setup – Liquidity Run (3,780–3,778)
• Entry: 3,780–3,778
• Stop Loss: 3,787
• Take Profits:
TP1: 3,760
TP2: 3,740
TP3: 3,730
🔻 Sell Setup – Intraday Rejection (3,748–3,746)
• Entry: 3,748–3,746
• Stop Loss: 3,755
• Take Profits:
TP1: 3,730
TP2: 3,720
TP3: 3,715
🔺 Buy Setup – Discount Demand (3,697–3,699)
• Entry: 3,697–3,699
• Stop Loss: 3,692
• Take Profits:
TP1: 3,715
TP2: 3,730
TP3: 3,745+
________________________________________
🔑 Strategy Note
With U.S. inflation concerns and geopolitical risks keeping gold under mixed pressure, intraday strategies should focus on fading liquidity grabs into premium resistance while being prepared to buy dips at well-defined discount demand. Expect volatility around 3,780 liquidity sweeps before corrections extend toward the 3,713–3,706 zone.

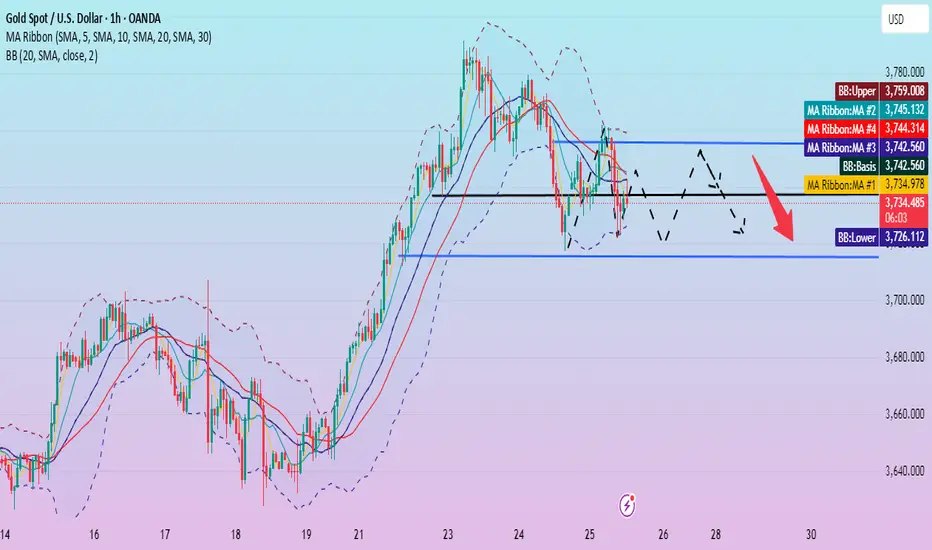
3717 Won’t Hold—Gold’s Next Breakdown AheadThe highest point of gold during the day was around 3761. It can be clearly seen that as the bullish momentum of gold gradually declines, the high point of the candlestick chart is also gradually moving downward. Judging from the daily candlestick chart, a bearish candlestick chart appeared for the second consecutive day today, and it is very likely to close in a doji pattern, suggesting that gold is likely to continue to fall.
From the perspective of short-term morphological structure, gold has currently perfectly constructed a downward trend channel based on the wave top areas of 3790, 3778 and 3761; and upper shadows appear on many candlestick charts, suggesting that the selling pressure from above is relatively large, and the center of gravity continues to move downward and test the lower support area many times. Based on the current structure, 3717 is likely not the current low, and gold will continue to fall. The upper short-term resistance is in the 3750-3760 area; the lower support is in the 3715-3705 area, followed by the 3695-3690 area.
Therefore, for short-term trading:
1. Prioritize waiting for a gold rebound and then continue shorting gold within the 3750-3760 area; the short-term target is 3725-3715.
2. If gold first retreats to the 3715-3705 area, we can take advantage of the initial pullback and go long gold in that area, with the short-term target being 3730-3740.

Algo Games Begin Below 3748…🔱 GoldRush_Traders Forecast
🕰️ Based on 22:00 UK close (Thursday 25th Sep)
⚠️ Forecast the reaction — not just the level.
🔵 SCENARIO OUTLOOK:
✅ BULLISH:
• 3720–3736 holds firm
• Reclaim 3748 → Target 3757 / 3768
• EMAs re-stack bullish on 5m/15m
• NY continuation possible if DXY weakens
❌ BEARISH:
• Clean break below 3720 → 3708 / 3695 next
• EMA structure breaks down with volume
• DXY strength could force deeper flush
🔁 SIDEWAYS / TRAP:
• Range between 3732–3745
• Sweeps both sides before true move
• Algo bait during low liquidity zones
🧠 Tip: "Don’t trade the level – trade the reaction."

Is the correction over? Has the low been reached?This price correction began near the upper Bollinger Band at 3760, reaching a low near the lower Bollinger Band at 3722. It's currently rebounding slightly and trading near the middle Bollinger Band. The 1-hour MA20 moving average is converging with the middle Bollinger Band, indicating the possibility of further price adjustments in the short term.
Gold's 1-hour moving average is sloping downward, and the price is currently fluctuating around the low of 3735. Despite the bearish US initial jobless claims data, gold prices did not fall. Instead, they rebounded from around 3722 to 3745 before falling under pressure. As of now, it has not broken through the important support level of 3715. This level is a key focus in the short term.
From the 4-hour perspective, the effective support below is still maintained around 3715, which is consistent with the 1-hour line support. The upper pressure is focused around 3755. The short-term operation strategy of maintaining range fluctuations remains unchanged.
Trading strategy:
Go long around 3715, stop loss at 3705, profit range 3740-3750.
Short around 3755, stop loss at 3765, profit range 3725-3710.
The price fell as expected. Waiting for a rebound?Gold prices fell as expected. Quaid recommends maintaining the strategy and waiting for a rebound before continuing to short.
The 1-hour moving average has begun to turn downward, and gold bullish momentum is gradually weakening. US data is slightly bearish, and short-term fluctuations and declines will continue. Despite a slight rebound to 3745, downward pressure remains. Currently, the price is suppressed by the downward trend line, so shorting is still necessary for rebounds.
Gold bullish momentum is gradually weakening. Following the market trend and executing a short-selling strategy at the rebound high is market insight.
The short selling strategy near position 3755 remains unchanged, waiting for a rebound to continue short selling. If you want to trade aggressively, you can go long with a light position around 3715, and the profit point is above 3735.

The trend has not changed, continue to shortAfter yesterday's high-level fluctuations, gold prices retreated significantly in the US market due to news, hitting a low near 3717.
Yesterday's daily gold price closed in the red, with the MA5 moving average near 3735. If today's daily closing price falls below the MA5 and reaches the MA10, bears will regain control of the market. Looking at the 4-hour Bollinger Bands, after breaking below the middle line, the price has fluctuated, briefly stabilizing near 3735. Currently, it is consolidating sideways, but if the European/US session breaks below 3735-3720, further declines to 3710-3700 are possible. The short-term downward trend is still under pressure and the market is in a weak state. Therefore, intraday gold trading is still mainly short selling, with long buying as an auxiliary.
The main pressure range above is 3750-3765. If the rebound touches the upper resistance range without breaking it, you can continue to short gold. The short-term support is at 3735-3720 below. If it falls back but does not break through, you can go long with a light position. Strong support focuses on the previous top and bottom conversion of 3710-3700.
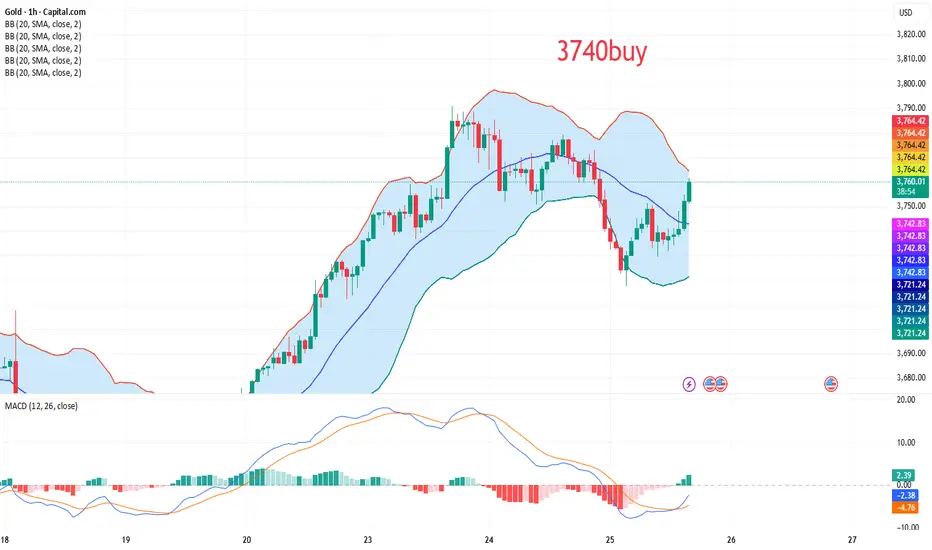
Do I need to close the long gold position I bought at 3740?The instruction was issued an hour ago. The text clearly explains the buying bullish operation idea, which is to go long based on the signal that the gold price breaks through the short-term resistance level of $3,740.
Based on the current market price, long orders entered at $3,740 have achieved an increase of approximately $10. For investors with more conservative risk appetite, they may consider partially reducing their positions or taking profits. I plan to hold my current position. The gold price will face the next key pressure level of $3,760 in the future. If it breaks through effectively, it is expected to rise further. Specific operations will be adjusted dynamically according to market trends to maintain flexibility.
I'd be honored if you agree with this idea! If you have your own opinions, please leave a comment in the comment section. I look forward to seeing your ideas and sharing them with you!