Gold continues to surge. Is it unstoppable?Last week, a single social media post by President Trump wiped out $2 trillion in US stock market value, with the S&P 500 index falling 2.7% that day, its worst performance since early April. The reality of this incident demonstrates that Trump's authoritarian trade policies continue to influence the fate of the global economy.
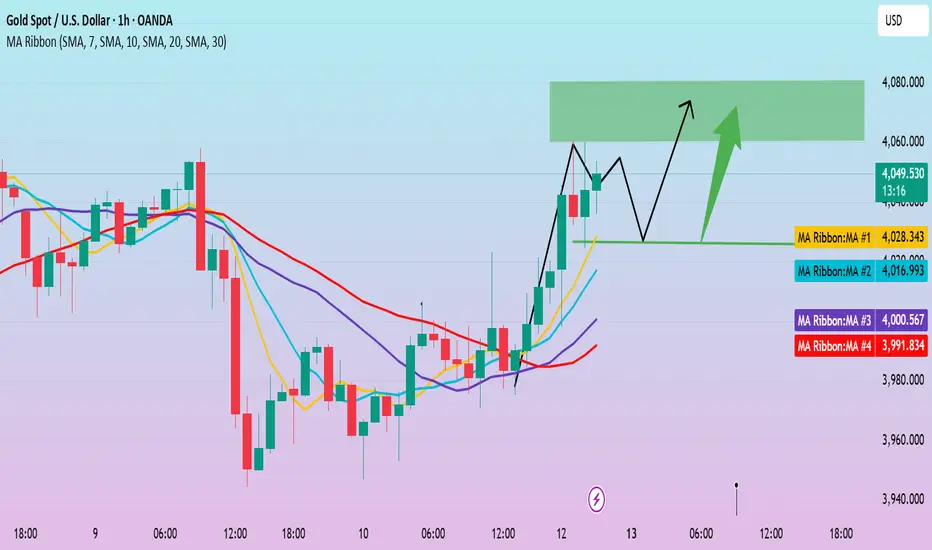
In early Asian trading on Monday, gold briefly hit $4,060, a new all-time high. With market concerns easing slightly, it is currently fluctuating around the 4,050 high.
Looking at the 4-hour chart, Quaid believes gold prices still have the potential to reach new highs. Current support is around 4,035, followed by 4,020.
If support at 4,035 is broken, gold could potentially reach the 4,080-4,090 high. This is because 4,035 is at the 0.618 Fibonacci support level, while 4,020 is at the 0.50 level.
However, the possibility of a deeper pullback to 4020 cannot be ruled out. As long as gold remains above 4020 in the short term, it remains strong.
For short-term operations, Quaid recommends that you can go long around 4035. If the price breaks through 4060, the target may reach 4080-4090.
Goldprediction

Gold outlookKeep eyes on both level 4060.5 and 4024.5 . if 15min candle close upper and below level then we can see a good target.
Most people's are making short position but gold moves are so unpredictable in recent time's. So trade accordingly.

Risk aversion is intensifying. Is the rally accelerating?In early Asian trading on Monday, gold continued to rise, rising 1% at one point to a record high of $4,060 per ounce. Due to the tense international trade situation, escalating geopolitical risks, expectations of a Federal Reserve rate cut, and political turmoil in many countries, the safe-haven demand for gold remained high. As a non-interest-bearing asset, gold has once again proven its status as the "king of safe havens" amidst uncertainty shrouding global markets.
Gold is currently maintaining its trend, with a strong bullish structure intact, and has seen eight consecutive weeks of gains on the weekly chart. From a technical perspective, the RSI indicators on the daily and weekly charts have both reached 80, indicating overbought conditions. However, the daily MA10/7-day moving averages continue to open upward and gradually move up. After several rounds of adjustments last week, the market finally closed above the 5-day moving average of 4,000.
Technically, gold remains primarily bullish on dips, but be wary of sharp pullbacks after overbought levels. Recent market volatility is significant, so strict risk management is essential when participating in the market, and opportunities for entry during pullbacks are crucial.
Trading Strategy:
Long around 4025, stop-loss at 4015, profit range 4060-4080;
Short around 4080-4085, stop-loss at 4095, profit range 4040-4020;
Gold → Peak or correction? Market forecast for next weekLast Friday, we shorted gold at 3977 and 4000 points. Gold prices fell as low as 3946, and both of our short positions yielded profits. During the US trading session, gold prices rallied again, rising above 4000 points on the back of safe-haven sentiment.
Trade conflicts are volatile. Since Trump took office on January 20th of this year, the tariff issue has fluctuated between intense and easing. Now, the Sino-US tariff trade friction has escalated again, with Trump announcing an additional 100% tariff on Chinese goods effective November 1st. This was the main reason for last Friday's rebound.
The key lies in the Federal Reserve's October interest rate cut. While the probability of a 25 basis point cut is as high as 92.4%, the government shutdown has raised concerns that it may be delayed. Furthermore, the Fed minutes revealed that some officials, concerned about a rebound in inflation, oppose further rate cuts.
A brief ceasefire agreement between Israel and Hamas in the Middle East has eased geopolitical risks, raising concerns about boosting safe-haven demand. Gold prices have risen over 15% in the past two months. While a large number of profit-taking investors remain bullish on future gold prices, they are quick to flee at the slightest sign of trouble, especially during a rapid price drop.
Technically, after a relatively high daily and weekly close, there may be further upward momentum in the coming trading days. A new round of extreme gains followed by a sharp decline cannot be ruled out.
Resistance: 4030, 4058
Support: 4000, 3980
Trading Strategy:
Currently, the market is trading within the broad range of 3944-4058. The direction of the breakout will determine whether this is a correction or a peak. Shorting rallies within this range is the primary strategy. (Specific trading signals will be determined based on intraday trends.)
Next week, I will continue to share my personal trading signals. Wishing everyone gets what they hope for when the market opens tomorrow.
For specific trading decisions, please follow my live updates. I will update my trading ideas and strategies daily. If you don't have a plan or strategy for gold trading and are struggling to achieve consistent profits, you can refer to and follow my updates for guidance and help you avoid mistakes.
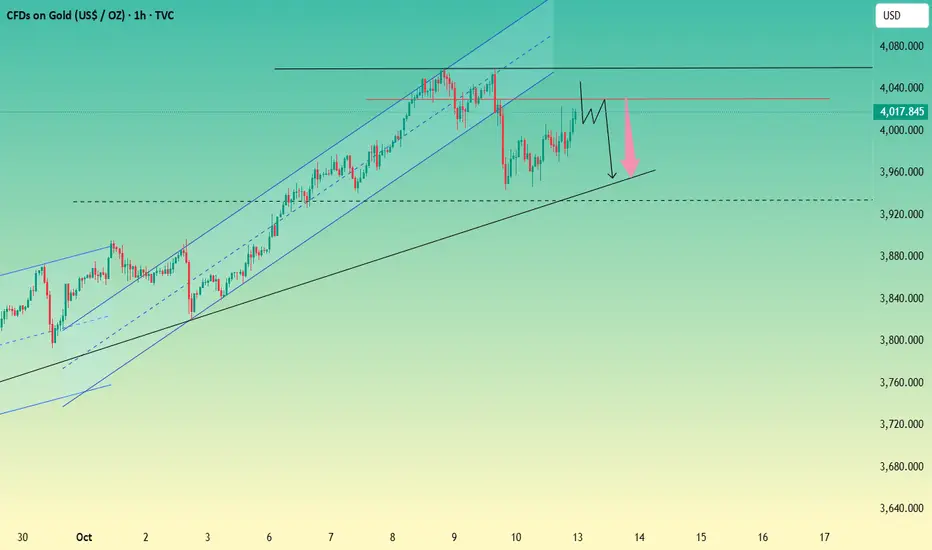
GOLDGold has tapped our target level 4020, now we will be looking for sells this week as long as Gold respects the top.
Disclosure: We are part of Trade Nation's Influencer program and receive a monthly fee for using their TradingView charts in our analysis.

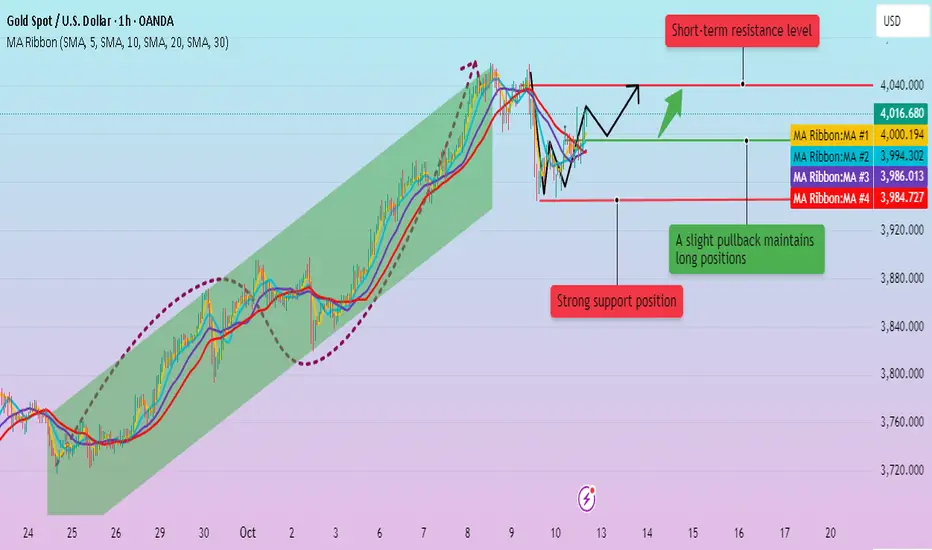
In-depth Market Analysis. Outlook for Next Week.The gold market experienced several pullbacks this week, but it rebounded during the US trading session, driven by risk aversion, ultimately closing at a relatively high level. Current geopolitical uncertainty continues to support gold prices, keeping the metal strong. On a weekly basis, gold has risen for eight consecutive weeks, maintaining an overall bullish trend. Weekly support is currently around 3944, with resistance primarily focused on the 4040 area, followed by this week's high near 4059.
On a daily basis, gold rebounded after a second dip on Friday, ultimately closing at the high, indicating strong buying support at lower levels. This provides a positive signal for the medium- to long-term market trend. At the same time, the daily chart shows that the closing price is above the 5-day moving average, and the short-term trend continues to be bullish based on the 5-day moving average.
The 4-hour Bollinger Bands are flattening, suggesting a period of high volatility in the short term. The candlestick chart has closed above the middle band, and the 5-day moving average is converging with the 10-day moving average and is about to diverge upwards. This indicates that gold is currently experiencing a volatile and strong trend, with the potential for further upward movement in the short term.
Based on a comprehensive analysis of technical patterns and fundamental factors, long-term dips remain the primary strategy unless a clear reversal signal emerges.
At the beginning of next week, the focus will be on whether prices can continue their upward momentum, but at the same time, we must be wary of the risk of a pullback if we fail to break through the upward resistance.
Gold is Ready For Bullish Move From SupportHello Traders
In This Chart GOLD HOURLY Forex Forecast By FOREX PLANET
today Gold analysis 👆
🟢This Chart includes_ (GOLD market update)
🟢What is The Next Opportunity on GOLD Market
🟢how to Enter to the Valid Entry With Assurance Profit
This CHART is For Trader's that Want to Improve Their Technical Analysis Skills and Their Trading By Understanding How To Analyze The Market Using Multiple Timeframes and Understanding The Bigger Picture on the Charts

GOLD MONTHLY CHART LONG TERM/RANGE ROUTE MAPHey Everyone,
We’ve just released our new Monthly Chart idea, which we’ll now be tracking following the successful completion of our previous long term monthly chart idea. That one played out beautifully, and now it’s time to shift focus to the next big setup.
Currently, price is trading above the channel midline, and we’ve also seen an important EMA5 cross and lock above 3099, with a candle body close confirming a long term gap above at 3557.
While this confirms the bullish long term structure, we’re also mindful of the potential for a short term retracement, particularly around the EMA5 detachment zone (highlighted with a circle on the chart). This would offer a healthy dip opportunity, aligning perfectly with our strategy to buy into weakness on the way up.
For the bigger structure to remain intact, we’ll be looking for 3099 to continue holding as key structural support. As long as that level is respected, the long term gap toward 3557 remains firmly in play.
This is a higher timeframe idea that we’ll be building on as structure continues to unfold.
We will continue to use all support structures, across all our multi time frame chart ideas to buy dips also keeping in mind our long term gaps above. Short term we may look bearish but looking at the monthly chart allows us to see the bigger picture and the overall long term Bullish trend.
As always, we will keep you all updated with regular updates throughout the week and how we manage the active ideas and setups. Thank you all for your likes, comments and follows, we really appreciate it!
Mr Gold
GoldViewFX

GOLD WEEKLY CHART MID/LONG TERM ROUTE MAPWeekly Chart Update – Follow Up
3732 & 3806 Objectives Achieved, 3910 Gap Opens
Hey Everyone,
Last week’s structure played out precisely as projected, we achieved our 3806 target following a confirmed body close above 3732, validating the continuation leg within our Goldturn structures.
This week, we’ve seen a weekly candle body close above 3806, officially opening the 3910 gap zone. The bullish structure remains well defined, supported by four consecutive weeks of EMA5 detachment, which confirms sustained upside momentum. However, this extended separation also signals potential for sharp corrective phases, requiring careful risk management and dynamic positioning.
Current Outlook
🔹 3732 Breakout & 3806 Objective Completed
Last week’s projected upside target was met precisely following a strong candle close confirmation.
🔹 3910 Gap Now Active
With the weekly close above 3806, the next structural resistance opens toward the 3910 zone.
🔹 EMA5 Detachment (4 Weeks Running)
Persistent detachment supports ongoing bullish momentum, but traders should remain alert for any mean reversion pullbacks or exhaustion on lower timeframes.
🔹 Support Structure
Immediate support now rests at 3806, followed by 3732 as a pivotal retest zone. Deeper support sits at 3659, which aligns with the ascending channel top confluence a critical structural level if broader correction unfolds.
Updated Key Levels
📉 Supports: 3806 (immediate), 3732 (secondary), 3659 (pivotal channel confluence)
📈 Resistance / Next Upside Objective: 3910–4015 zone
Plan & Risk Outlook
The bullish framework remains intact, but with EMA5 detachment now stretched, traders should anticipate volatility spikes or short term corrective dips. A controlled pullback into the lower Goldturns would be considered technically healthy and may offer fresh accumulation opportunities in line with the broader structure.
We’ll continue to monitor for confirmation closes and EMA5 realignments during the week to gauge whether momentum extends or correction begins.
Trade safe, stay disciplined, and manage exposure around volatility.
Mr. Gold
GoldViewFX

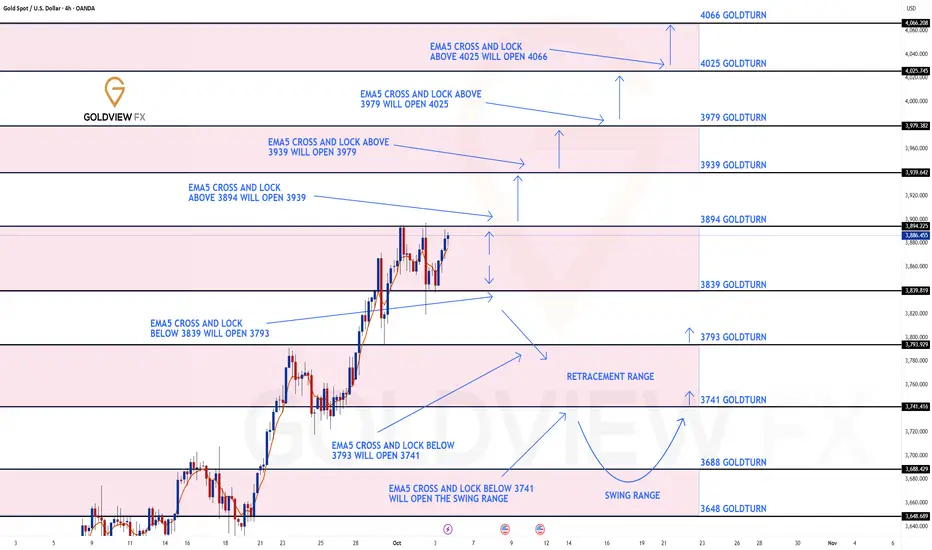
GOLD 4H CHART ROUTE MAP UPDATE & TRADING PLAN FOR THE WEEKHey Everyone,
Please see our updated 4h chart levels and targets for the coming week.
We are seeing price play between two weighted levels with a gap above at 3894 and a gap below at 3839. We will need to see ema5 cross and lock on either weighted level to determine the next range.
We will see levels tested side by side until one of the weighted levels break and lock to confirm direction for the next range.
We will keep the above in mind when taking buys from dips. Our updated levels and weighted levels will allow us to track the movement down and then catch bounces up.
We will continue to buy dips using our support levels taking 20 to 40 pips. As stated before each of our level structures give 20 to 40 pip bounces, which is enough for a nice entry and exit. If you back test the levels we shared every week for the past 24 months, you can see how effectively they were used to trade with or against short/mid term swings and trends.
The swing range give bigger bounces then our weighted levels that's the difference between weighted levels and swing ranges.
BULLISH TARGET
3894
EMA5 CROSS AND LOCK ABOVE 3894 WILL OPEN THE FOLLOWING BULLISH TARGETS
3939
EMA5 CROSS AND LOCK ABOVE 3939 WILL OPEN THE FOLLOWING BULLISH TARGET
3979
EMA5 CROSS AND LOCK ABOVE 3979 WILL OPEN THE FOLLOWING BULLISH TARGET
4025
EMA5 CROSS AND LOCK ABOVE 4025 WILL OPEN THE FOLLOWING BULLISH TARGET
4066
BEARISH TARGETS
3839
EMA5 CROSS AND LOCK BELOW 3793 WILL OPEN THE FOLLOWING BEARISH TARGET
3741
EMA5 CROSS AND LOCK BELOW 3741 WILL OPEN THE SWING RANGE
3688
3648
As always, we will keep you all updated with regular updates throughout the week and how we manage the active ideas and setups. Thank you all for your likes, comments and follows, we really appreciate it!
Mr Gold
GoldViewFX
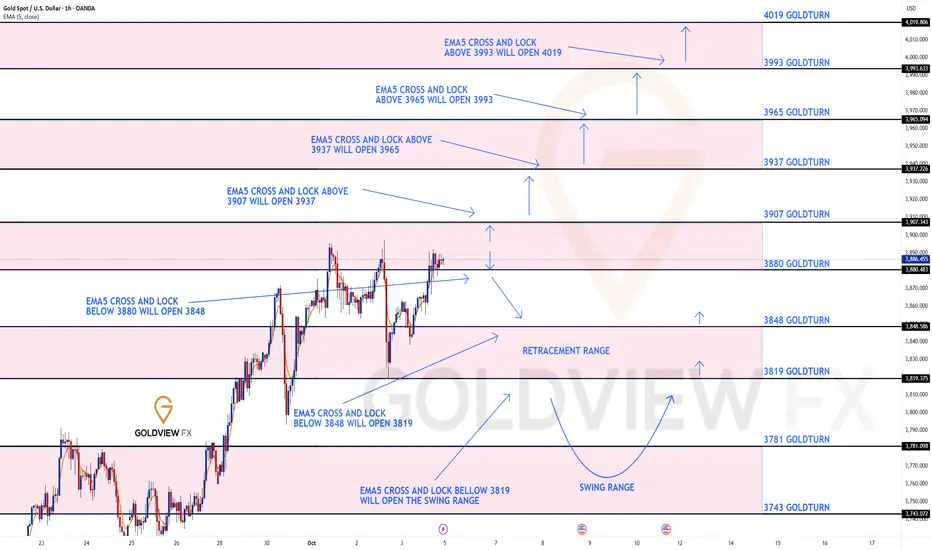
GOLD 1H CHART ROUTE MAP UPDATE & TRADING PLAN FOR THE WEEKHey Everyone,
Please see our updated 1h chart levels and targets for the coming week.
We are seeing price play between two weighted levels with a gap above at 3907 and a gap below at 3880. We will need to see ema5 cross and lock on either weighted level to determine the next range.
We will see levels tested side by side until one of the weighted levels break and lock to confirm direction for the next range.
We will keep the above in mind when taking buys from dips. Our updated levels and weighted levels will allow us to track the movement down and then catch bounces up.
We will continue to buy dips using our support levels taking 20 to 40 pips. As stated before each of our level structures give 20 to 40 pip bounces, which is enough for a nice entry and exit. If you back test the levels we shared every week for the past 24 months, you can see how effectively they were used to trade with or against short/mid term swings and trends.
The swing range give bigger bounces then our weighted levels that's the difference between weighted levels and swing ranges.
BULLISH TARGET
3907
EMA5 CROSS AND LOCK ABOVE 3907 WILL OPEN THE FOLLOWING BULLISH TARGETS
3937
EMA5 CROSS AND LOCK ABOVE 3937 WILL OPEN THE FOLLOWING BULLISH TARGET
3965
EMA5 CROSS AND LOCK ABOVE 3965 WILL OPEN THE FOLLOWING BULLISH TARGET
3993
EMA5 CROSS AND LOCK ABOVE 3993 WILL OPEN THE FOLLOWING BULLISH TARGET
4019
BEARISH TARGETS
3880
EMA5 CROSS AND LOCK BELOW 3880 WILL OPEN THE FOLLOWING BEARISH TARGET
3848
EMA5 CROSS AND LOCK BELOW 3848 WILL OPEN THE FOLLOWING BEARISH TARGET
3819
EMA5 CROSS AND LOCK BELOW 3819 WILL OPEN THE SWING RANGE
3781
3743
As always, we will keep you all updated with regular updates throughout the week and how we manage the active ideas and setups. Thank you all for your likes, comments and follows, we really appreciate it!
Mr Gold
GoldViewFX
Gold 4H – Bullish Setup Ahead of Fed & CPI Week🥇 XAUUSD – Weekly Smart Money Plan | by Ryan_TitanTrader
📈 Market Context
Gold continues to trade near the $4,000 mark as traders brace for a volatile week driven by the U.S. CPI release and Federal Reserve remarks.
Recent Fed comments hint that policymakers are open to rate cuts if inflation cools further, boosting gold’s appeal as a hedge against policy easing and market uncertainty.
Meanwhile, tensions in the Middle East and strong central bank demand for gold continue to provide underlying bullish momentum, though short-term pullbacks remain likely.
🔎 Technical Analysis (4H / SMC Style)
• The higher-timeframe BOS (Break of Structure) confirms that gold remains in a bullish market phase, with buyers defending every major retracement.
• The current pullback could target the Potential Reaccumulation Zone around 3947, where liquidity may be swept before the next bullish impulse.
• The Discount Demand Zone (3873–3875) aligns with strong 4H imbalance and previous structure support — ideal for a high-probability buy setup.
• The Premium Supply Zone (4134–4132) is positioned as a liquidity target, where price may react for short-term corrections.
🟢 Buy Zone: 3873–3875
SL: 3866
TP targets: 3947 → 4020 → 4050 → 4130+
🔴 Sell Zone: 4134–4132
SL: 4141
TP targets: 4080 → 4020 → 3950
⚠️ Risk Management Tips
• Wait for H1 ChoCH / BOS confirmation before executing positions.
• Anticipate liquidity hunts near 3950–3970 ahead of CPI or Fed events.
• Use partial scaling and secure partial profits once the structure confirms continuation.
• Avoid entering during the first 15 minutes of major news releases to reduce slippage risk.
✅ Summary
Gold remains structurally bullish on the 4H timeframe, with potential retracement opportunities offering premium entries.
Smart Money may induce a liquidity sweep into 3873–3875 before pushing toward 4130+, where a reaction from institutional supply is likely.
With major macro catalysts this week, traders should expect sharp volatility and manipulative moves before the next major leg develops.
🔔 Stay patient — let the market reveal its intent before entering.
Premium buys remain favored above 3870 while watching for potential distribution near 4130.

Gold is fluctuating slightly. Watch the market.Gold has been quite active recently, entering a pullback and correction mode. On the daily chart, it's almost forming a high-level engulfing pattern. Therefore, today's close is crucial. Whether it continues to decline, remains volatile, or rebounds strongly upwards will be crucial for future trends.
In the 4-hour level, the price temporarily maintains a narrow range of oscillation and repair, and the price is under pressure at 4010. The moving average trend at the 1-hour level tends to be flat, and there are signs of moving downward. The K-line begins to slowly break through the short-term moving average and maintains a weaker trend. There is potential for further downward correction in the late trading session, with continued strong support at 3950.
Gold Trading Strategy:
Go long on gold at 3970-3960, with a stop-loss at 3950 and a profit range of 4015-420.

Gold - Just buy the all time high!🔱Gold ( TVC:GOLD ) will rally even higher:
🔎Analysis summary:
Gold remains totally bullish. And after the recent all time high breakout rally of about +15%, traders are willing to accept much higher prices. Following the significant long term rising channel formation, Gold will rally another +25% before we will see a retracement.
📝Levels to watch:
$4.000, $4.500
SwingTraderPhil
SwingTrading.Simplified. | Investing.Simplified. | #LONGTERMVISION

Gold is unpredictable. Stay vigilant.Gold plummeted over $100 on Thursday, its largest single-day drop since May 12th of this year. This, in itself, will have a certain dampening effect on gold bulls. The decline is a technical correction. However, caution is advised: since gold has experienced a sharp drop, its short-term strength will not be as strong as at the beginning of the week. Therefore, there are two possible scenarios for gold's trend: a high-level oscillation within the bullish trend, or a volatile pullback before a rebound. For short-term trading, it is best to go long on dips and be bullish.
From a technical perspective, although the price has experienced multiple pullbacks, it is still trading above 3900. A trend change is possible only if it falls below 3900. The short-term Bollinger Bands on the 4-hour level are closing, and it may fluctuate at a high level for a while.
The current trend is consistent with my earlier prediction: a rebound followed a pullback to 3970. The price also briefly broke through 4020 before a brief pullback. If this rebound breaks through $4000 and remains above 4010, upward pressure will likely focus on around 4030.
Trading Strategy:
Buy in batches between 3960-3970, with a stop-loss at 3050. Profit range: 4010-4020.
Short around 4015, with a stop-loss at 4025. Profit range: 4000-3980-3970.

Beware of false gold price drops and real gold price rises
News:
Although gold prices quickly stabilized and rebounded after the ceasefire agreement in Gaza, briefly approaching all-time highs, the easing of geopolitical tensions dampened safe-haven buying to some extent, leading some bulls to take profits. Meanwhile, the strong US dollar, which hit a two-month high, caused gold to fall sharply under short-term selling pressure. However, gold prices stabilized and recovered nearly half of their losses, indicating that market expectations of Fed rate cuts and the continued US government shutdown continue to attract bargain-hunting and safe-haven buying, providing support for gold prices.
Looking ahead, despite a short-term pullback in gold prices due to easing tensions in the Middle East, the medium- to long-term bullish outlook remains clear. The Fed has begun its interest rate cut cycle, leading to lower real interest rates and reducing the opportunity cost of holding gold. Furthermore, the potential for resurgence in Middle Eastern tensions, the ongoing US government shutdown, continued central bank gold purchases, and high uncertainty in the global economy and trade are all factors that could support further price increases.
Specifically:
The four-hour lifeline is currently around 4000, serving as the dividing line between volume and rhythm. Below this level, focus on the range from the lifeline to the lower band (4000-3940). Above this level, focus on the range from the lifeline to the upper band (4000-4040).
The upper double-line support on the hourly chart, in conjunction with the ascending channel, forms an upward trend. The upper double-line support is at 3995, and the channel range is 4040-3940.
Yesterday, the price fell below 4000, falling back into the ascending channel, extending the decline. After breaking below the upper double-line support, the price confirmed resistance at the upper double-line support in the 3995-4000 range in early trading today, continuing to suppress the decline and searching for the 3975-65 range. The upper double-line support is currently at 3990, and the dividing line remains at 4000. The upper channel band is at 4045, and the lower channel band is at 3935.
Trading strategy:
Buy: 3975-3960, SL: 3945, TP: 4000-4030

Gold rebounded. Has it reached its peak?Gold has finally experienced its first pullback, falling from a high of 4058 to a low of around 3944, a drop of over 100 points. This marks the first significant pullback since the recent surge in gold prices. The main reason for the sharp pullback in gold prices is the strong dollar rally following the ceasefire agreement between Israel and Hamas, which allowed investors to take profits. Gold prices continued to fall from their highs, ultimately breaking below the 4000 mark, forming a short-term double top.
Affected by the sharp drop, the price of gold has effectively fallen below the 5-day moving average support, and the short-term moving average support function has become ineffective. After Friday's opening, gold prices traded between the 5-day and 10-day moving averages, entering a transitional consolidation range within the short-term moving average. The 5-day moving average has now turned upward, and the 10-day moving average has crossed the 20-day moving average, indicating a flat trend.
The price has currently rebounded near the lower Bollinger Band, and will remain within the upper middle band in the short term.
Short-term support levels: 3970, 3950.
Short-term resistance levels: 4000, 4015, 4030.
Trading strategy:
Short around 4005, stop loss at 4015, profit range 3960-3940.
Long around 3940, stop loss at 3930, profit range 4000-4010.
XAU/USD) – Bullish Channel Continuation with Key Support at $3,9The price is moving within an ascending parallel channel, showing an overall bullish trend.
Currently, gold is trading near $3,996, close to the 70 EMA ($3,991).
A support zone is marked around $3,919–$3,950, which has held price action several times.
🔹 Key Levels
Support zone: $3,919 – $3,950
Immediate resistance: Around $4,000 (psychological level + EMA area)
Target point: $4,065
Loss point (Stop-loss): Below $3,919
🔸 Technical Outlook
Trend Direction:
The upward channel and higher highs indicate continuation of the bullish trend unless price closes below $3,919.
Short-term Movement Expectation:
Price might retest the support zone ($3,950–$3,920).
If support holds, an upward bounce toward $4,065 is likely.
If it breaks below $3,919 with volume, price may fall toward $3,870–$3,850 (lower channel line).
EMA Behavior:
The 70 EMA is currently acting as dynamic support; staying above it keeps the bullish momentum intact.
🎯 Trading Plan Suggestion (Technical Only)
Buy zone: $3,940–$3,960
Take profit: $4,060–$4,070
Stop loss: Below $3,915

Prices fluctuated wildly. Downward pressure persists.On Thursday, the market experienced significant price fluctuations, correcting around 4041.5 before rapidly rising, reaching a high of 4058.2. However, the market reversed during the US trading session. Influenced by news of a ceasefire in the Middle East, prices plummeted below the 4000 mark, reaching a low of 3943.3 before consolidating and closing at 3976.9.
This converging pattern indicates that short-term downward pressure persists.
Short-term Trading Focus:
1. Focus on the 4000 mark. If the price rebounds near this level, consider shorting.
2. After breaking through 4000, consider a final short position at 4020.
Profit targets are 3980-3960. Further declines could target 3945-3920.
A long strategy can start with a small long position around 3945, with a profit range of 3980-4000.

XAU/USD Intraday Plan | Support & Resistance to WatchYesterday, we noted the need for a confirmed break above 4046 to sustain bullish momentum.
However, gold failed to hold above the level, leading to a sharp pullback into lower support zones.
Price is now trading below 4000 and under the 50MA, showing short-term bearish pressure.
A clean break above 4000/MA50 could reignite bullish momentum toward 4020 → 4046 → 4,064. Failure to reclaim 4000 risks a deeper retracement toward 3937 (Secondary Support Zone) and 3909–3881 (Deeper Support Zone) where the MA200 may provide dynamic support.
📌 Key levels to watch:
Resistance:
4000
4020
4046
4064
Support:
3970
3,937
3,909
3,881
🔎 Fundamental Focus | Fri, Oct 10
Today’s key data includes Prelim UoM Consumer Sentiment and Inflation Expectations, alongside multiple FOMC speeches (Daly, Goolsbee, and Musalem) — all of which could provide fresh policy clues and volatility for gold.
⚠️ Note: The US government shutdown continues to impact economic data releases, causing uncertainty around timing, revisions, and overall market reliability.

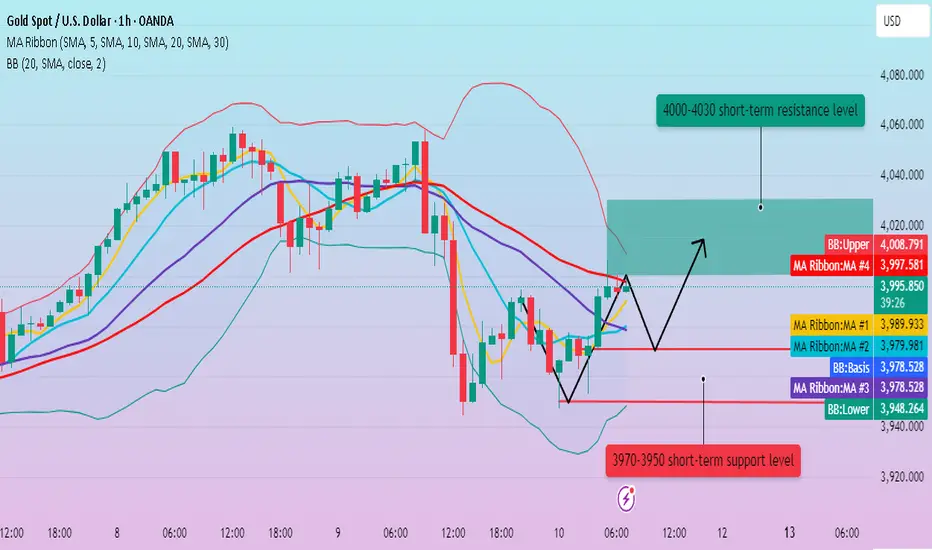
Gold 1H – Price Reaction Ahead of U.S. CPI DataXAUUSD – Intraday Trading Plan | by Ryan_TitanTrader
________________________________________
📈 Market Context
Gold prices remain steady around $3,975, as traders await the U.S. CPI data release later today — a key event that could shape expectations for the Fed’s next rate move.
If inflation cools, the dovish sentiment may boost gold’s safe-haven appeal; however, a hotter CPI print could trigger renewed dollar strength and short-term pressure on XAUUSD.
Market volatility is expected to spike near the release, so liquidity grabs and false breaks are likely before the true direction forms.
________________________________________
🔎 Technical Analysis (H1 / SMC Style)
• The recent Change of Character (ChoCH) confirms short-term bearish control after breaking the bullish structure near 4017.
• FVG Sell Zone (4015–4017) aligns with premium imbalance and prior liquidity — ideal for short setups if price retests that zone.
• BOS to the downside was confirmed at 3960, showing sellers in control.
• The discount zone 3908–3910 is a strong demand area where buyers may step in after liquidity sweep below 3910.
________________________________________
🟢 Buy Zone: 3908–3910
SL: 3900
TP targets: 3920 → 3940 → 3960+
🔴 Sell Zone: 4015–4017
SL: 4022
TP targets: 4000 → 3985 → 3970
________________________________________
⚠️ Risk Management Tips
• Wait for M15 ChoCH / BOS confirmation before entering either side.
• Use partial position sizing around CPI release — volatility may cause large wicks.
• Watch for liquidity hunts near 3980–3990 before CPI, then confirm structure direction.
________________________________________
✅ Summary
Gold is consolidating below key resistance while awaiting U.S. inflation data.
Smart money may engineer a liquidity sweep toward 4015–4017 (FVG) before resuming the bearish leg into 3910.
However, if CPI comes in softer than expected, buyers may defend 3908–3910, sparking a recovery back toward 3980+.
🔔 Stay alert around CPI release hours — expect manipulative price action and confirm structure breaks before committing to directional trades.

XAUUSD: Recovery after the correctionOANDA:XAUUSD After printing a new high at 4059 and retesting the prior high in yesterday’s session, gold came under clear selling pressure. A short-term downtrend has formed. For today’s session, the priority is to look for sell entry when price pulls back into the resistance zone. You can read my previous analysis here:
Today’s balance level: 3950 . If 3950 breaks to the downside, price may continue lower toward before a recovery develops.
📉 Analysis
The short-term structure has shifted to lower high/lower low (LH/LL) intraday , consistent with a tactical correction.
The zone is also a Margin Zone , containing significant CME liquidity and a cluster of Long-call contracts from prior sessions.
Key resistance:
Strong resistance:
Strong support:
📊 Trading Plan
Buy the dip:
Wait to buy at with confirmation.
Targets: first 3950, then .
Stop: below the M5 low of the signal candle. Move to BE at +1R.
Sell at resistance:
Watch reactions at .
If a clear rejection appears (rejection/engulfing), consider a sell entry for the next corrective with target is .
Stop: above the corresponding resistance, manage flexibly.
Please like and comment below to support our traders. Your reactions motivate us to produce more analysis in the future 🙏✨
Victor Dan @ ZuperView

Gold fell sharply. Will there be a strong rebound?Affected by the situation in the Middle East, the market has experienced a deep price correction. This correction is primarily due to news headlines; coupled with gold's recent upward trajectory, reaching new highs, most traders are taking profits.
After hitting a low near 3945, the price has experienced a slight rebound.
The 1-hour chart shows that the MA5 and 10 moving averages show signs of crossing upward, while the MA20 and 30 moving averages turn downward, but the trend is relatively smooth; after the price pulls back and touches the lower track of the Bollinger band, although it rebounds slightly, it is still trading in the middle and lower tracks.
In the short term, pay attention to the 3990 resistance level. After breaking through, the price may rebound sharply and reach above the 4000 mark. Quaid recommends a light long position between 3940 and 3950, with a profit range of 3980 to 4000.
If the upward resistance level cannot be broken for a long time, the price will likely correct again, accumulating momentum and waiting for new catalysts to guide the market's new trend.
